Contents 5
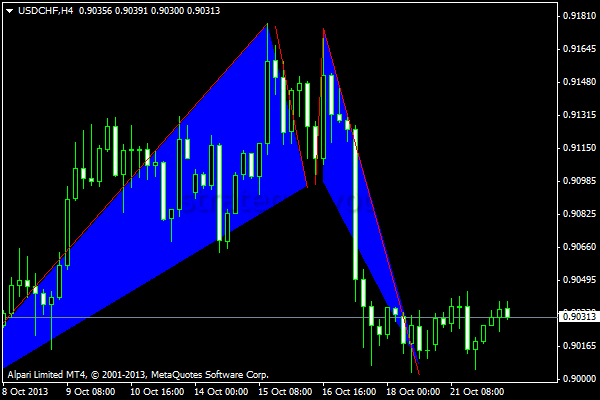 At first the butterfly pattern was seen as a perfect formation that is rarely used in practice. But besides the classic version, similar harmonic patterns were discovered over time: the «shark», the «crab» and the «bat». To apply various technical tools correctly, you need to understand these chart setups and effective ways to trade them.
What the Gartley butterfly is and how to find and trade it
In theory, the Gartley butterfly is a chart pattern used in trading to analyze charts and project future prices. Gartley patterns are considered stand-alone corrective patterns that signal the continuation of the current trend. Here the main trend temporarily changes direction before returning to the original move.
The Gartley butterfly pattern was introduced by Harold M. Gartley, who founded an association of stock market analysts in New York and was an experienced trader, a good teacher and a financial adviser. He published his ideas on charting patterns in the book «Profits in the Stock Market» back in 1935.
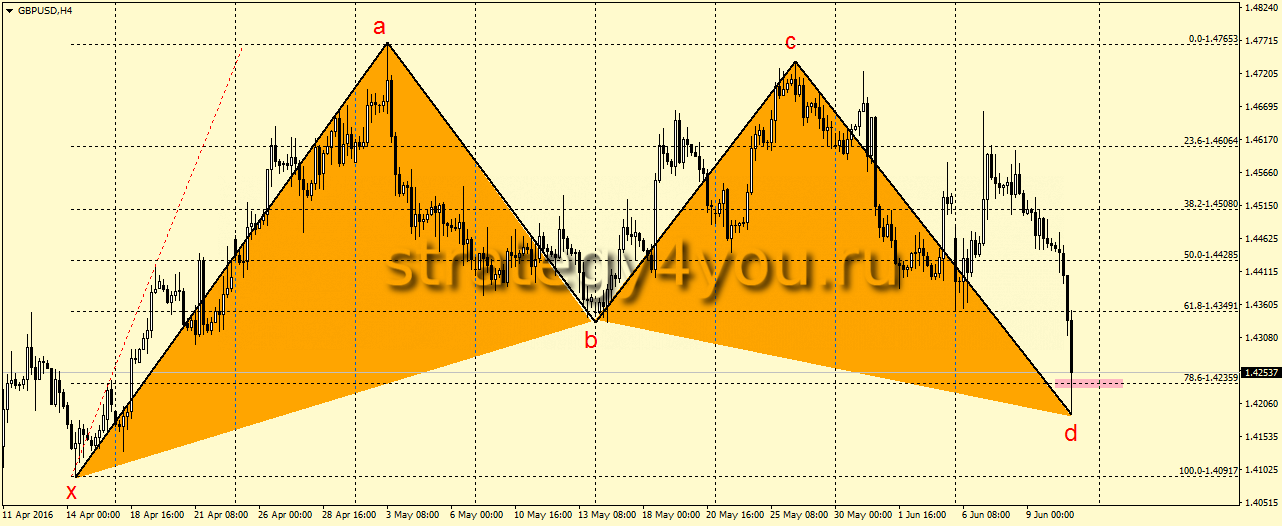
Later his work was extended by S. M. Carney and L. Pesavento: thanks to them, the original pattern, which used to rely on Elliott waves, is now based on the Fibonacci sequence and its «golden ratio». Gartley’s version is the oldest one, and the other harmonic patterns are only modifications of it.
The pattern completes at the final point of a pullback, which lets a forex trader act immediately on the coming market turn and enter a trade at the best possible price:
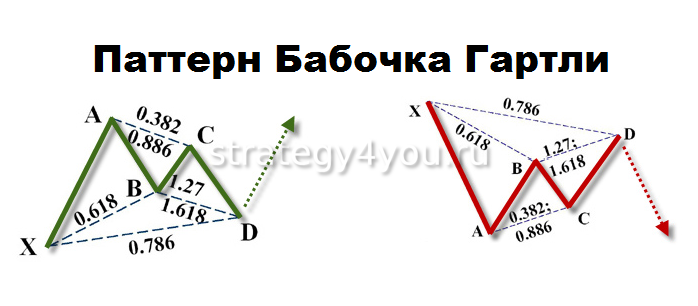
- the AB leg is about 61.8% of the previous XA move;
- the BC leg is 38.2%, 50%, 61.8%, 78.6% or 88.6% of the AB wave;
- the CD leg reaches 127% or 161.8%, or ends at 78.6% of XA.
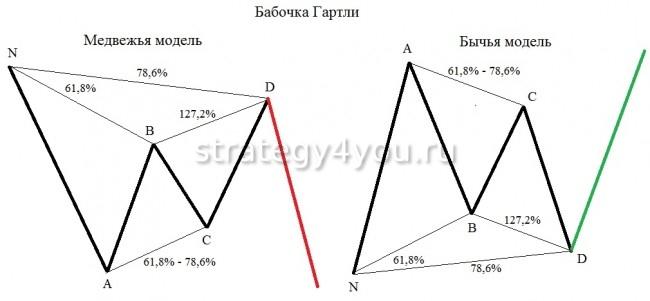
This pattern is a reversal pattern that lets you trade at major highs and lows within your chosen timeframe, in two variations — bullish and bearish.
To trade it successfully, follow this algorithm:
- Find the turning point of the completed trend that sets up the XAB part of the pattern.
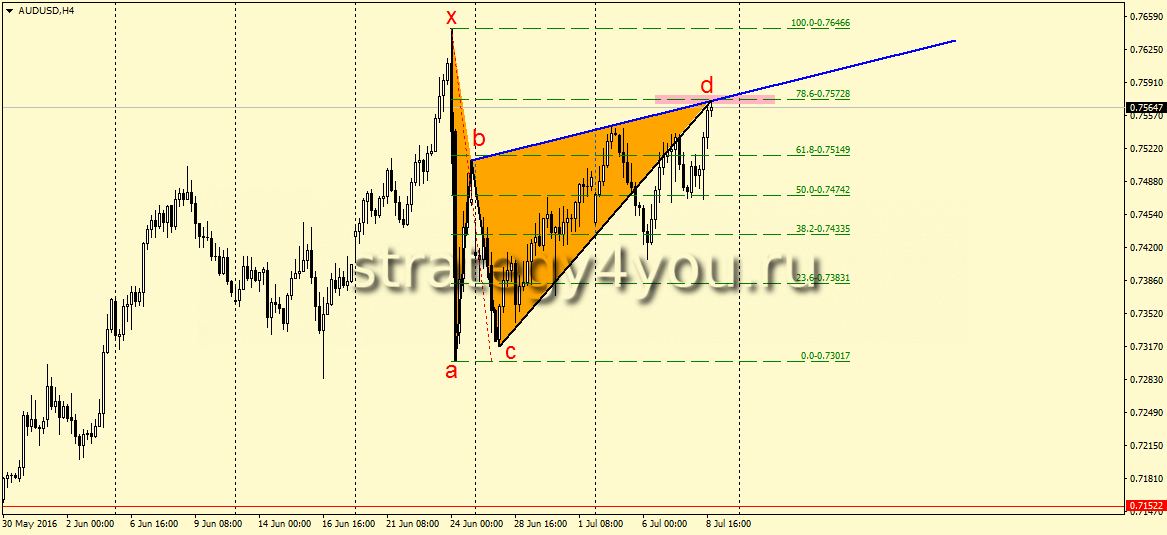
- Check the 78.6% ratio of the AB correction relative to XA.
- Make sure the next move stays within 38.2% — 88.6% of the AB length.
- Mark the 127.2% extension of XA, where point D will be (the point itself must stay within the 161.8% — 261.8% zone of BC).
- Place the order at 127.2% of XA, with a stop loss of at least 1/10 of the next target.
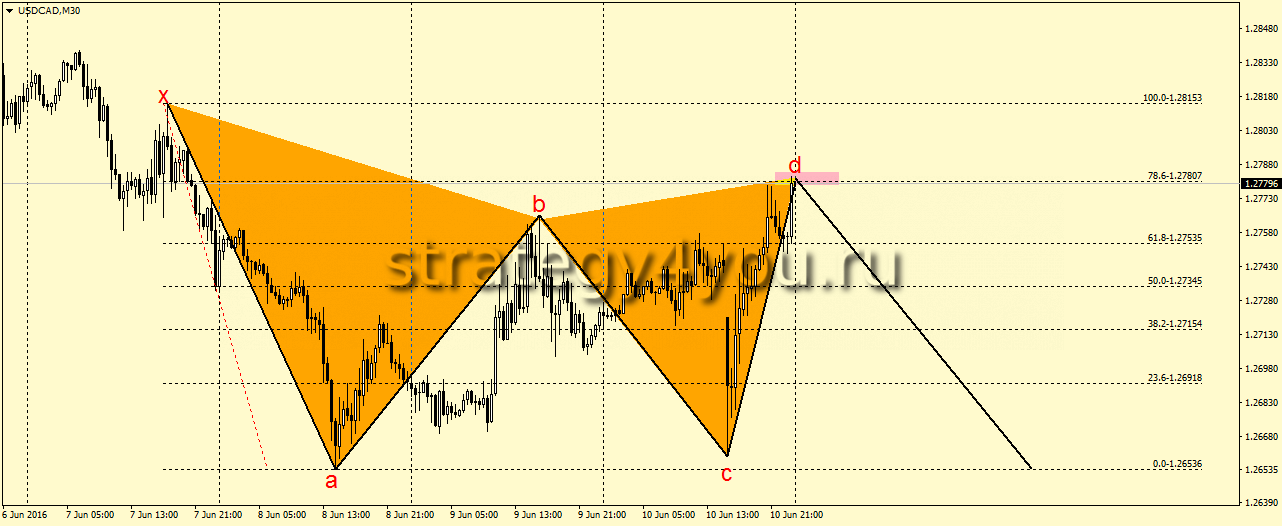
Right after the impulse comes a correction made up of 3 waves. And as the formation completes according to Gartley’s theory, the market returns to its prevailing trend and reaches a new low or high.
- An example of the «Butterfly Effect» forex strategy:
How butterflies are analyzed
 Gartley’s approach works because his harmonic patterns all play out by the same principle, with a clear probability. This is directly linked to the repetitive behavior of market participants.
That is why most experienced traders advise against using this analysis on timeframes below H1: crowd behavior shows clearly over longer periods. On small timeframes you mostly see a lot of small money, while on higher timeframes the moves of a few big players are easier to see.
How the levels are calculated
To build harmonic patterns, you need to take the Fibonacci sequence into account: when you divide any number in the standard sequence by the previous one, the result tends to 1.618. Next, let’s see where the levels used in the Gartley butterfly come from.
From 0 to 100 there is 100% of the distance, and dividing it by 1.618 gives 61.8%. Then 61.8/1.62 = 38.2%, and 38.2/1.62 = 23.6%. The 50% level is not a Fibonacci number, so it should be seen as the symmetry point of the tool.
How the pattern is drawn
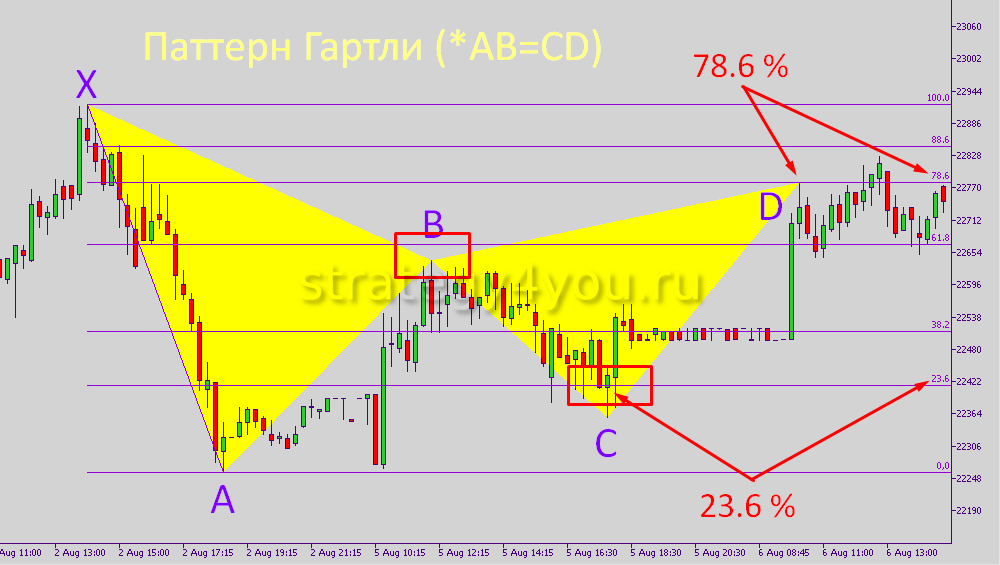
The most important requirement for all harmonic patterns is the «AB=CD» rule: the first leg must match the length of CD. To start marking the pattern, stretch the Fibonacci tool along the XA line from right to left.
And at a trend reversal, connect the extremes with the «triangle» tool, marking points X, A, B (61.8%), while point C stays at 23.6% from the start of the second wing. Based on the pattern’s requirements, the best zone for a simple entry is between the 23.6% and 38.2% levels.
Trading with the Gartley pattern
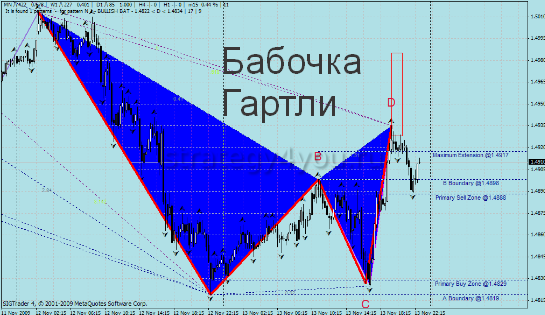 When the price is between the 23.6% and 38.2% levels, you can place the stop loss just beyond the low. The take profit works differently: point B is near 61.8%, so old-school traders may set the first target at 78.6% and the second at 88.6%.
Placing the stop loss and take profit
Take profit should be set at the level where point A formed. Where to place the take profit when trading the butterfly is subjective and depends on your goals and market conditions. Most often the aggressive target is set at point A and the more conservative one in zone B.
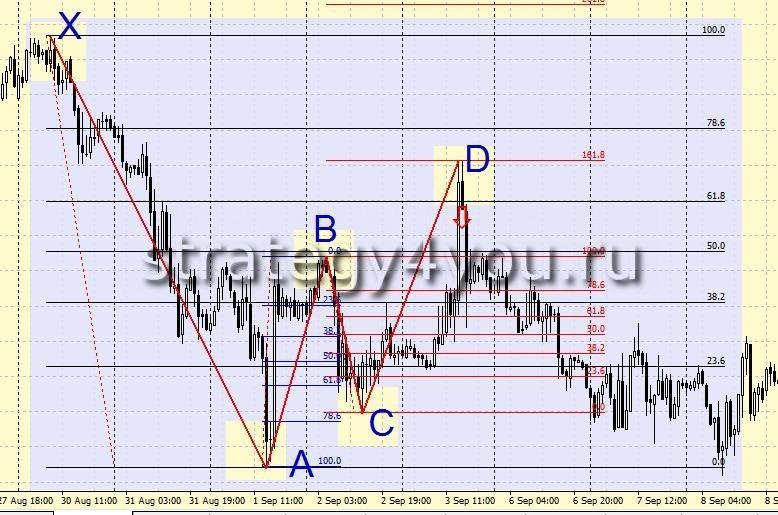
The stop loss in a pattern-based trading strategy should be placed beyond point D: above D in the bearish pattern and below D in the bullish one. Try to move it to breakeven as soon as possible. The potential risk per trade should not exceed 1.5%.
- An example of the 5-0 harmonic pattern:
Other types of Gartley patterns
To understand the signals of Gartley butterfly patterns, you need to study their other variations.
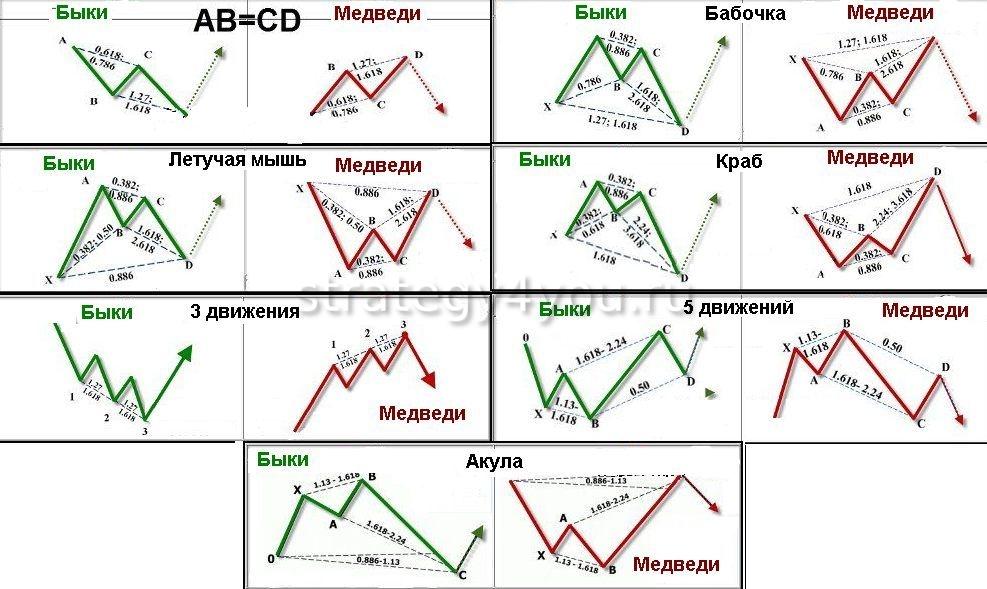
Today the following types are distinguished:- The bat. The most common variation of the butterfly, with different ratios between the wings. Its key feature is a longer CD leg in the AB=CD pattern. Here the stop loss on entry goes beyond point D with a margin.
- The crab. Has an even longer CD leg: it can be 2-3 times longer than AB. A fixed stop loss is used, and the entry is made with a pending order or at the market price.
- The shark. A reliable forex chart pattern rooted in harmonic trading. It is identified with Fibonacci levels, since traders of this school give these levels special importance.
Advantages of the patterns
The main advantage of this discretionary analysis is psychological. All its data is as precise as possible: a clear level, leg and point where the price is likely to stop. The Gartley pattern also suggests in advance where to take profit.
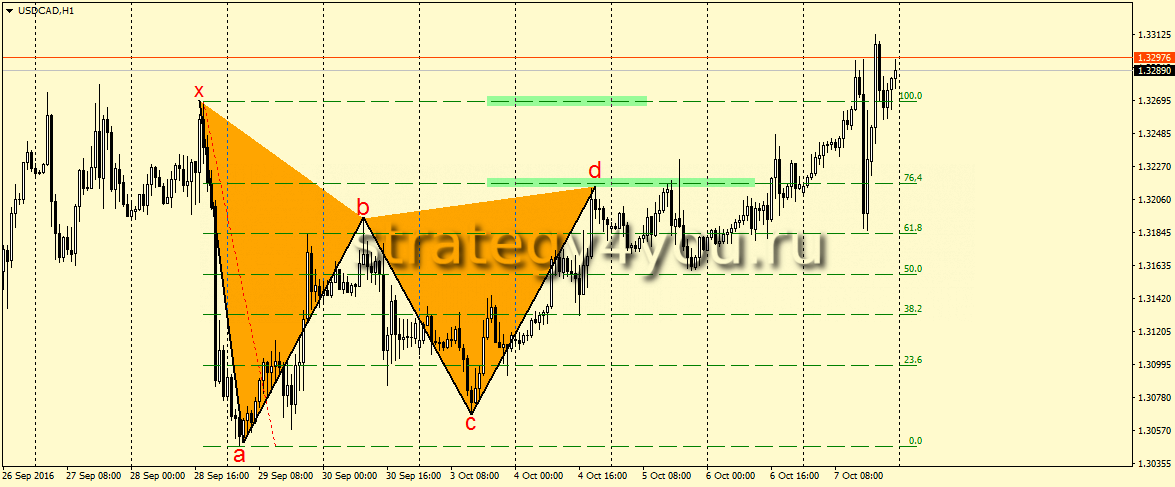
The second advantage is the reliability of the patterns (as at point D). You can always double-check by drawing a Fibonacci grid on 2 legs (XA and BC), and when the levels of both grids closely coincide, increase the entry size, setting money management aside.
Drawbacks of the patterns
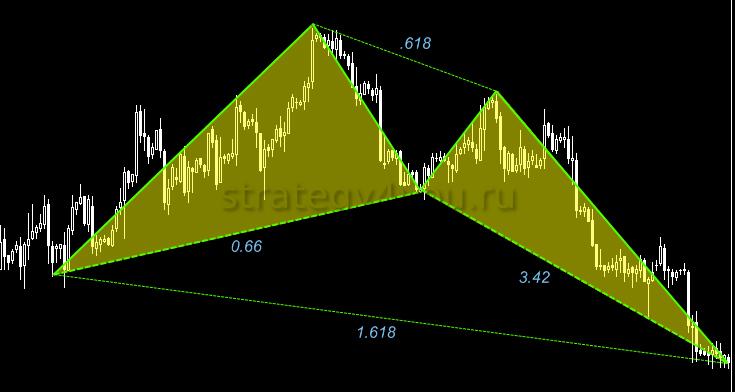 Like any type of price chart analysis, interpreting and applying Gartley harmonic patterns has a flaw — there are far too many variations. So many patterns confuse traders, which often leads to losses: against the rules of the pattern, the price may shoot up to 423.6%, and few can handle the emotional strain of missed profit.
Harmonic pattern indicators
You don’t have to find the patterns yourself — you can leave it to an indicator. There are always suitable options freely available (in MT5, in the «Market» tab): paid and free, based on Elliott wave algorithms or on the ZigZag principle, as well as classic tools such as the ZUP indicator, which keeps being improved.
Both manual trading and using indicators have their pros and cons. So whether to use this type of analysis or another tool is up to you.
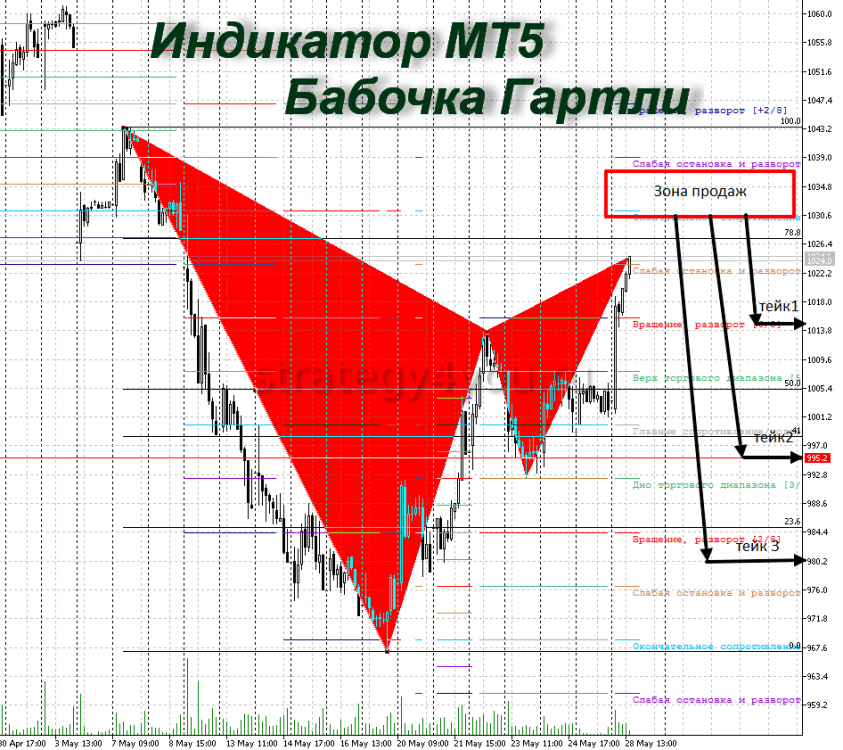 Finding harmonic patterns by eye is hard for beginners, since the main patterns (butterfly, crab, bat and shark) are built on 5 key points: after the XA impulse wave, the price makes a correction.
In the harmonic approach, the Gartley pattern should form a symmetrical shape with its top at 1.62 of the left shoulder and the right one at 0.62 of the head, so that you can easily spot when the pattern completes and when to enter the market.
These ratios between the legs determine whether the wave will be contracting or expanding — this is what makes each pattern unique. Once you understand how one example is built, the others become much easier to identify.