Contents 12
- What Is an Order Block?
- Three Signs of a Real Order Block
- Order Block vs FVG vs Breaker Block
- Order Block Gold (XAUUSD) Strategy: The Rules
- Backtest: 108 Gold Trades over 2.5 Years
- Trade Examples, Step by Step
- Gallery: All 108 Trades
- How to Calculate Lot Size for Gold
- Common Order Block Trading Mistakes
- FAQ: Order Blocks
- Video: Order Block Gold Strategy Step by Step
- Conclusion
The Order Block is the core model of Smart Money Concepts (SMC) and ICT: “the zone where a big player built a position”. It is drawn on almost every chart on YouTube, yet almost nobody checks whether it actually makes money.
In this article we cover what an order block is, how to find one and how it differs from an FVG — and then we test a gold (XAUUSD) strategy on 108 real trades over 2.5 years. We compared every order block with only the “proper” ones — and the difference turned out to be huge.
What Is an Order Block?
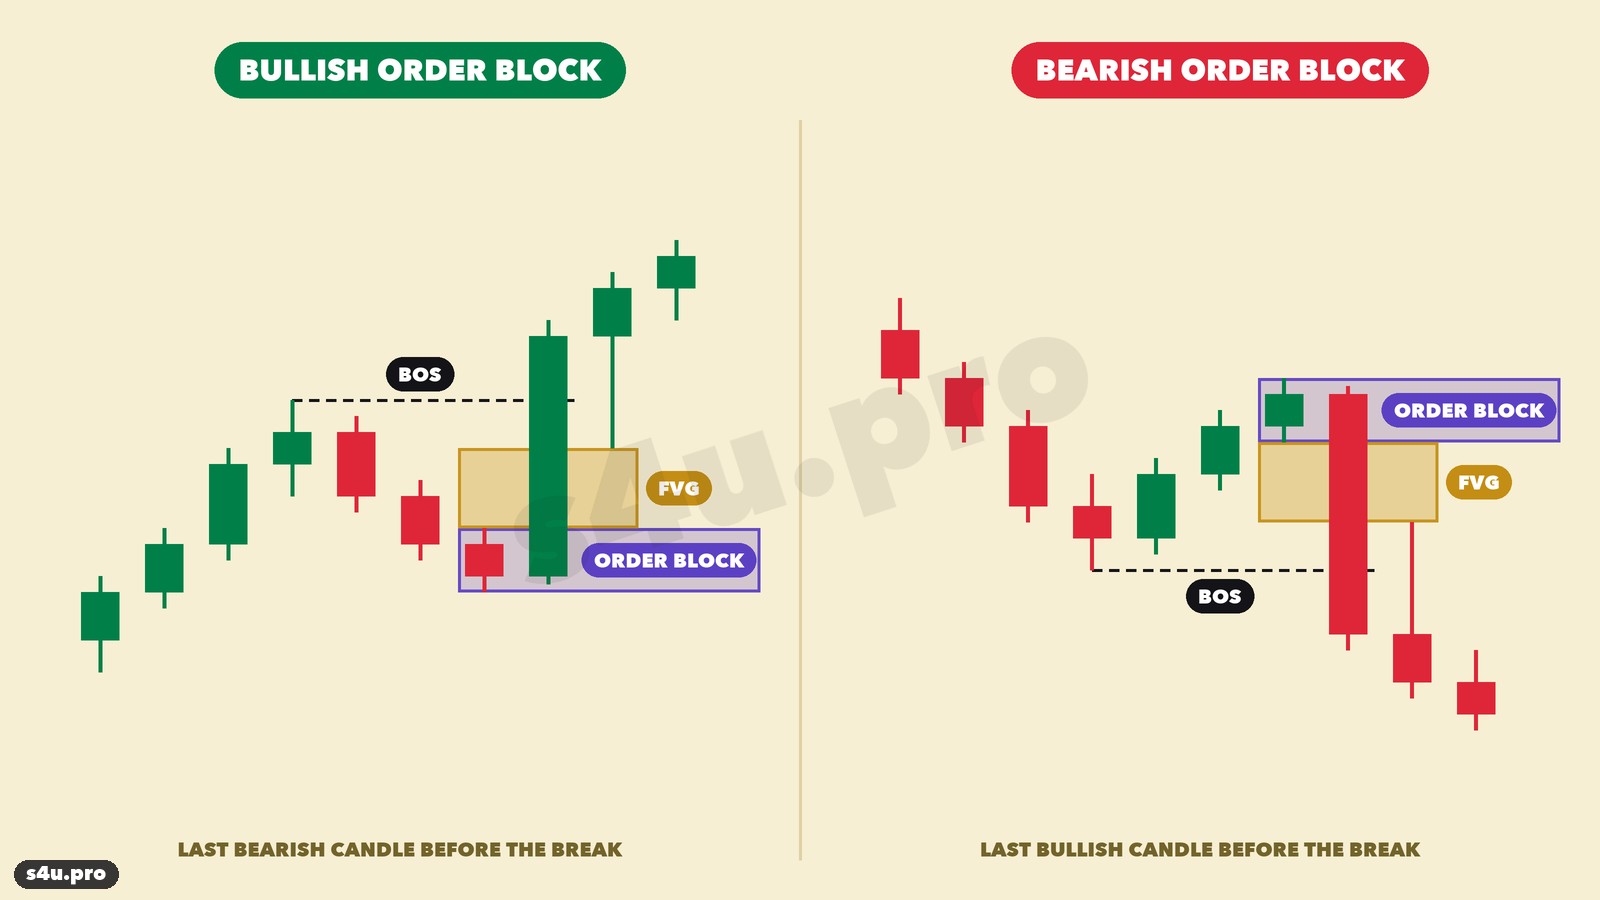
An Order Block (OB) is the last candle against the move before a strong impulse that breaks market structure.
- Bullish order block — the last bearish (red) candle before a sharp rally that breaks the previous high.
- Bearish order block — the last bullish (green) candle before a sharp drop that breaks the previous low.
The Smart Money logic: a large player (a bank or a fund) was building a position on that candle. They could not fill the whole size at once, so when price comes back to that candle they add to the position — and price moves away in the direction of the impulse again.
Three Signs of a Real Order Block
If every red candle before a rally counted as an order block, a chart would have hundreds of them. A real order block has to pass three checks:
- Break of structure (BOS). The impulse after the order block closes above the last swing high (below the swing low for sells). No break — no order block.
- A strong breakout candle. The body of the candle that breaks structure is at least 1 ATR (the average candle range over 20 bars). A weak break made of small candles does not count.
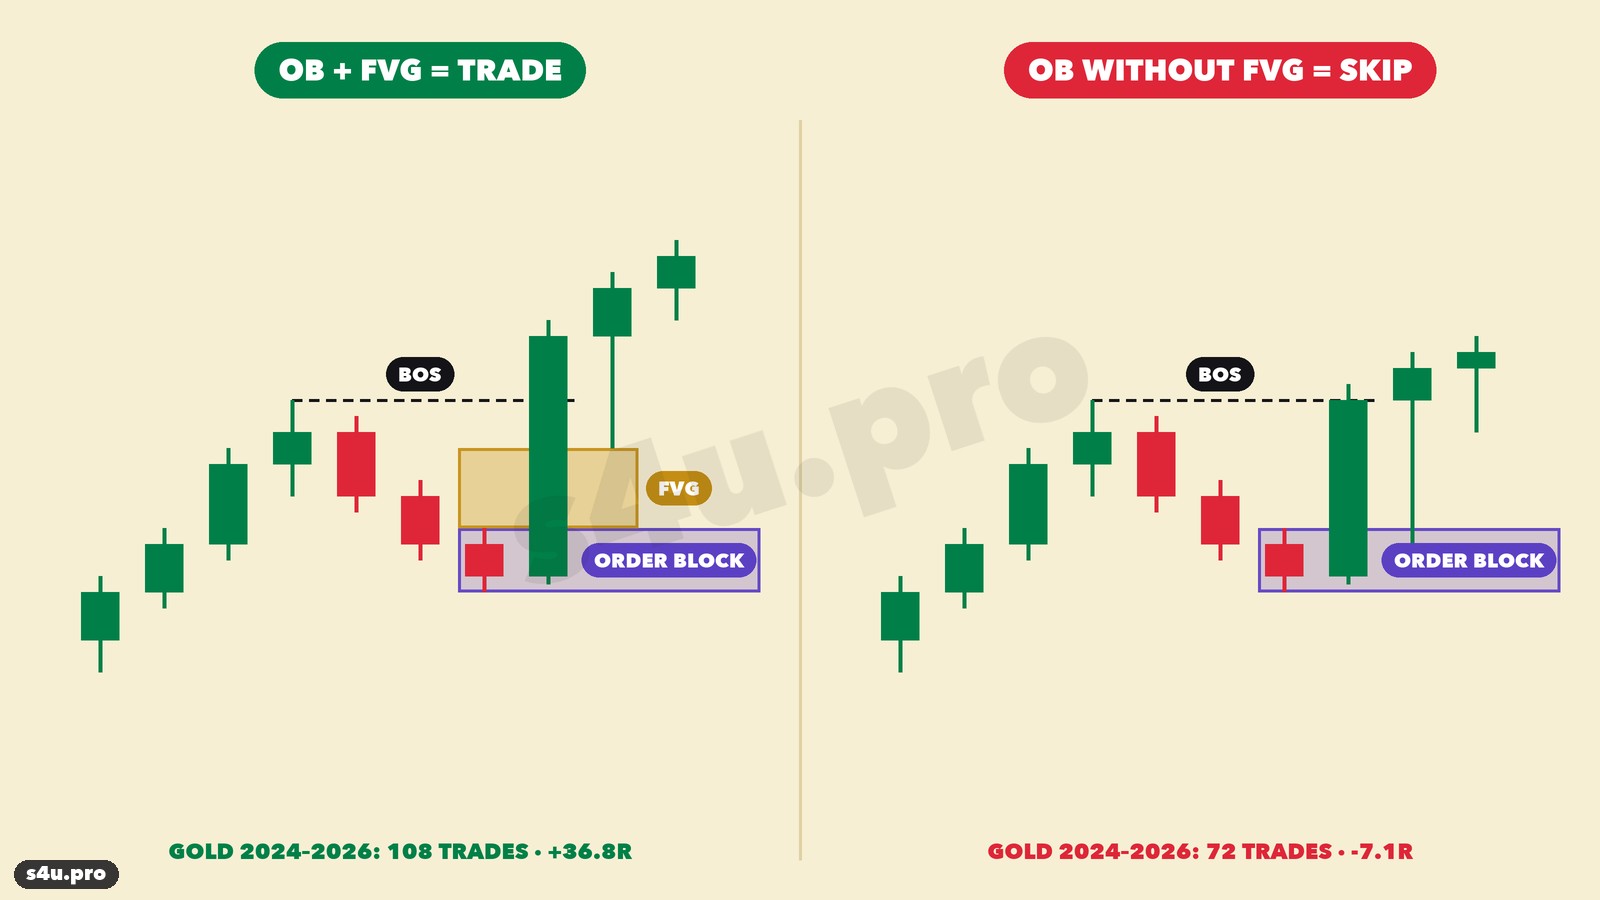
- An FVG in the impulse. The impulse from the order block left a Fair Value Gap (imbalance) — a gap between candle wicks. This is the key filter: below you will see that order blocks without an FVG lose money on gold.
Order Block vs FVG vs Breaker Block
| Model | What it is | Entry |
|---|---|---|
| Order Block | The last opposite candle before an impulse that broke structure | Return to the edge of the order block |
| FVG | A gap between the wicks of candle 1 and candle 3 inside an impulse | Return into the zone, usually at 50% |
| Breaker Block | An order block that price broke straight through — it “flips” | Retest of the broken block from the other side |
An order block and an FVG almost always sit next to each other: the order block is the candle before the impulse, the FVG is the gap inside the impulse. That is why the best setups have both.
Order Block Gold (XAUUSD) Strategy: The Rules
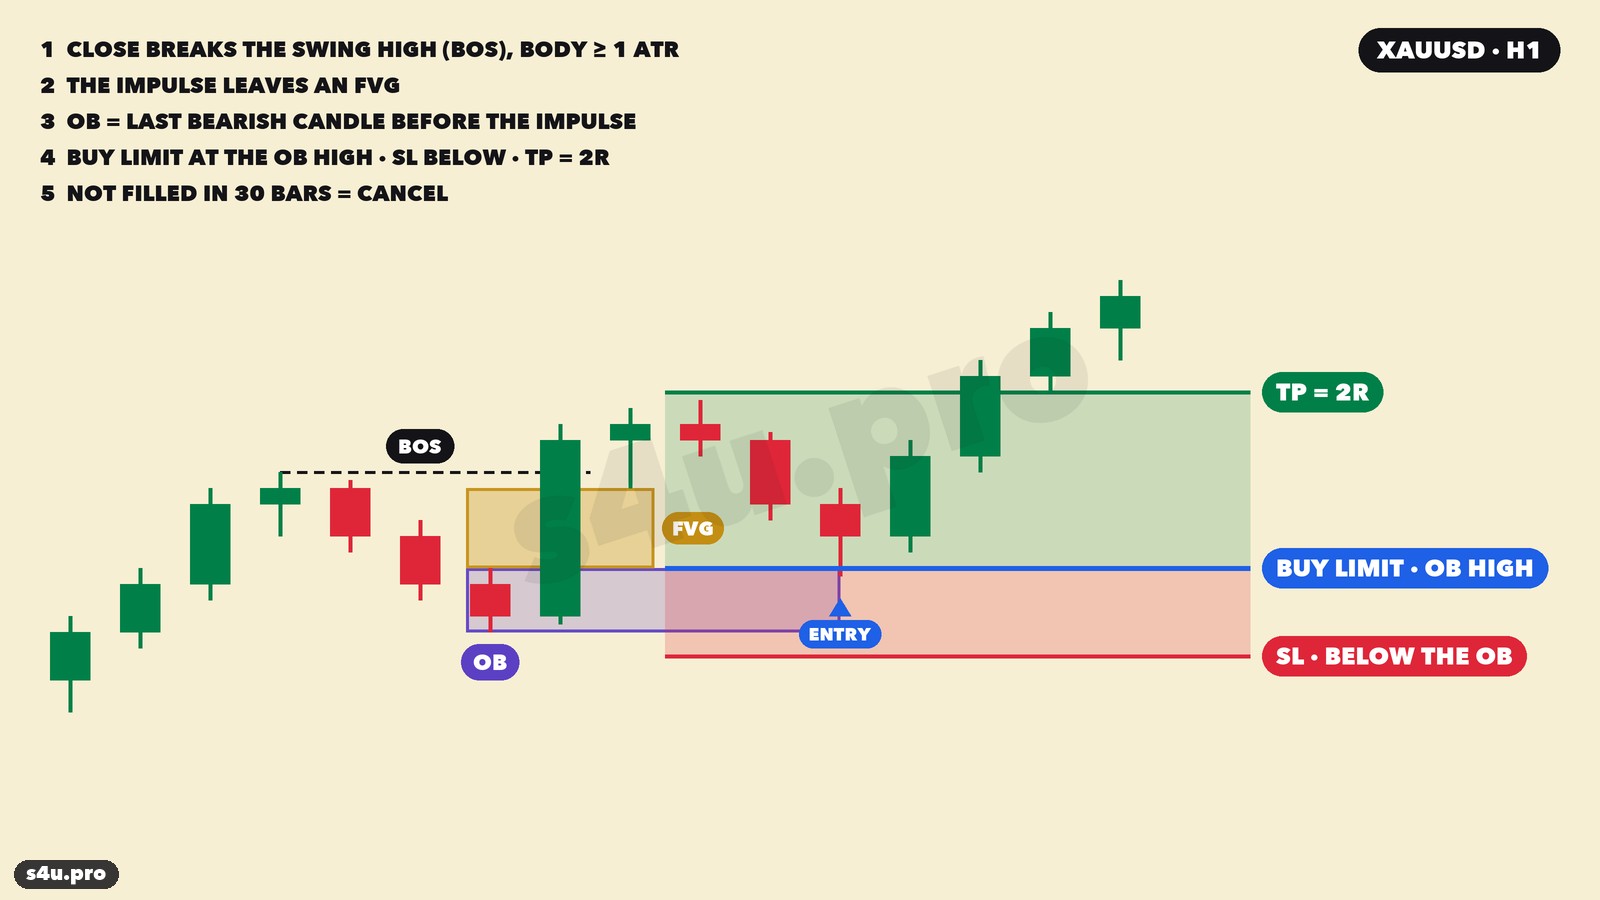
We used a simple mechanical version — no indicators, no “gut feeling” — so it can be backtested and repeated.
| Parameter | Rule |
|---|---|
| Instrument / TF | XAUUSD (gold), H1 |
| Break of structure | A candle closes above a fractal swing high (below a swing low for sells) within 25 bars; the breakout candle body is ≥ 1 ATR |
| Order block | The last bearish candle at the low of the pullback before the impulse (for sells — the last bullish candle at the high) |
| Filter | The impulse from the order block to the break left an FVG |
| Entry | Buy Limit at the order block high (Sell Limit at its low), placed right after the breakout candle |
| Stop loss | 3 pips ($0.30) below the low of the order block or the impulse — whichever is lower |
| Take profit | 2R — twice the stop |
| Order cancel | If the limit is not filled within 30 candles (hours) — delete it. If price reaches the TP level before the entry — delete it too |
| Time exit | If neither SL nor TP is hit within 60 hours — close at market |
| One trade | While a trade is open, new signals are skipped |
| Risk | 0.5–1% of the account per trade |
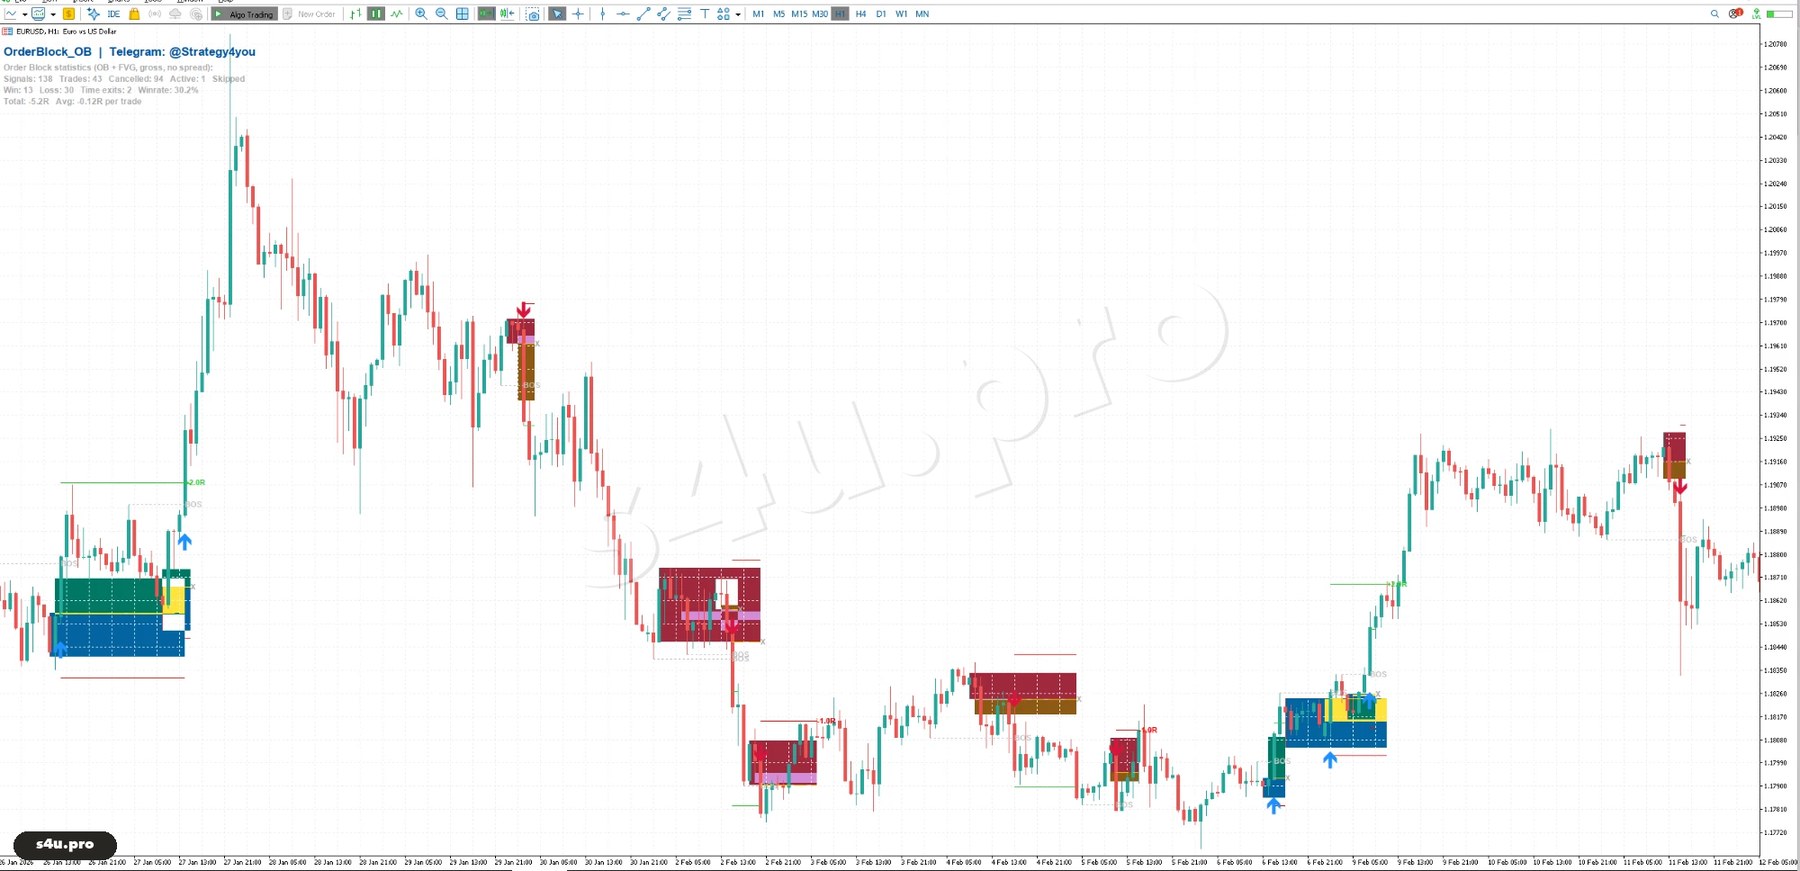
Finding these order blocks by hand takes time — our indicator does it for you, using the rules from this article.
Backtest: 108 Gold Trades over 2.5 Years
We ran the rules on hourly gold candles from June 2024 to October 2026. The test conditions are strict:
- a $0.30 spread (3 pips) is deducted from every trade;
- if both the stop and the target are hit in the same candle, we count it as a stop;
- if several order blocks trigger on the same candle, we take one trade and skip the rest;
- no hindsight tweaking: the same rules for every trade.
We show the result in two units: R (the main one) and pips (for comparison). A quick word on R.
What Is R — in Plain Words
R is your risk on one trade. 1R = the amount you lose if the stop loss is hit. A result in R answers the question: “how many of my risks did I make or lose”.- Stop hit — minus 1R. Target hit — plus 2R, because the target is twice as far as the stop.
- Example in money. A $10,000 account, 1% risk per trade = $100. So 1R = $100: a stop is −$100, a target is +$200.
- Turning R into money: result in R × your risk in $. The strategy’s +36.8R at $100 risk = +$3,680; at $50 risk = +$1,840; at $20 risk = +$736.
Why is R the main unit, not pips? Over 2.5 years gold became far more volatile: the average stop in this strategy was 130 pips in 2024, 231 in 2025 and 399 in 2026. Measured in pips, one 2026 trade “weighs” three times more than a 2024 trade, even though you risk the same money on both. R puts every trade on equal terms. 1 pip on gold = a $0.10 price move = $0.10 on 0.01 lot.
Key Numbers
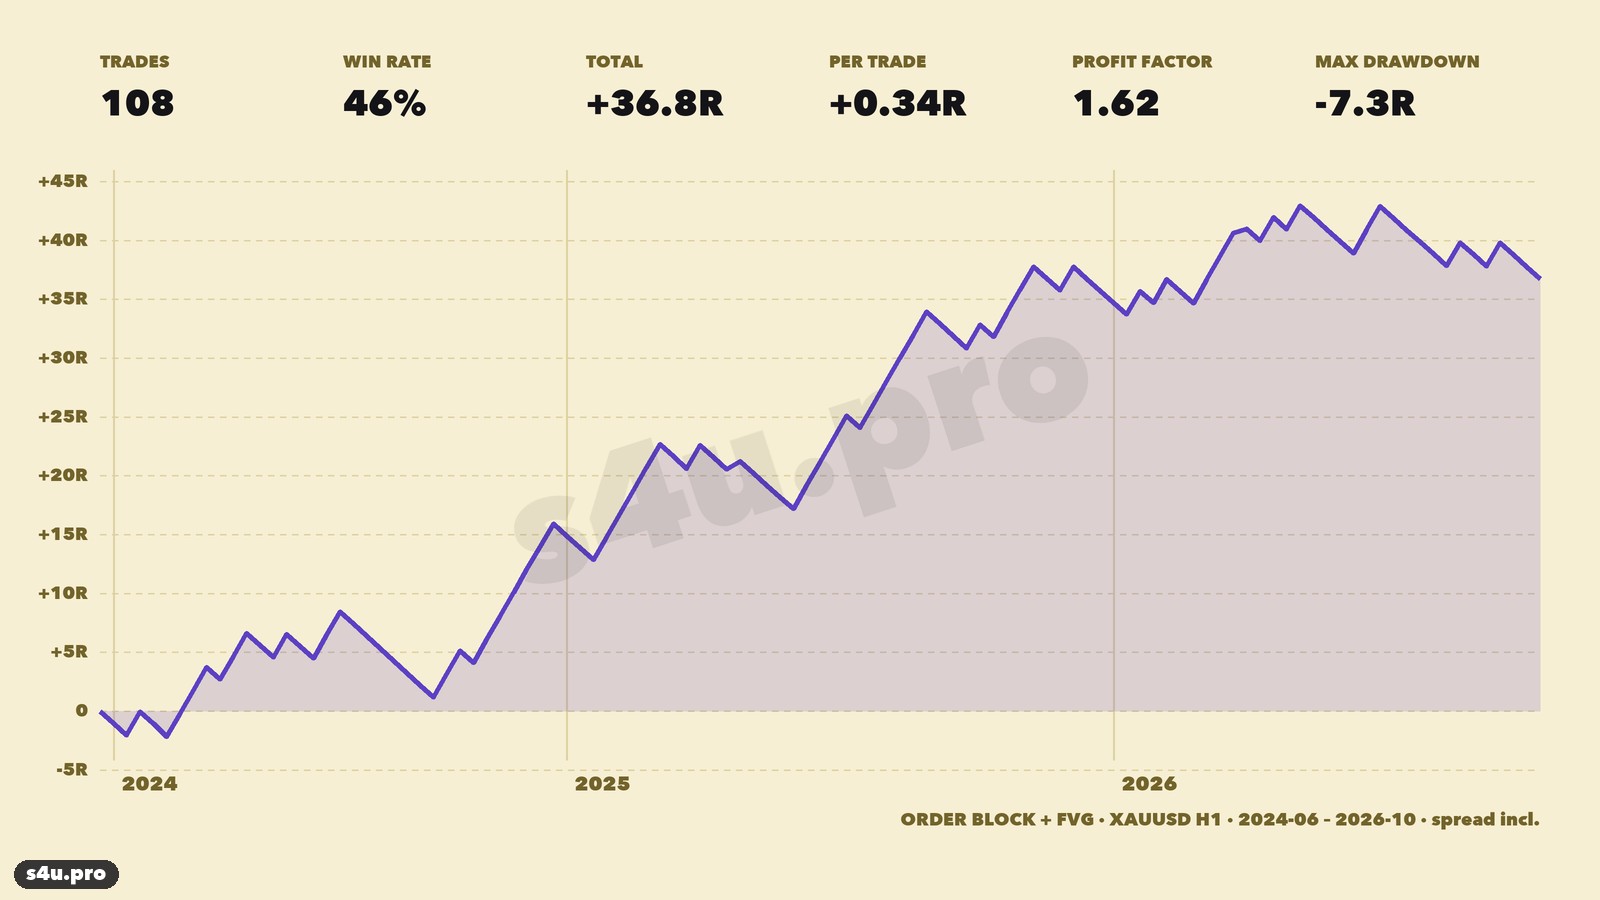
| Metric | In R | In pips |
|---|---|---|
| Trades | 108 (about 4 per month) | |
| Win rate | 46.3% (48 TP, 58 SL, 2 time exits) | |
| Total | +36.8R | +11,188 |
| Average per trade | +0.34R | +104 |
| Average winner | +1.9R | +496 |
| Average loser | −1.0R | −235 |
| Profit factor | 1.62 | 1.82 |
| Max drawdown | −7.3R | −1,576 |
| Worst losing streak | 7 losses in a row | |
| Profitable months | 15 of 29 | 16 of 29 |
| Time in trade | about 11 hours (median) | |
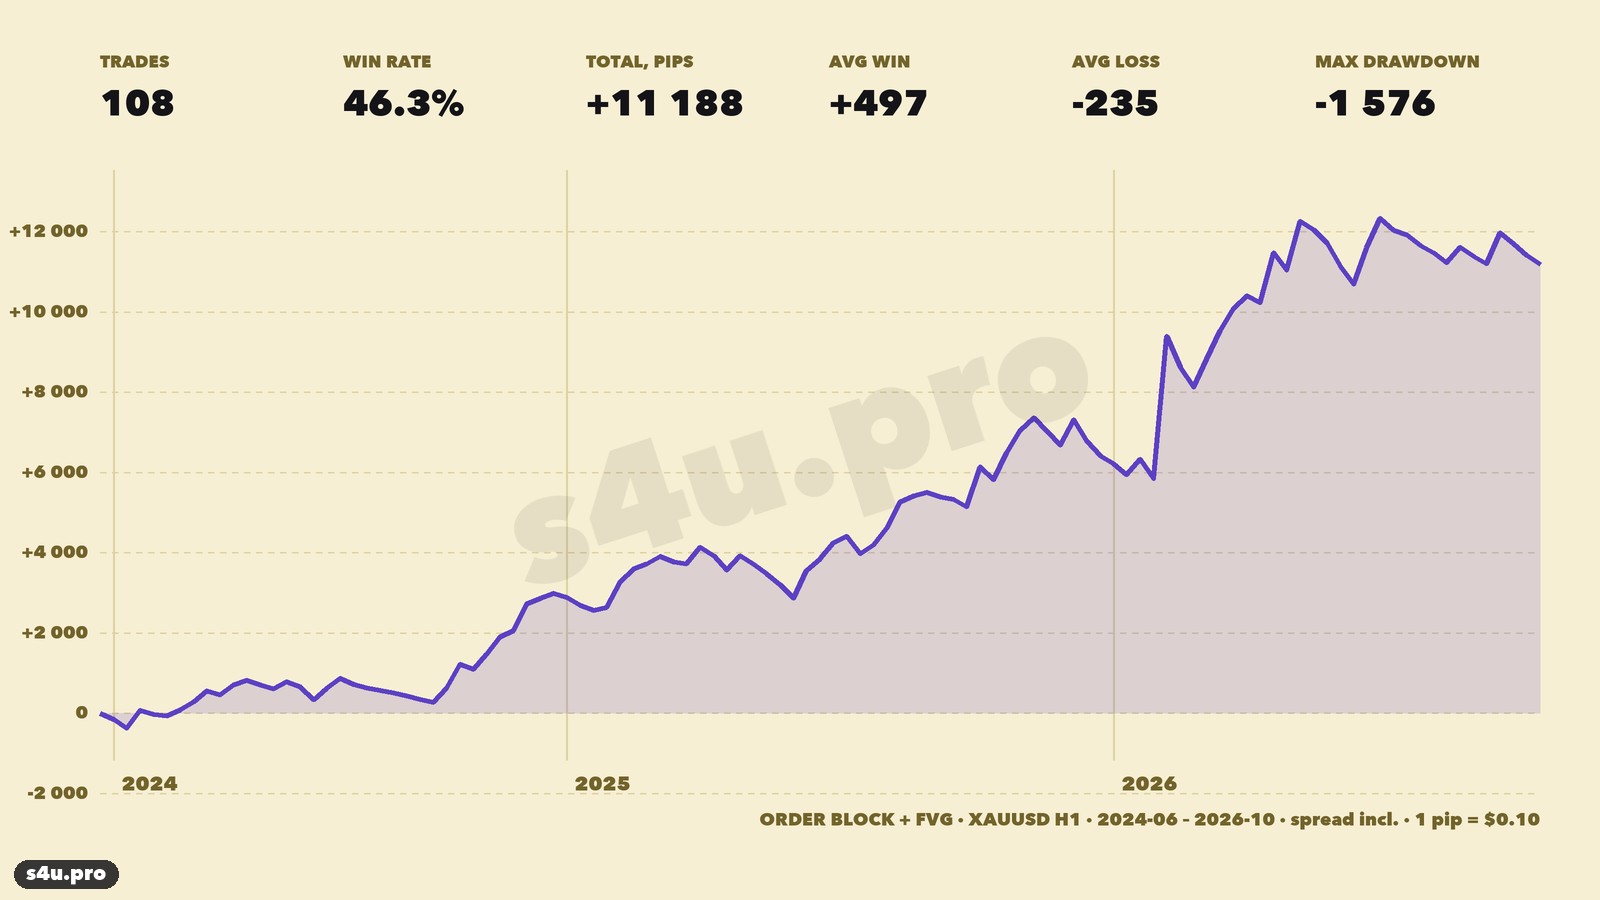
Trading a fixed 0.01 lot, +11,188 pips = +$1,119 over 2.5 years. Risking 1% of $10,000 (lot sized to the stop), +36.8R = +$3,680.
Which Order Blocks Make Money
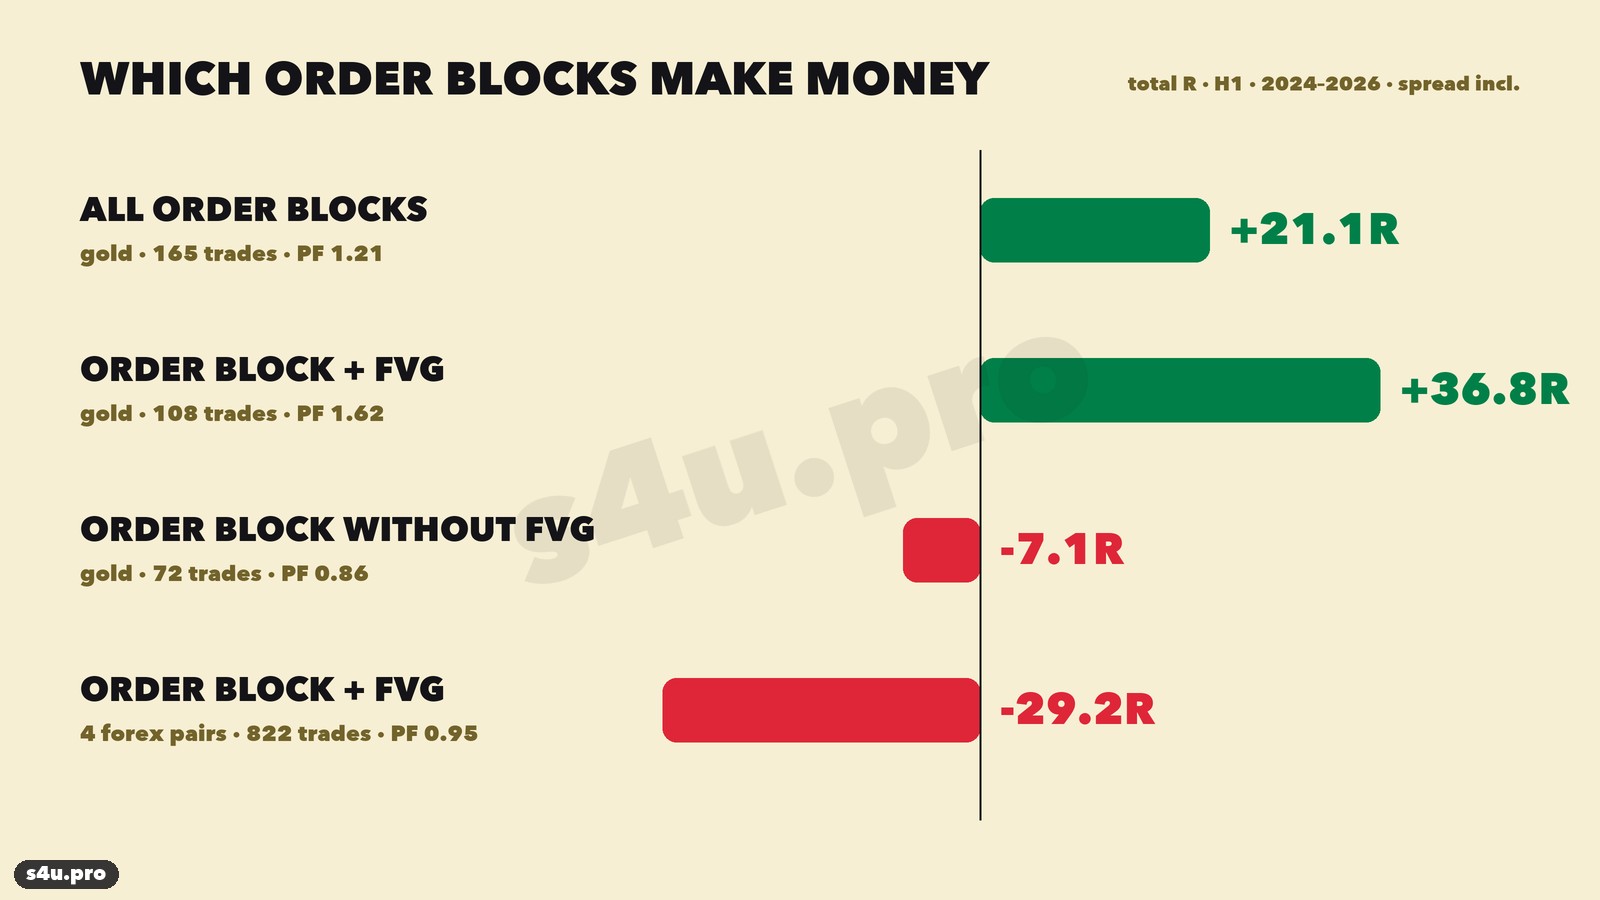
This is the main finding of the test. With the same rules, we checked every order block, only those with an FVG and only those without one:
| Variant | Trades | Win rate | R | Profit factor |
|---|---|---|---|---|
| All order blocks, gold | 165 | 39.4% | +21.1R | 1.21 |
| Order block + FVG, gold | 108 | 46.3% | +36.8R | 1.62 |
| Order block without FVG, gold | 72 | 31.9% | −7.1R | 0.86 |
| Order block + FVG, 4 forex pairs | 822 | 35.3% | −29.2R | 0.95 |
An order block without an imbalance is just a candle before a move, not “the footprint of a big player”. The FVG is what shows that price left the zone fast, with one-sided orders. On forex pairs (EURUSD, GBPUSD, AUDUSD, USDJPY) the same strategy loses money, so it is for gold only.
As a check, we also opened the same number of random trades 1,000 times with the same risk and a 2R target. On average random entries made −2.5R, and +36.8R or more came up by chance in only 0.4% of runs. In other words, the result does not look like luck.
Results by Year
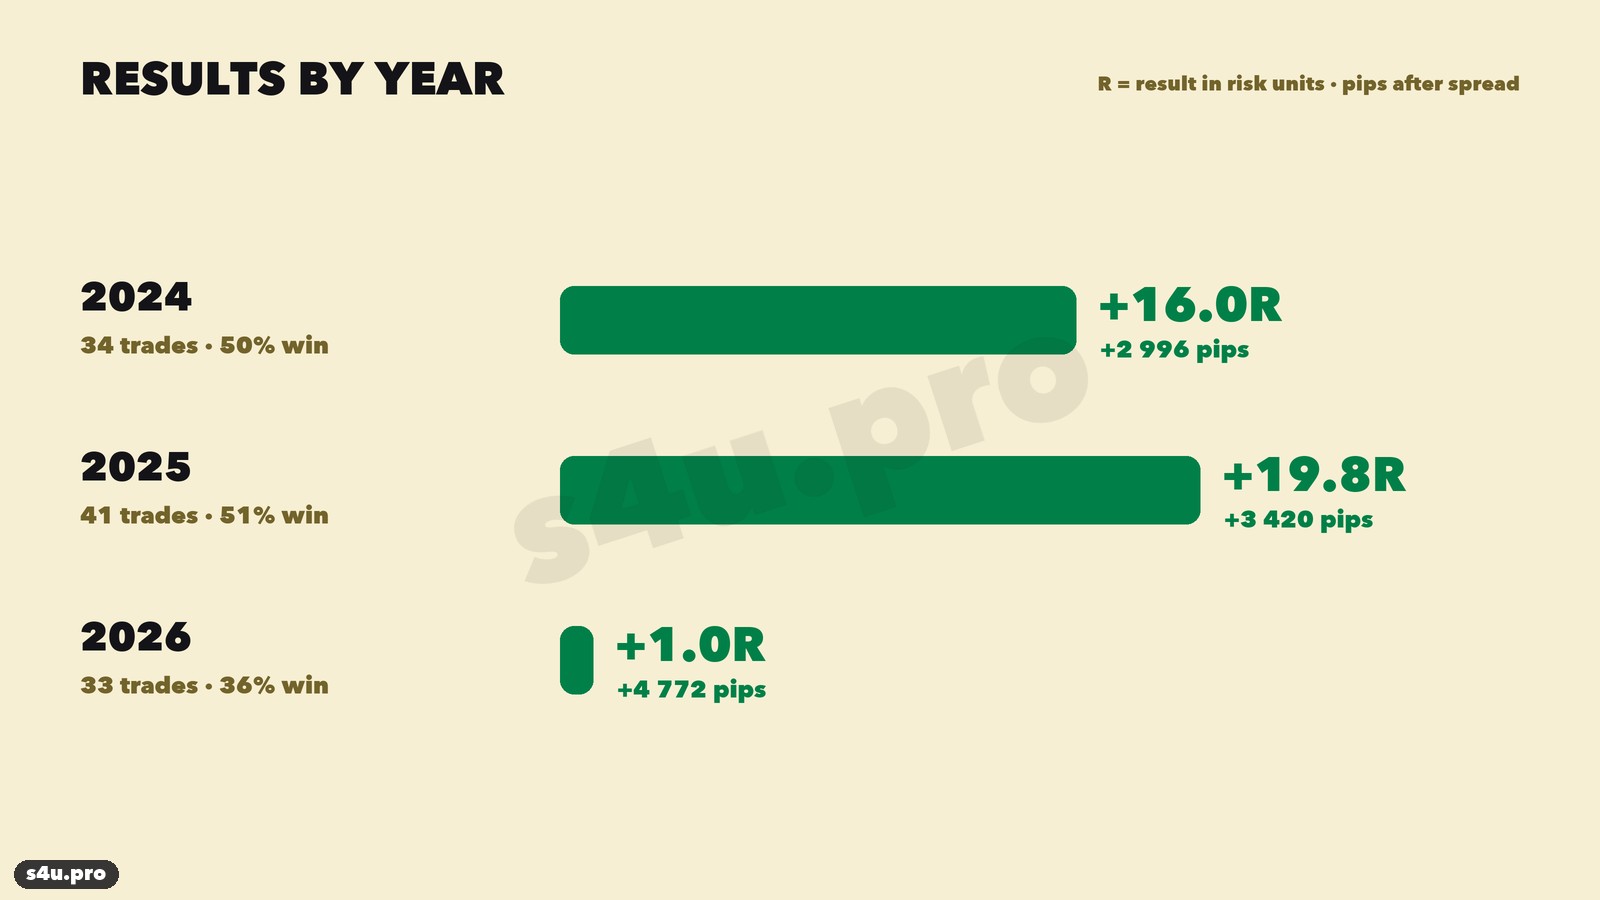
2024: +16.0R, 2025: +19.8R. 2026 is around break-even (+1.0R): the best quarter of the year was January–March (+5.2R), and since April the strategy has been in a small drawdown. In pips 2026 looks better (+4,772) because stops became three times longer.
Buys vs Sells
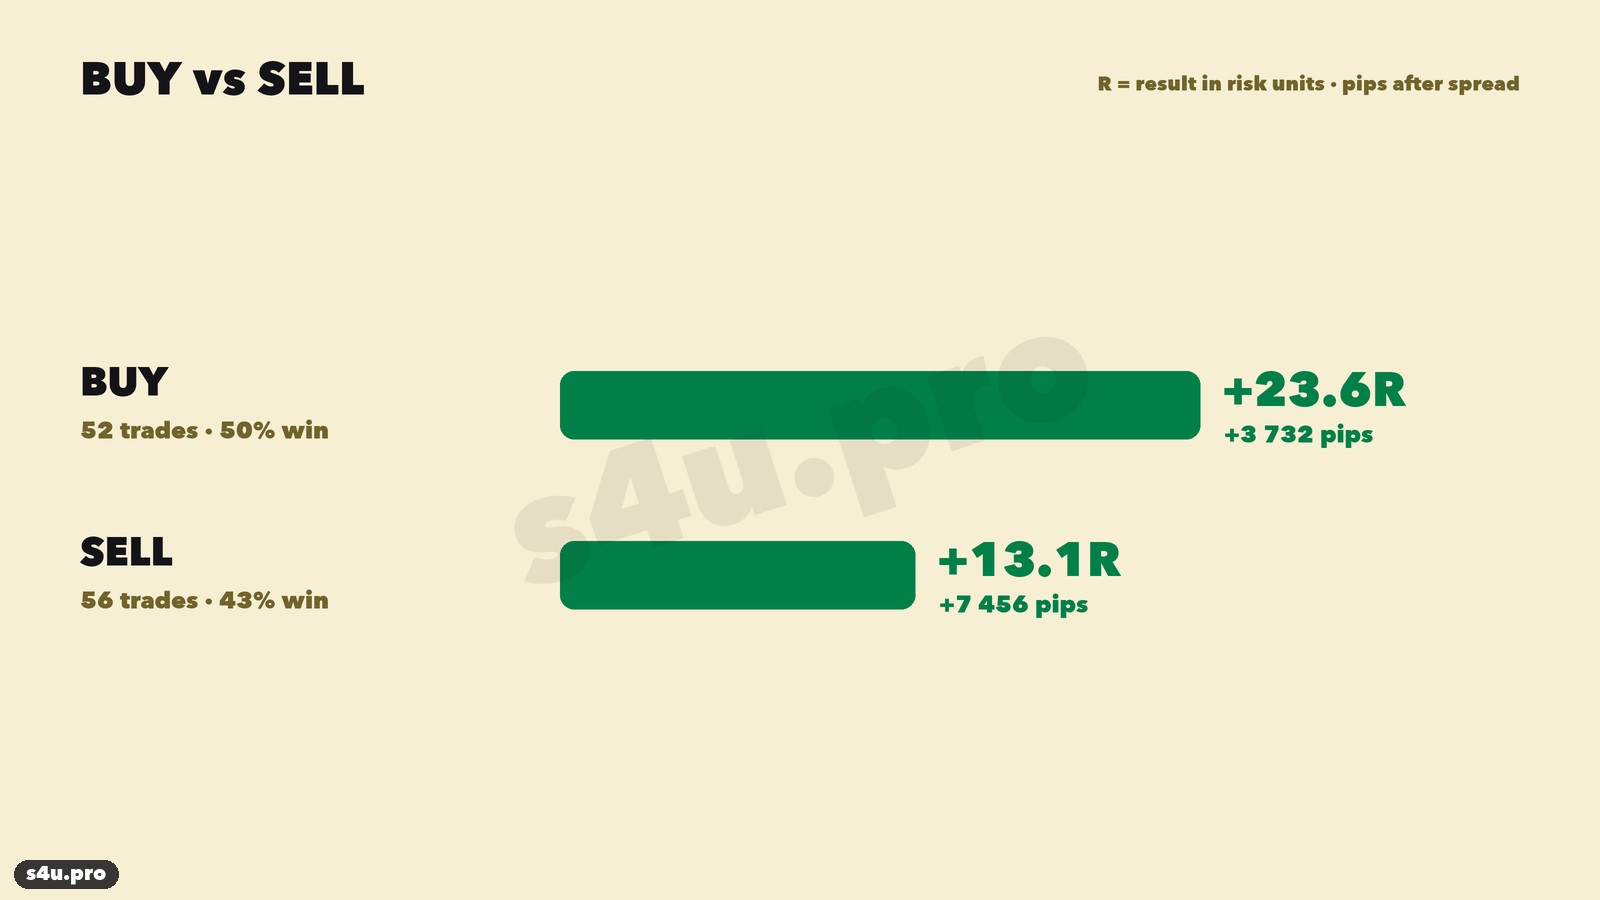
Both sides are profitable: buys +23.6R (50% winners), sells +13.1R (43%). Gold rallied strongly in 2024–2026, so with-the-trend buys worked better. In pips it is the other way round (+3,732 vs +7,456): the biggest winning sells came in volatile 2026.
By Trading Session
| Group | Trades | Win rate | R | Pips |
|---|---|---|---|---|
| 2024 (from June) | 34 | 50% | +16.0R | +2,996 |
| 2025 | 41 | 51% | +19.8R | +3,420 |
| 2026 (to October) | 33 | 36% | +1.0R | +4,772 |
| Buys | 52 | 50% | +23.6R | +3,732 |
| Sells | 56 | 43% | +13.1R | +7,456 |
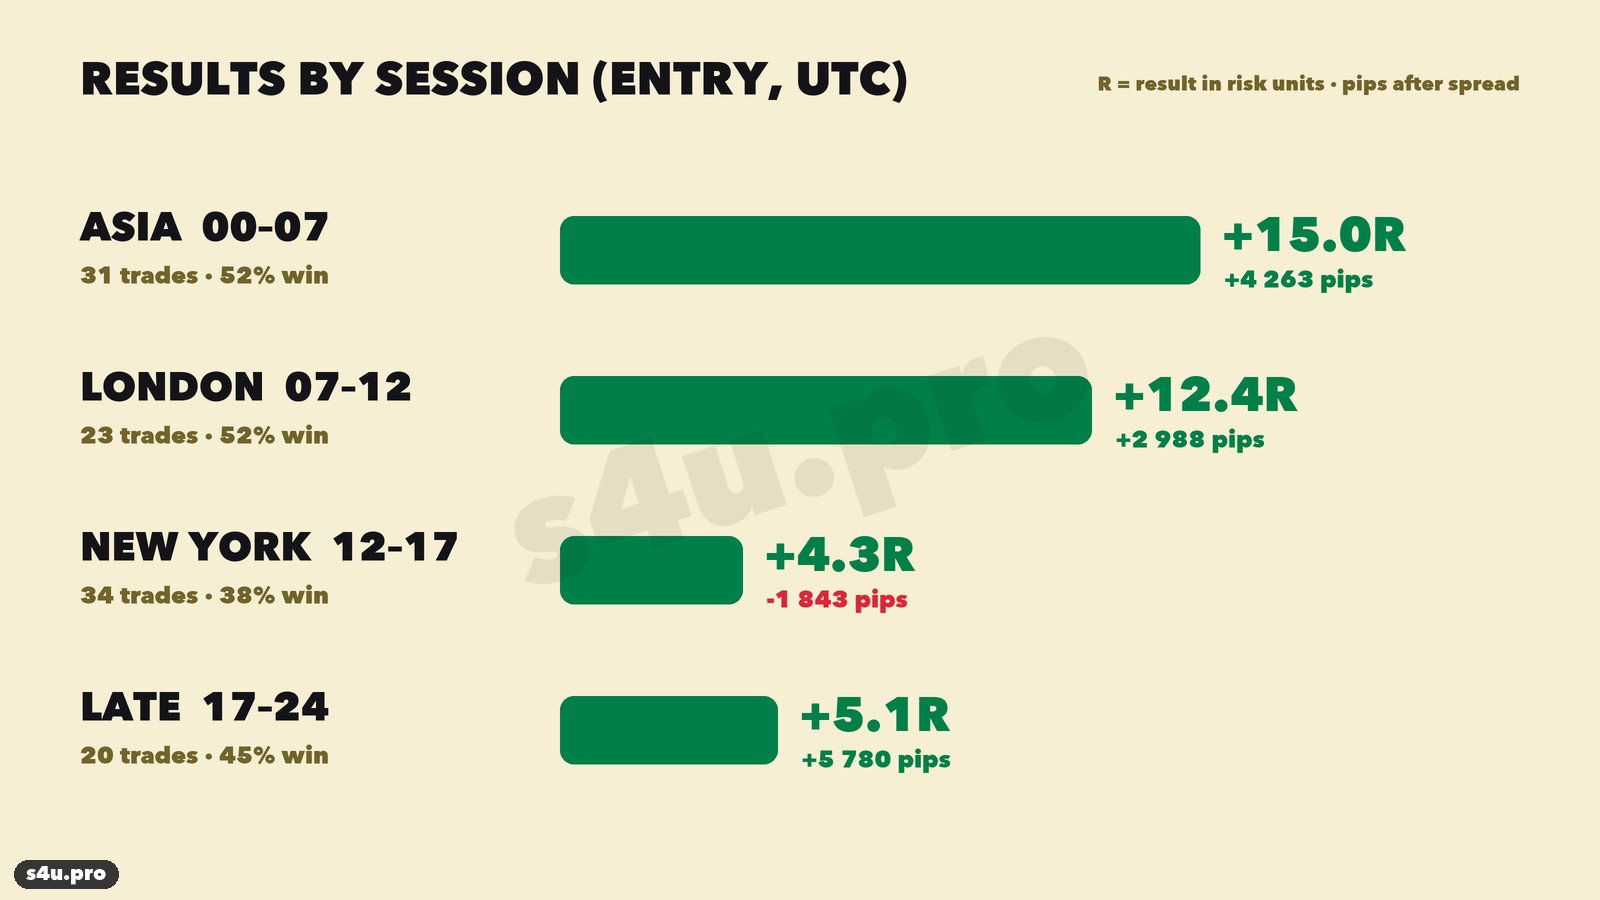
| Asia (00–07 UTC) | 31 | 52% | +15.0R | +4,263 |
| London (07–12 UTC) | 23 | 52% | +12.4R | +2,988 |
| New York (12–17 UTC) | 34 | 38% | +4.3R | −1,843 |
| Late (17–24 UTC) | 20 | 45% | +5.1R | +5,780 |
Every session is profitable in R. Asia and London are the best: more than half of the trades win. New York, with its news releases, is the weakest (+4.3R, and even negative in pips), but we did not remove those trades from the statistics — that would be curve fitting.
An Honest Look at the Drawdown
The max drawdown over the whole period is −7.3R, the worst streak is 7 losses in a row. Equity peaked on April 20, 2026 (+43.0R), and the strategy has given back 6.2R since then. The reason is the same as with FVG: gold became much more volatile, the average stop grew from 130 to 399 pips, and moves became choppy.
If you risk 1% per trade, be ready for a 7–10% drawdown — a normal part of any strategy’s life.
Trade Examples, Step by Step
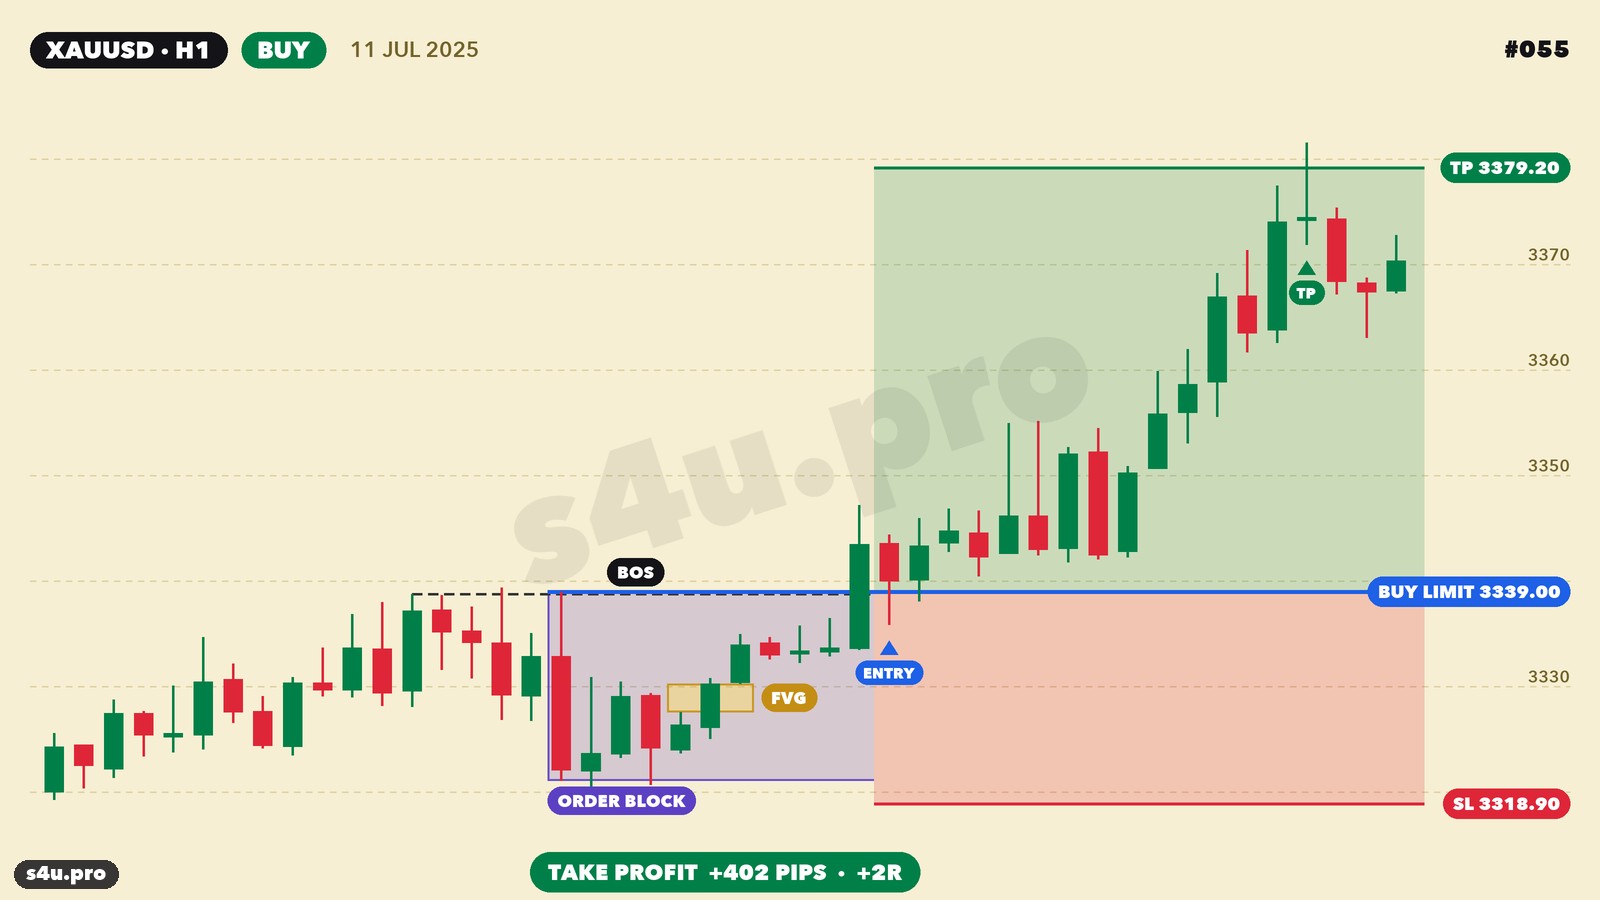
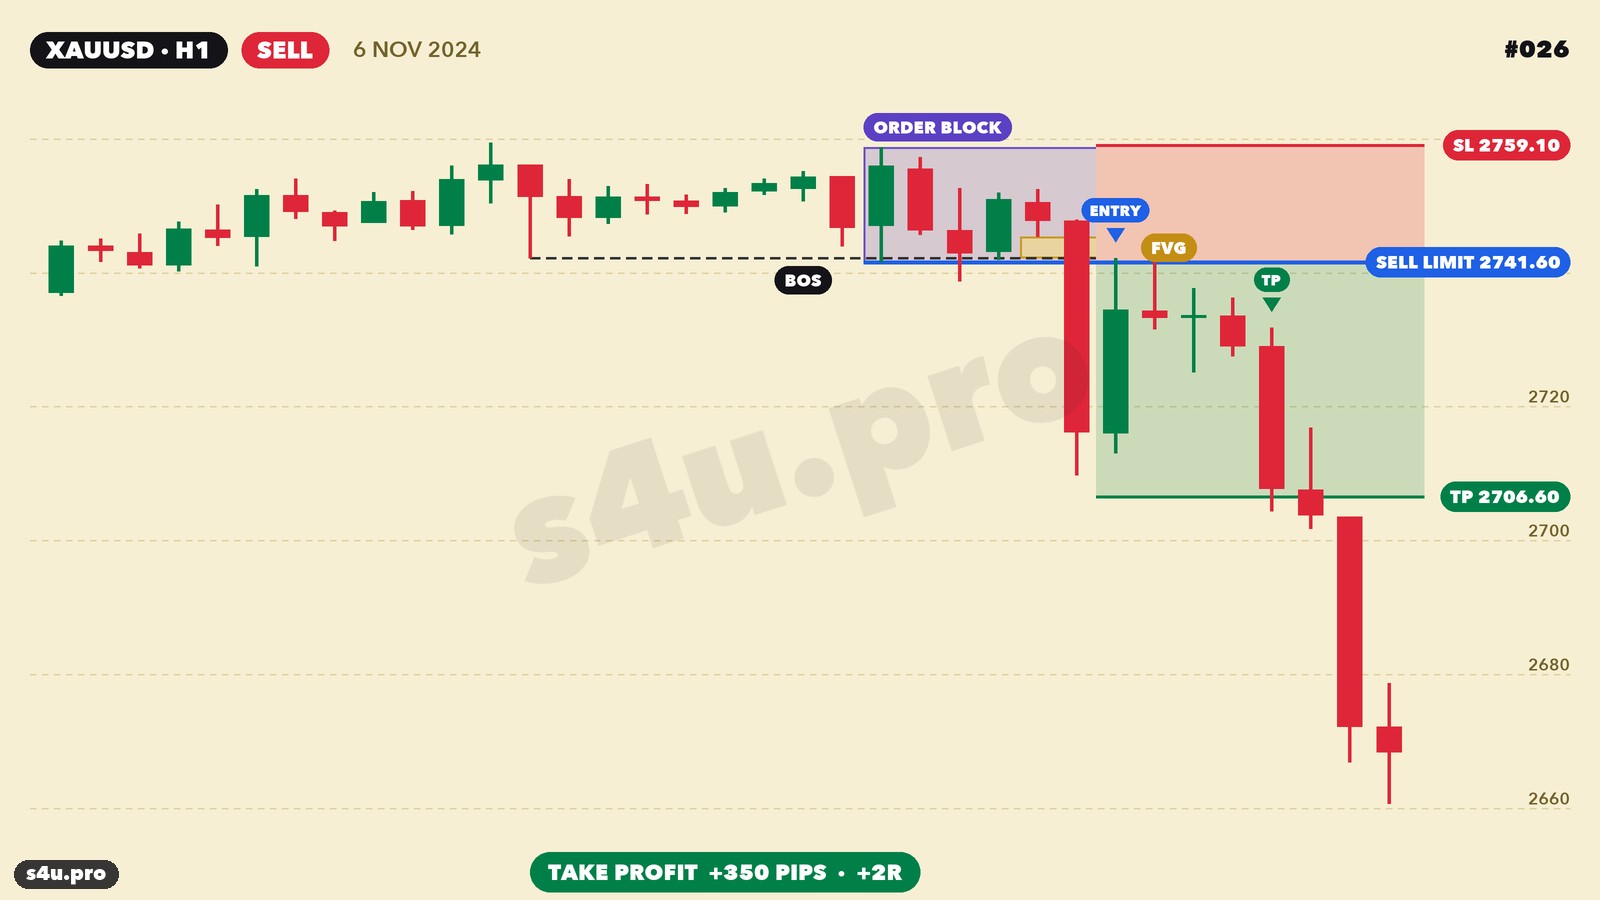
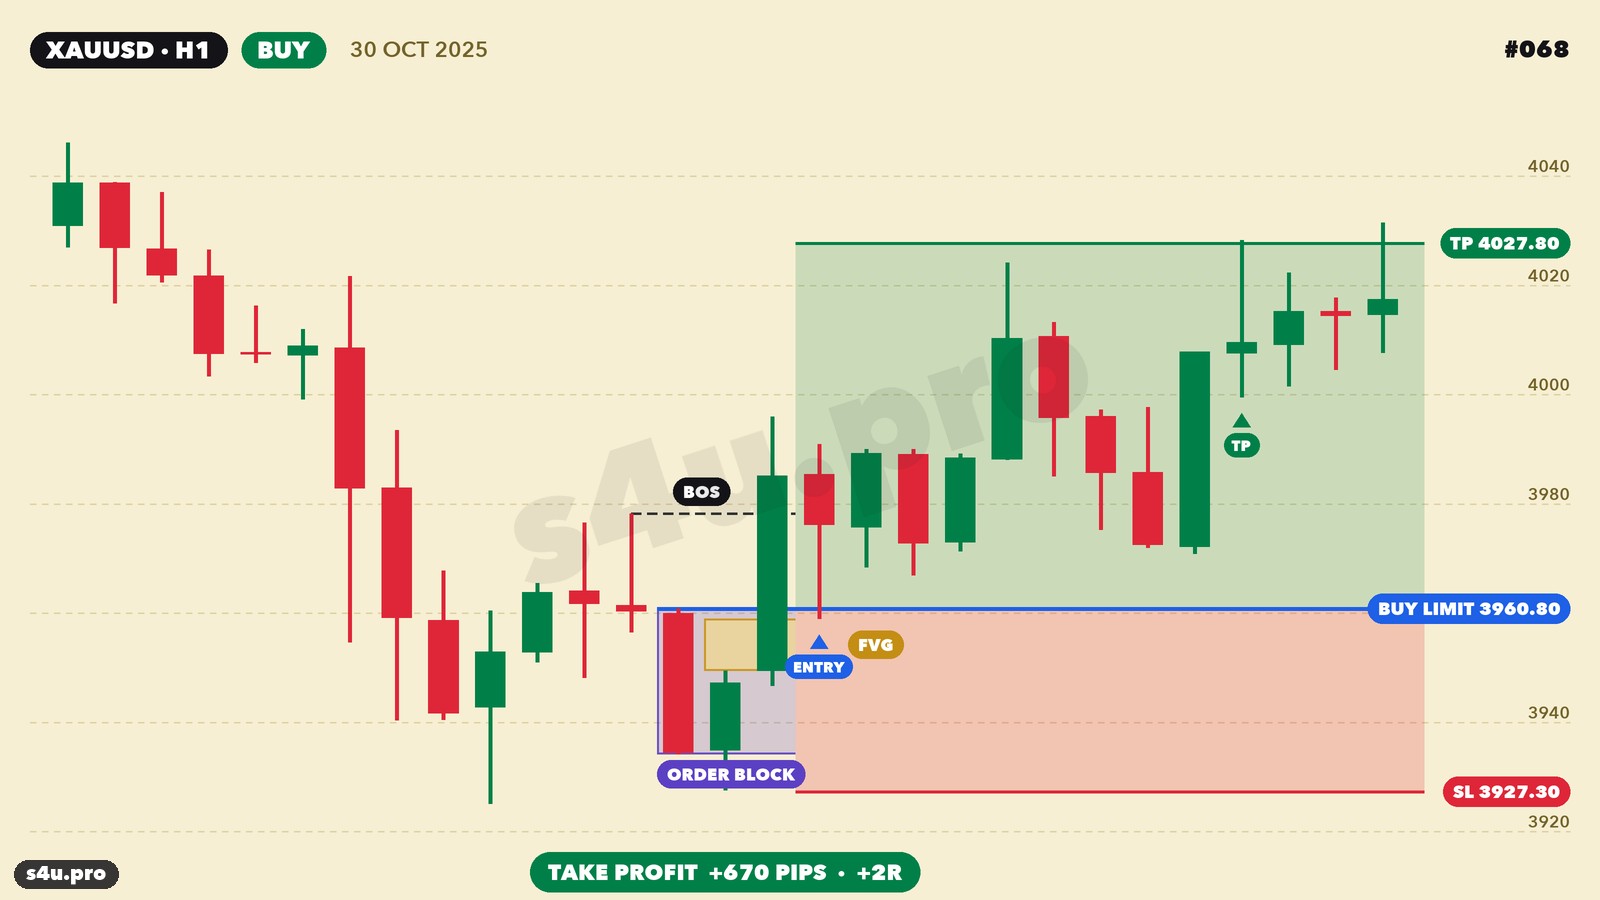
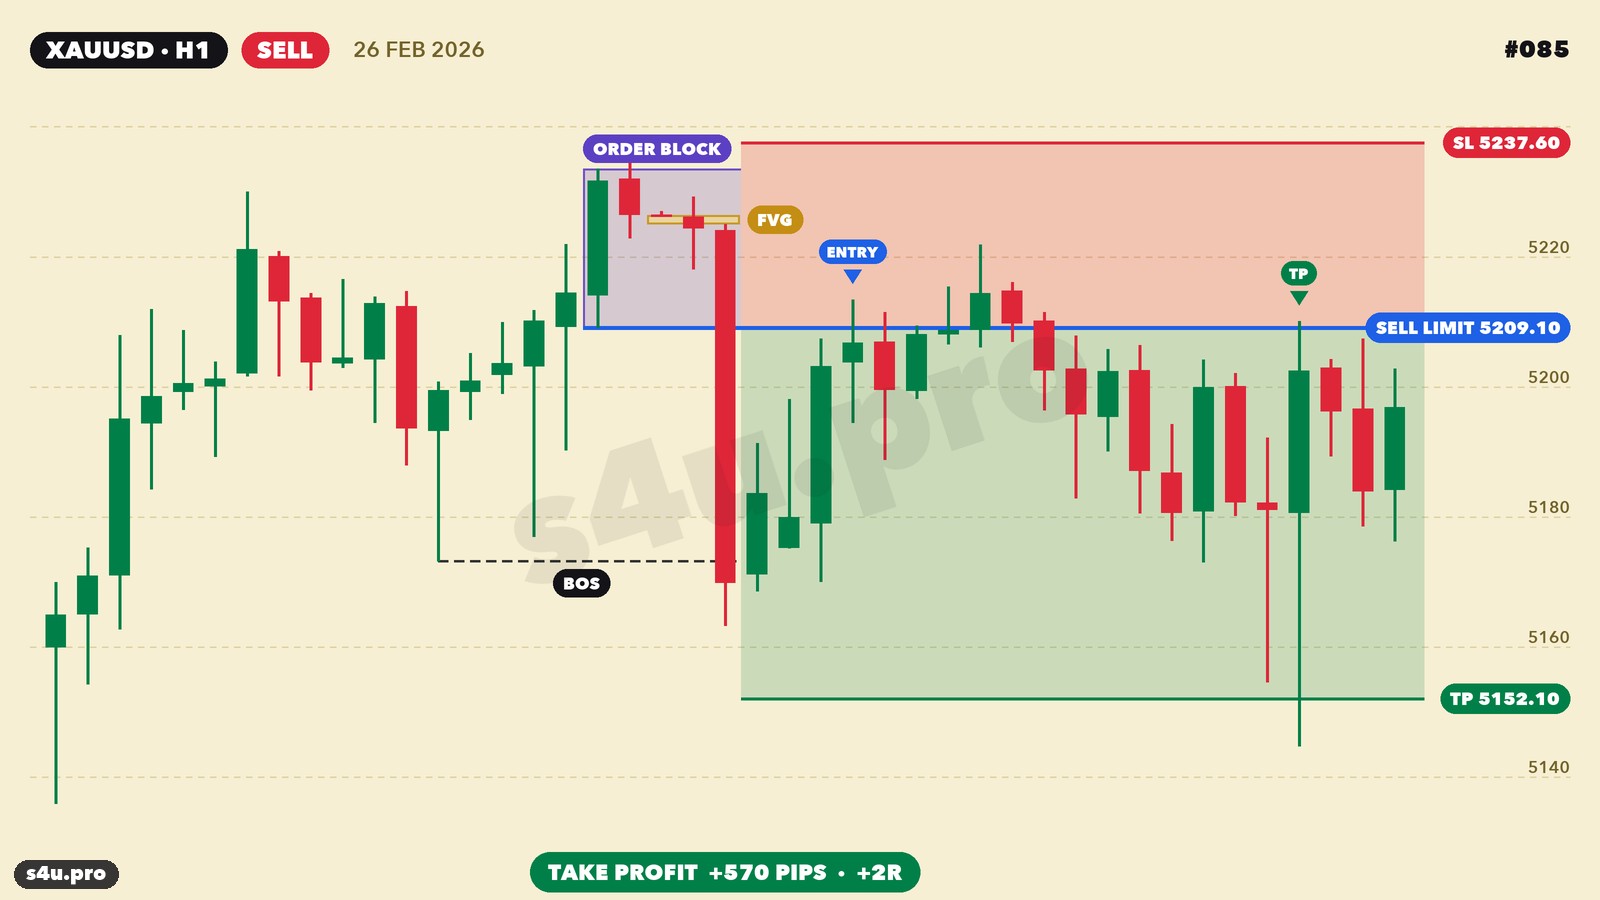
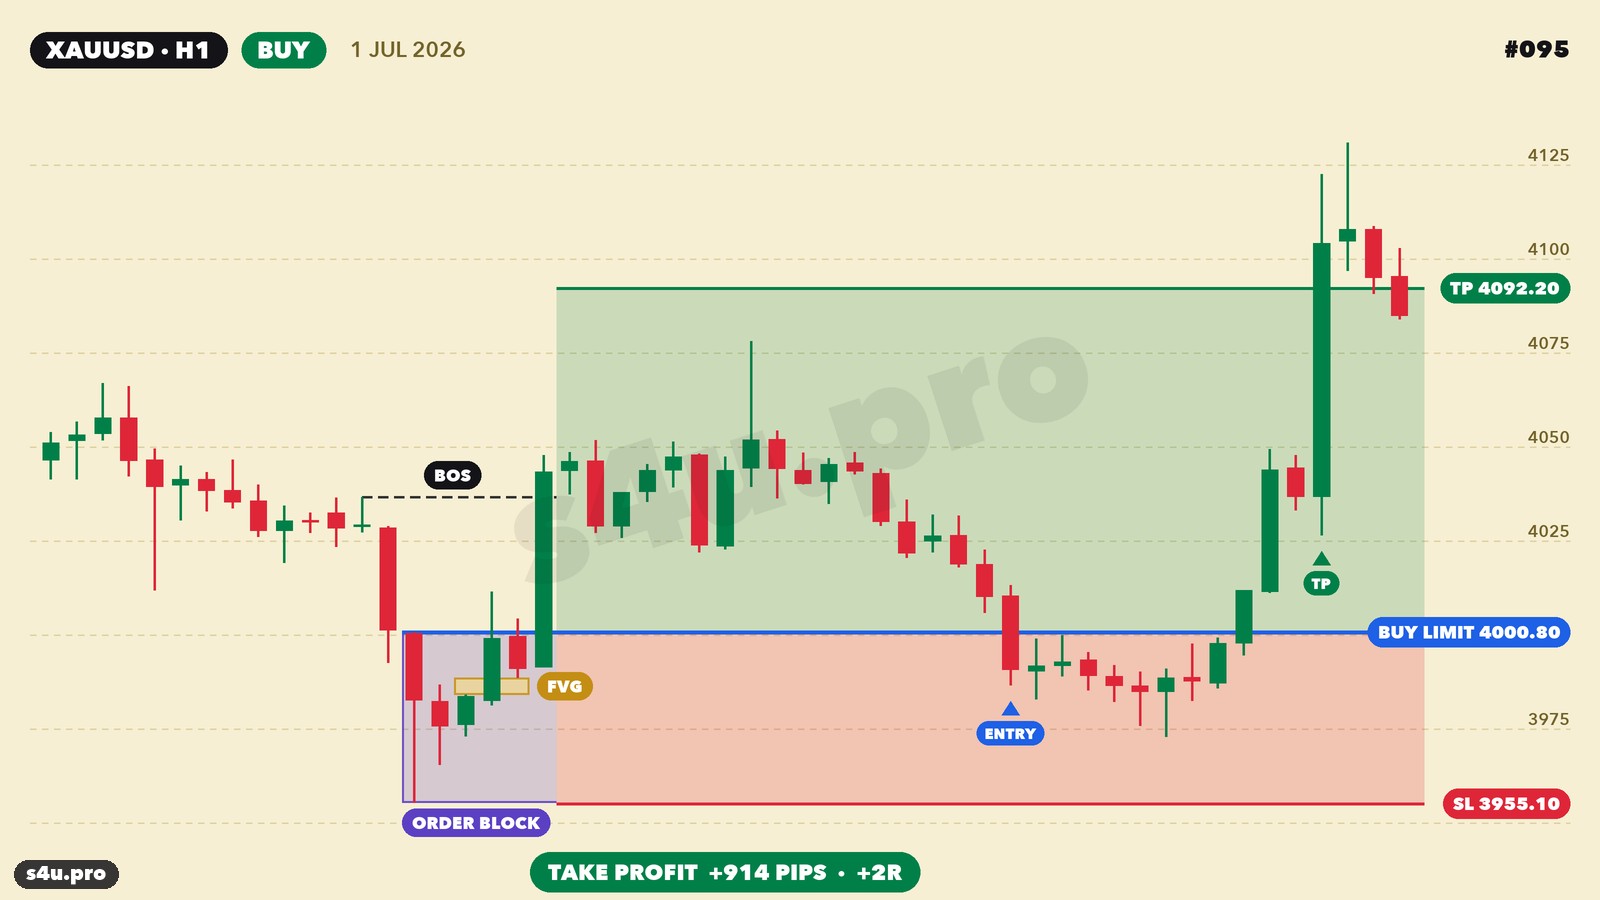
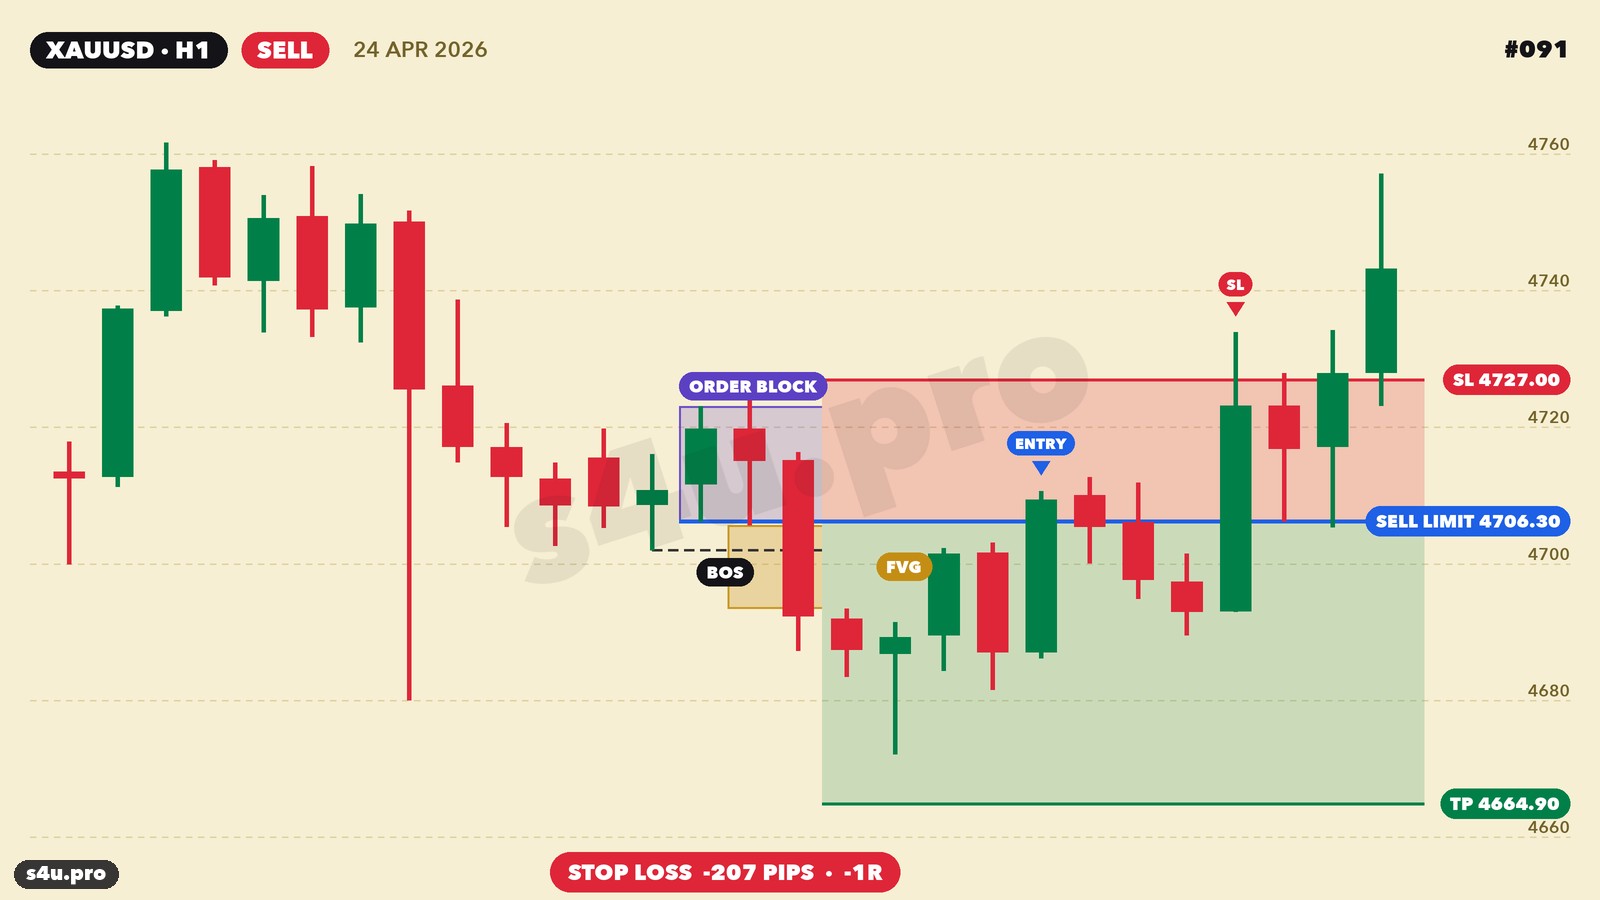
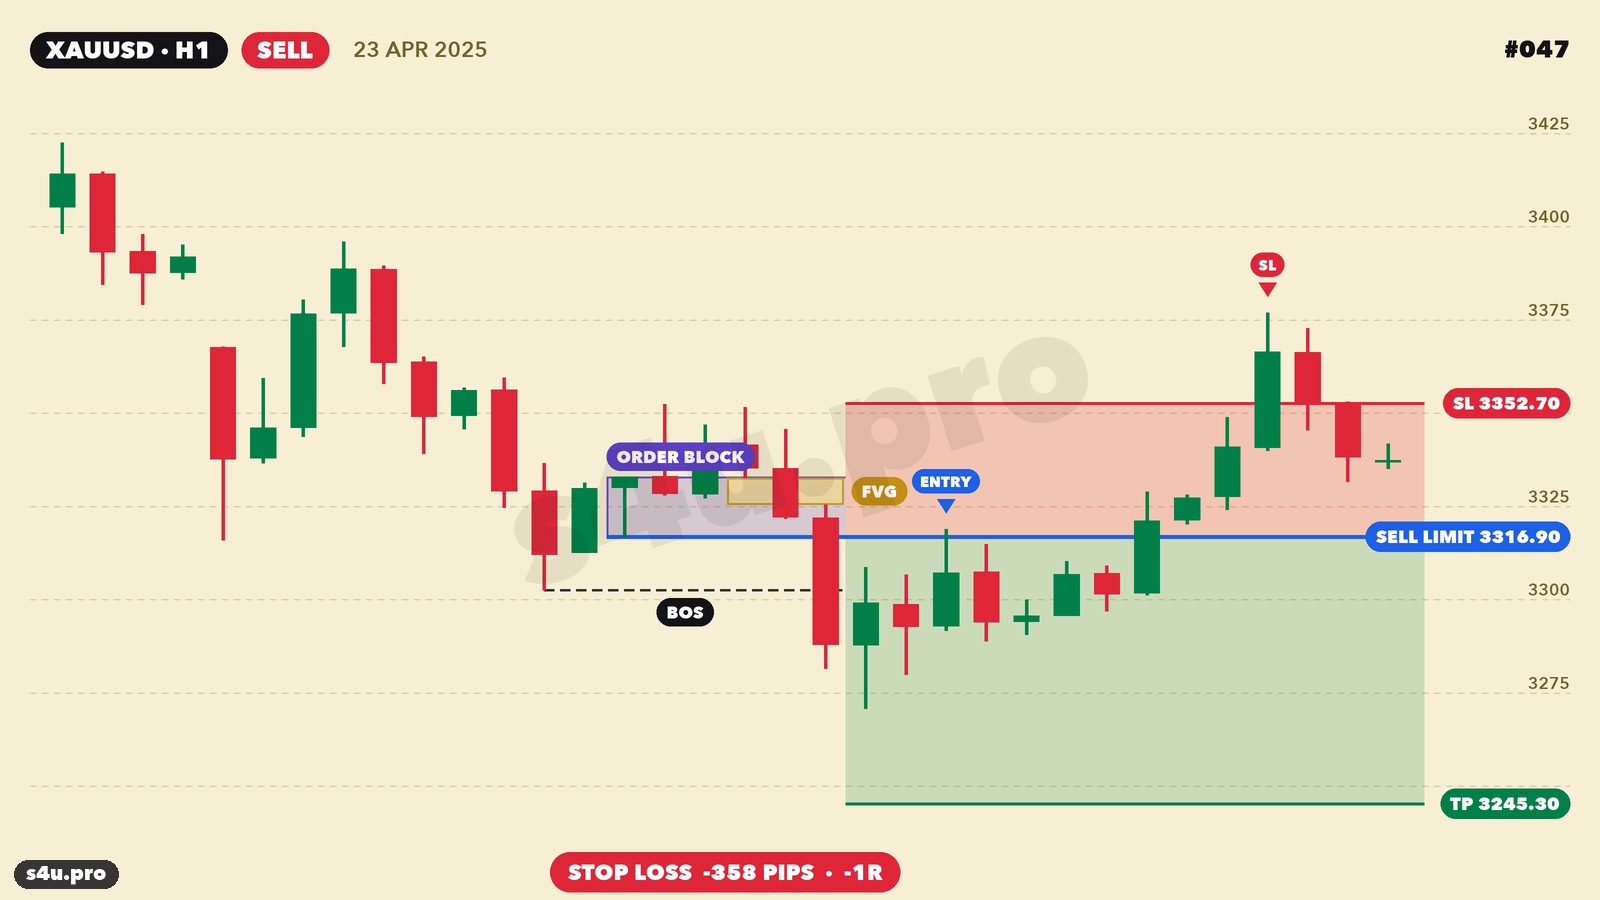
The number in the corner is the trade number in the journal. How to read the chart: the violet box is the order block, the dashed BOS line is the broken high (low), the yellow box is the FVG in the impulse, the blue line is the limit order, ENTRY is the candle where it was filled, the red zone is the stop, the green zone is the target.
Buy: July 11, 2025 — +2R
Gold breaks the high with a strong green candle and leaves an FVG. The order block is the last red candle at the bottom of the pullback. Buy Limit at the order block high (3339.00), stop below the block (3318.90), take profit 2R (3379.20). Price comes back to the block on the very next candle, and 14 hours later — take profit: +399 pips.
Sell: November 6, 2024 — +2R
The sell-off after the US election breaks the low and leaves an FVG. The order block is the last green candle before the drop. The Sell Limit at its low (2741.60) is filled in the next hour, and 4 hours later — take profit: +347 pips.
Buy: October 30, 2025 — +2R
Sell: February 26, 2026 — +2R
Buy: July 1, 2026 — +2R
The limit order waited 18 hours before price came back to the order block. The stop is large — 457 pips (this is what 2026 volatility looks like), but so is the target: +911 pips.
And This Is What Losses Look Like
The strategy has slightly more losing trades than winners — that is normal with a 2R target. A typical loss: price comes to the order block but does not bounce; it goes straight through.
Gallery: All 108 Trades
Every trade of the strategy with its chart: date, direction, result in pips and in R. Click a card to open the chart full size and use the arrows to browse. Filters show only winners, only losers or a single year. The chart itself shows the result by price movement, while the caption under the card is after the spread (3 pips), so the two differ by 3 pips.
Table of All 108 Trades
The same trades in one table: open time, session, entry, stop, target and exit prices, result in pips (after spread) and in R. The table scrolls inside the frame; the 📈 button opens the trade chart.
| # | Opened (UTC) | Session | Side | Entry | Stop | Target | Exit | Result | Pips | R | Chart |
|---|---|---|---|---|---|---|---|---|---|---|---|
| 001 | 05.06.24 12:00 | New York | SELL | 2361.90 | 2375.80 | 2334.10 | 2375.80 | SL | -142 | -1.02R | |
| 002 | 13.06.24 19:00 | Late | SELL | 2320.40 | 2342.70 | 2275.80 | 2342.70 | SL | -226 | -1.01R | |
| 003 | 17.06.24 05:00 | Asia | BUY | 2332.90 | 2310.60 | 2377.50 | 2377.50 | TP | +443 | +1.99R | |
| 004 | 26.06.24 11:00 | London | SELL | 2323.80 | 2333.40 | 2304.60 | 2333.40 | SL | -99 | -1.03R | |
| 005 | 28.06.24 05:00 | Asia | SELL | 2336.30 | 2339.70 | 2329.50 | 2339.70 | SL | -37 | -1.09R | |
| 006 | 02.07.24 14:00 | New York | BUY | 2334.80 | 2327.10 | 2350.20 | 2350.20 | TP | +151 | +1.96R | |
| 007 | 09.07.24 14:00 | New York | SELL | 2377.80 | 2387.70 | 2358.00 | 2358.00 | TP | +195 | +1.97R | |
| 008 | 15.07.24 01:00 | Asia | BUY | 2409.60 | 2395.80 | 2437.20 | 2437.20 | TP | +273 | +1.98R | |
| 009 | 17.07.24 14:00 | New York | BUY | 2475.60 | 2466.30 | 2494.20 | 2466.30 | SL | -96 | -1.03R | |
| 010 | 18.07.24 07:00 | London | SELL | 2475.80 | 2488.50 | 2450.40 | 2450.40 | TP | +251 | +1.98R | |
| 011 | 24.07.24 09:00 | London | BUY | 2411.00 | 2405.40 | 2422.20 | 2422.20 | TP | +109 | +1.95R | |
| 012 | 30.07.24 04:00 | Asia | SELL | 2384.10 | 2394.80 | 2362.70 | 2394.80 | SL | -110 | -1.03R | |
| 013 | 29.08.24 13:00 | New York | SELL | 2549.10 | 2558.10 | 2531.10 | 2558.10 | SL | -93 | -1.03R | |
| 014 | 17.09.24 11:00 | London | SELL | 2608.60 | 2617.10 | 2591.60 | 2591.60 | TP | +167 | +1.96R | |
| 015 | 17.09.24 18:00 | Late | SELL | 2598.30 | 2609.80 | 2575.30 | 2609.80 | SL | -118 | -1.03R | |
| 016 | 19.09.24 05:00 | Asia | SELL | 2594.40 | 2627.50 | 2528.20 | 2627.50 | SL | -334 | -1.01R | |
| 017 | 23.09.24 01:00 | Asia | BUY | 2641.90 | 2627.20 | 2671.30 | 2671.30 | TP | +291 | +1.98R | |
| 018 | 29.09.24 22:00 | Late | SELL | 2684.70 | 2697.20 | 2659.70 | 2659.70 | TP | +247 | +1.98R | |
| 019 | 03.10.24 13:00 | New York | SELL | 2670.30 | 2685.10 | 2640.70 | 2685.10 | SL | -151 | -1.02R | |
| 020 | 07.10.24 12:00 | New York | BUY | 2666.20 | 2658.70 | 2681.20 | 2658.70 | SL | -78 | -1.04R | |
| 021 | 10.10.24 09:00 | London | SELL | 2634.50 | 2641.30 | 2620.90 | 2641.30 | SL | -71 | -1.04R | |
| 022 | 15.10.24 06:00 | Asia | SELL | 2664.50 | 2669.60 | 2654.30 | 2669.60 | SL | -54 | -1.06R | |
| 023 | 17.10.24 11:00 | London | BUY | 2697.50 | 2689.60 | 2713.30 | 2689.60 | SL | -82 | -1.04R | |
| 024 | 21.10.24 19:00 | Late | SELL | 2732.70 | 2740.50 | 2717.10 | 2740.50 | SL | -81 | -1.04R | |
| 025 | 25.10.24 11:00 | London | SELL | 2737.60 | 2745.30 | 2722.20 | 2745.30 | SL | -80 | -1.04R | |
| 026 | 06.11.24 07:00 | London | SELL | 2741.60 | 2759.10 | 2706.60 | 2706.60 | TP | +347 | +1.98R | |
| 027 | 06.11.24 12:00 | New York | SELL | 2713.10 | 2743.10 | 2653.10 | 2653.10 | TP | +597 | +1.99R | |
| 028 | 08.11.24 02:00 | Asia | BUY | 2705.50 | 2694.30 | 2727.90 | 2694.30 | SL | -115 | -1.03R | |
| 029 | 08.11.24 11:00 | London | SELL | 2700.00 | 2718.60 | 2662.80 | 2662.80 | TP | +369 | +1.98R | |
| 030 | 15.11.24 06:00 | Asia | BUY | 2563.30 | 2541.20 | 2607.50 | 2607.50 | TP | +439 | +1.99R | |
| 031 | 19.11.24 14:00 | New York | BUY | 2629.20 | 2621.10 | 2645.40 | 2645.40 | TP | +159 | +1.96R | |
| 032 | 25.11.24 11:00 | London | SELL | 2690.00 | 2723.50 | 2623.00 | 2623.00 | TP | +667 | +1.99R | |
| 033 | 26.11.24 00:00 | Asia | SELL | 2623.70 | 2630.30 | 2610.50 | 2610.50 | TP | +129 | +1.95R | |
| 034 | 31.12.24 13:00 | New York | BUY | 2620.60 | 2614.00 | 2633.80 | 2633.80 | TP | +129 | +1.95R | |
| 035 | 06.01.25 13:00 | New York | BUY | 2646.30 | 2636.30 | 2666.30 | 2636.30 | SL | -103 | -1.03R | |
| 036 | 06.01.25 14:00 | New York | SELL | 2644.50 | 2664.10 | 2605.30 | 2664.10 | SL | -199 | -1.02R | |
| 037 | 23.01.25 11:00 | London | SELL | 2761.10 | 2773.30 | 2736.70 | 2773.30 | SL | -125 | -1.02R | |
| 038 | 29.01.25 15:00 | New York | BUY | 2767.10 | 2763.40 | 2774.50 | 2774.50 | TP | +71 | +1.92R | |
| 039 | 25.02.25 21:00 | Late | SELL | 2928.00 | 2960.00 | 2864.00 | 2864.00 | TP | +637 | +1.99R | |
| 040 | 06.03.25 14:00 | New York | SELL | 2925.30 | 2941.60 | 2892.70 | 2892.70 | TP | +323 | +1.98R | |
| 041 | 17.03.25 12:00 | New York | BUY | 2996.50 | 2989.70 | 3010.10 | 3010.10 | TP | +133 | +1.96R | |
| 042 | 19.03.25 08:00 | London | BUY | 3040.30 | 3031.00 | 3058.90 | 3058.90 | TP | +183 | +1.97R | |
| 043 | 20.03.25 10:00 | London | BUY | 3044.40 | 3031.00 | 3071.20 | 3031.00 | SL | -137 | -1.02R | |
| 044 | 26.03.25 03:00 | Asia | BUY | 3026.00 | 3021.40 | 3035.20 | 3021.40 | SL | -49 | -1.07R | |
| 045 | 27.03.25 17:00 | Late | BUY | 3060.70 | 3040.30 | 3101.50 | 3101.50 | TP | +405 | +1.99R | |
| 046 | 17.04.25 17:00 | Late | SELL | 3335.70 | 3356.10 | 3294.90 | 3356.10 | SL | -207 | -1.01R | |
| 047 | 23.04.25 16:00 | New York | SELL | 3316.90 | 3352.70 | 3245.30 | 3352.70 | SL | -361 | -1.01R | |
| 048 | 24.04.25 06:00 | Asia | BUY | 3325.50 | 3270.50 | 3435.50 | 3362.50 | Time | +367 | +0.67R | |
| 049 | 01.05.25 10:00 | London | SELL | 3231.00 | 3252.10 | 3188.80 | 3252.10 | SL | -214 | -1.01R | |
| 050 | 08.05.25 04:00 | Asia | BUY | 3394.70 | 3370.90 | 3442.30 | 3370.90 | SL | -241 | -1.01R | |
| 051 | 13.05.25 12:00 | New York | BUY | 3247.40 | 3219.80 | 3302.60 | 3219.80 | SL | -279 | -1.01R | |
| 052 | 04.06.25 16:00 | New York | BUY | 3376.20 | 3343.70 | 3441.20 | 3343.70 | SL | -328 | -1.01R | |
| 053 | 06.06.25 03:00 | Asia | SELL | 3393.30 | 3428.00 | 3323.90 | 3323.90 | TP | +691 | +1.99R | |
| 054 | 19.06.25 00:00 | Asia | SELL | 3399.50 | 3414.50 | 3369.50 | 3369.50 | TP | +297 | +1.98R | |
| 055 | 11.07.25 01:00 | Asia | BUY | 3339.00 | 3318.90 | 3379.20 | 3379.20 | TP | +399 | +1.99R | |
| 056 | 15.07.25 12:00 | New York | SELL | 3367.50 | 3375.70 | 3351.10 | 3351.10 | TP | +161 | +1.96R | |
| 057 | 17.07.25 15:00 | New York | SELL | 3342.80 | 3386.10 | 3256.20 | 3386.10 | SL | -436 | -1.01R | |
| 058 | 30.07.25 08:00 | London | BUY | 3330.70 | 3319.70 | 3352.70 | 3352.70 | TP | +217 | +1.97R | |
| 059 | 08.08.25 12:00 | New York | SELL | 3486.70 | 3507.40 | 3445.30 | 3445.30 | TP | +411 | +1.99R | |
| 060 | 08.08.25 20:00 | Late | SELL | 3473.50 | 3506.80 | 3406.90 | 3406.90 | TP | +663 | +1.99R | |
| 061 | 14.08.25 09:00 | London | SELL | 3403.90 | 3411.50 | 3388.70 | 3388.70 | TP | +149 | +1.96R | |
| 062 | 18.08.25 00:00 | Asia | SELL | 3387.30 | 3391.70 | 3378.50 | 3378.50 | TP | +85 | +1.93R | |
| 063 | 22.08.25 14:00 | New York | SELL | 3381.30 | 3392.20 | 3359.50 | 3392.20 | SL | -112 | -1.03R | |
| 064 | 26.08.25 00:00 | Asia | SELL | 3416.40 | 3421.80 | 3405.60 | 3421.80 | SL | -57 | -1.06R | |
| 065 | 23.09.25 18:00 | Late | BUY | 3791.20 | 3772.10 | 3829.40 | 3772.10 | SL | -194 | -1.02R | |
| 066 | 16.10.25 05:00 | Asia | BUY | 4229.60 | 4179.70 | 4329.40 | 4329.40 | TP | +995 | +1.99R | |
| 067 | 29.10.25 18:00 | Late | BUY | 3988.20 | 3956.90 | 4050.80 | 3956.90 | SL | -316 | -1.01R | |
| 068 | 30.10.25 05:00 | Asia | BUY | 3960.80 | 3927.30 | 4027.80 | 4027.80 | TP | +667 | +1.99R | |
| 069 | 31.10.25 18:00 | Late | SELL | 4020.80 | 4049.50 | 3963.40 | 3963.40 | TP | +571 | +1.99R | |
| 070 | 19.11.25 08:00 | London | BUY | 4079.00 | 4063.80 | 4109.40 | 4109.40 | TP | +301 | +1.98R | |
| 071 | 19.11.25 16:00 | New York | BUY | 4072.40 | 4039.80 | 4137.60 | 4039.80 | SL | -329 | -1.01R | |
| 072 | 21.11.25 13:00 | New York | SELL | 4071.80 | 4107.20 | 4001.00 | 4107.20 | SL | -357 | -1.01R | |
| 073 | 17.12.25 16:00 | New York | BUY | 4334.90 | 4302.60 | 4399.50 | 4399.50 | TP | +643 | +1.99R | |
| 074 | 24.12.25 02:00 | Asia | BUY | 4510.80 | 4457.40 | 4617.60 | 4457.40 | SL | -537 | -1.01R | |
| 075 | 31.12.25 09:00 | London | SELL | 4348.70 | 4385.20 | 4275.70 | 4385.20 | SL | -368 | -1.01R | |
| 076 | 06.01.26 11:00 | London | SELL | 4466.90 | 4486.30 | 4428.10 | 4486.30 | SL | -197 | -1.02R | |
| 077 | 06.01.26 15:00 | New York | BUY | 4479.20 | 4452.20 | 4533.20 | 4452.20 | SL | -273 | -1.01R | |
| 078 | 09.01.26 00:00 | Asia | BUY | 4472.80 | 4453.40 | 4511.60 | 4511.60 | TP | +385 | +1.98R | |
| 079 | 26.01.26 20:00 | Late | SELL | 5055.50 | 5103.30 | 4959.90 | 5103.30 | SL | -481 | -1.01R | |
| 080 | 29.01.26 21:00 | Late | SELL | 5449.40 | 5627.10 | 5094.00 | 5094.00 | TP | +3,551 | +2.00R | |
| 081 | 04.02.26 15:00 | New York | BUY | 4977.30 | 4900.20 | 5131.50 | 4900.20 | SL | -774 | -1.00R | |
| 082 | 11.02.26 13:00 | New York | BUY | 5070.90 | 5021.00 | 5170.70 | 5021.00 | SL | -502 | -1.01R | |
| 083 | 19.02.26 10:00 | London | BUY | 5006.70 | 4971.20 | 5077.70 | 5077.70 | TP | +707 | +1.99R | |
| 084 | 20.02.26 15:00 | New York | BUY | 5016.80 | 4981.70 | 5087.00 | 5087.00 | TP | +699 | +1.99R | |
| 085 | 26.02.26 01:00 | Asia | SELL | 5209.10 | 5237.60 | 5152.10 | 5152.10 | TP | +567 | +1.99R | |
| 086 | 03.03.26 18:00 | Late | SELL | 5148.20 | 5237.20 | 4970.20 | 5116.70 | Time | +312 | +0.35R | |
| 087 | 17.03.26 06:00 | Asia | BUY | 5019.30 | 5002.00 | 5053.90 | 5002.00 | SL | -176 | -1.02R | |
| 088 | 20.03.26 20:00 | Late | SELL | 4554.00 | 4616.60 | 4428.80 | 4428.80 | TP | +1,249 | +2.00R | |
| 089 | 27.03.26 02:00 | Asia | SELL | 4433.70 | 4476.90 | 4347.30 | 4476.90 | SL | -435 | -1.01R | |
| 090 | 20.04.26 09:00 | London | SELL | 4856.90 | 4918.00 | 4734.70 | 4734.70 | TP | +1,219 | +2.00R | |
| 091 | 24.04.26 07:00 | London | SELL | 4706.30 | 4727.00 | 4664.90 | 4727.00 | SL | -210 | -1.01R | |
| 092 | 22.05.26 02:00 | Asia | BUY | 4520.20 | 4488.00 | 4584.60 | 4488.00 | SL | -325 | -1.01R | |
| 093 | 02.06.26 13:00 | New York | BUY | 4533.80 | 4475.70 | 4650.00 | 4475.70 | SL | -584 | -1.01R | |
| 094 | 26.06.26 02:00 | Asia | BUY | 4021.40 | 3976.00 | 4112.20 | 3976.00 | SL | -457 | -1.01R | |
| 095 | 01.07.26 01:00 | Asia | BUY | 4000.80 | 3955.10 | 4092.20 | 4092.20 | TP | +911 | +1.99R | |
| 096 | 19.07.26 22:00 | Late | BUY | 3999.60 | 3962.70 | 4073.40 | 4073.40 | TP | +735 | +1.99R | |
| 097 | 22.07.26 18:00 | Late | BUY | 4139.50 | 4110.10 | 4198.30 | 4110.10 | SL | -297 | -1.01R | |
| 098 | 24.07.26 07:00 | London | SELL | 4043.20 | 4054.40 | 4020.80 | 4054.40 | SL | -115 | -1.03R | |
| 099 | 28.07.26 17:00 | Late | BUY | 4036.10 | 4010.80 | 4086.70 | 4010.80 | SL | -256 | -1.01R | |
| 100 | 03.08.26 19:00 | Late | SELL | 4109.10 | 4127.60 | 4072.10 | 4127.60 | SL | -188 | -1.02R | |
| 101 | 07.08.26 02:00 | Asia | SELL | 4319.40 | 4344.50 | 4269.20 | 4344.50 | SL | -254 | -1.01R | |
| 102 | 17.08.26 12:00 | New York | BUY | 4441.90 | 4422.00 | 4481.70 | 4481.70 | TP | +395 | +1.98R | |
| 103 | 17.08.26 18:00 | Late | BUY | 4455.40 | 4433.10 | 4500.00 | 4433.10 | SL | -226 | -1.01R | |
| 104 | 20.08.26 13:00 | New York | SELL | 4537.20 | 4556.20 | 4499.20 | 4556.20 | SL | -193 | -1.02R | |
| 105 | 24.08.26 00:00 | Asia | BUY | 4659.10 | 4620.20 | 4736.90 | 4736.90 | TP | +775 | +1.99R | |
| 106 | 27.08.26 05:00 | Asia | BUY | 4664.60 | 4637.90 | 4718.00 | 4637.90 | SL | -270 | -1.01R | |
| 107 | 28.09.26 16:00 | New York | SELL | 4175.00 | 4204.10 | 4116.80 | 4204.10 | SL | -294 | -1.01R | |
| 108 | 13.10.26 13:00 | New York | BUY | 4195.70 | 4173.40 | 4240.30 | 4173.40 | SL | -226 | -1.01R | |
| Total: 108 | +11,188 | +36.7R | |||||||||
- Click “Open the bot” and tap “Start” in Telegram.
- Used the bot before and there is no “Start” button? Just send the bot the message /start.
- Not subscribed to @strategy4you yet — the bot will ask you to subscribe: subscribe and tap “✅ I’ve subscribed”. Already subscribed — the bot goes straight to the next step.
- The bot sends a “Get the EA for free” button — tap it to open the bonus page.
- On the page find the “📊 Strategy trade journals” block and click “Download Excel” (the “Download indicator” button is right next to it).
How to Calculate Lot Size for Gold
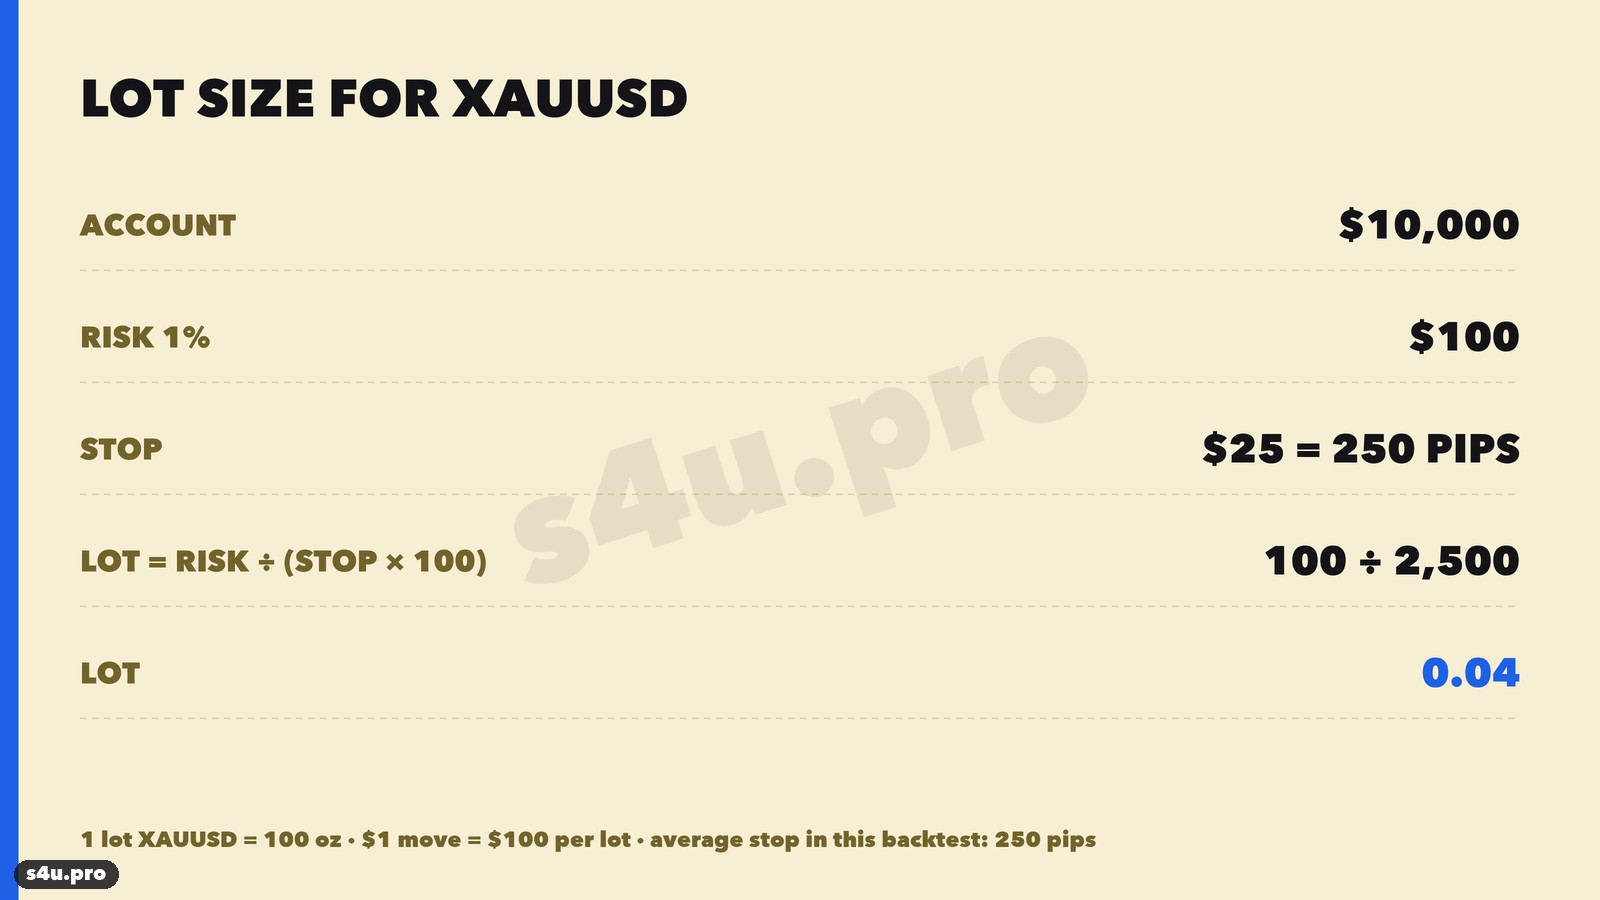
On XAUUSD, 1 standard lot = 100 ounces, so a $1 price move = $100 per lot. The formula:
Lot = Risk in $ ÷ (Stop in $ × 100)Example: $10,000 account, 1% risk = $100, a $25 stop (250 pips — the average stop in this test) → 100 ÷ (25 × 100) = 0.04 lot.
Common Order Block Trading Mistakes
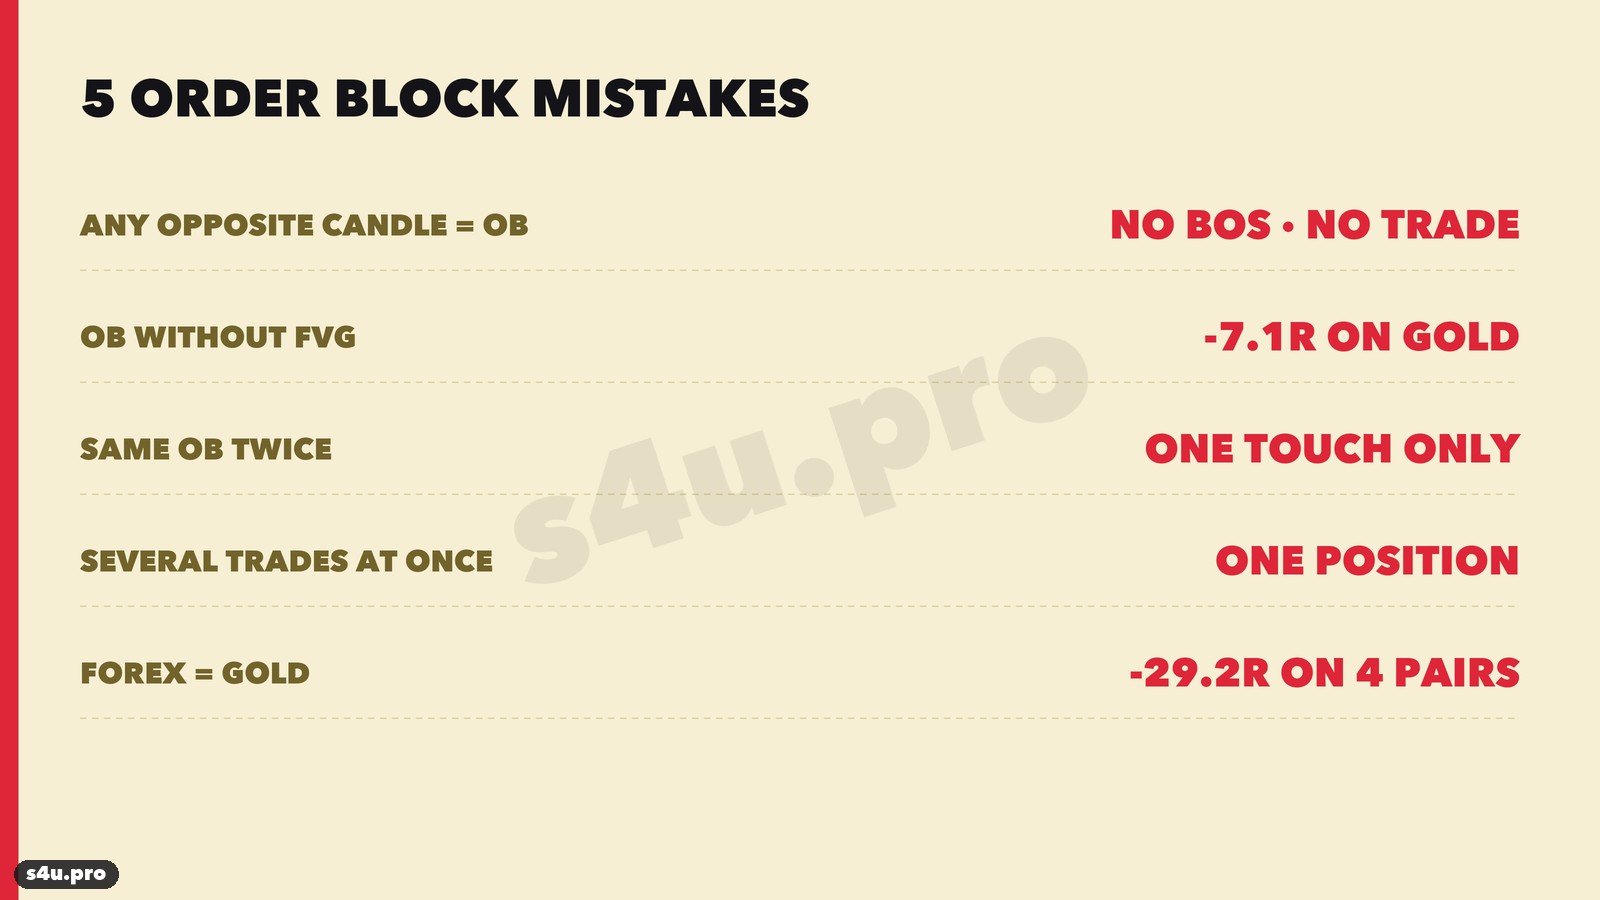
- Calling any opposite candle an order block. Without a break of structure (BOS) it is just a candle.
- Trading order blocks without an FVG. On gold those trades lost −7.1R — a loss where the FVG version made money.
- Entering the same block a second time. An order block works once: if price has already tested it, the orders there are used up.
- Opening several trades at once. Often 2–3 order blocks trigger on the same candle — that is one idea, not three. Without a “one trade” rule your risk quietly triples.
- Applying the rules to forex without testing. On four currency pairs the same strategy lost −29.2R.
FAQ: Order Blocks
How is an order block different from a supply and demand zone?
A supply/demand zone is a base of several candles before a move. An order block is one specific candle, and a break of structure is a must. In effect, an order block is a stricter version of a demand zone.
Where to enter: at the edge of the order block or at its middle?
We tested both on all order blocks (without the FVG filter). The middle entry fills three times less often — 49 trades vs 165: price often reverses before reaching 50%. The trades are of higher quality (profit factor 1.64 vs 1.21), but the total is smaller: +17.6R vs +21.1R. That is why the strategy enters at the near edge.
Which timeframe is best?
The statistics in this article are for H1. On H4 the same rules are also profitable, but weaker: 39 trades, +6.8R over 2.5 years. On M5–M15 there is more noise, and the spread eats a noticeable part of the stop.
What if price goes straight through the order block?
The trade closes at the stop. A broken block often “flips” and becomes a Breaker Block — that is a separate model, and we will cover it in a future article.
Can you combine an Order Block and an FVG in one trade?
That is exactly how this strategy works: the FVG is the filter, the entry is at the edge of the order block. A stand-alone FVG gold strategy is covered in “Fair Value Gap (FVG) Explained + Gold Strategy”.
Is this guaranteed profit?
No. This is a historical result: 108 trades, +36.8R. Future results may be worse, and in 2026 the strategy is around break-even.
Video: Order Block Gold Strategy Step by Step
Conclusion
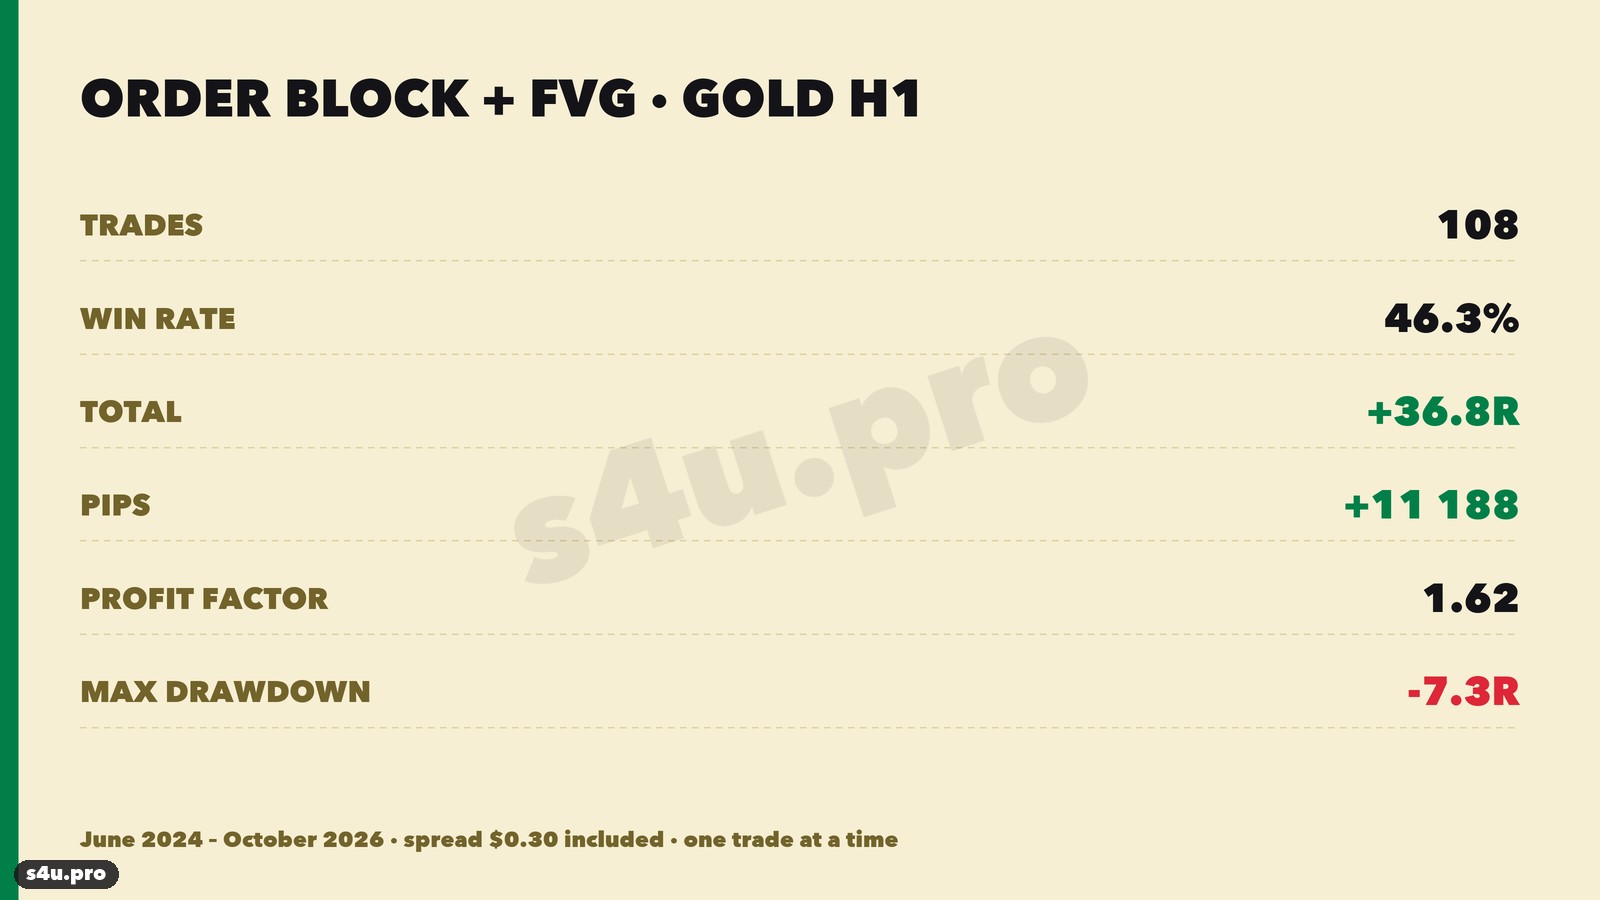
- An Order Block is the last candle against the move before an impulse that broke structure.
- The key part of the strategy is the FVG in the impulse: order blocks with an imbalance made +36.8R on 108 trades, without it — −7.1R.
- Simple mechanics on gold (H1, limit at the edge of the block, stop beyond the block, 2R target) were profitable in 2024 and 2025 and around break-even in 2026.
- Almost half the trades win (46.3%), and the max drawdown is −7.3R — noticeably calmer than the pure FVG strategy.
- On forex pairs the same strategy loses money — gold only.
Before trading it on a live account, test the strategy on demo — and keep your own trade journal, just like in this article.
This article is for educational purposes only and is not investment advice. Forex and CFD trading involves a high risk of losing money. Past results do not guarantee future profits. Data: COMEX gold futures (GC), hourly candles, UTC time; XAUUSD quotes at your broker may differ slightly.