Contents 4
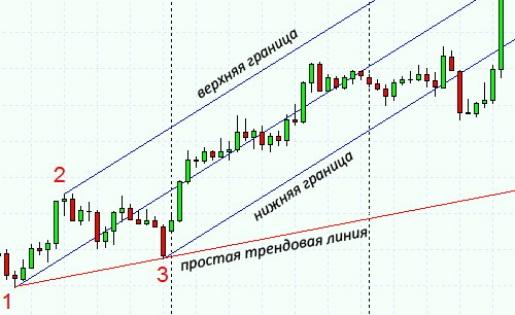 Alan Andrews developed an analytical trading tool that helps buyers and sellers choose and adjust their market strategy. Using it requires a feel for the dynamics of price trends.
How Andrews’ Pitchfork is built
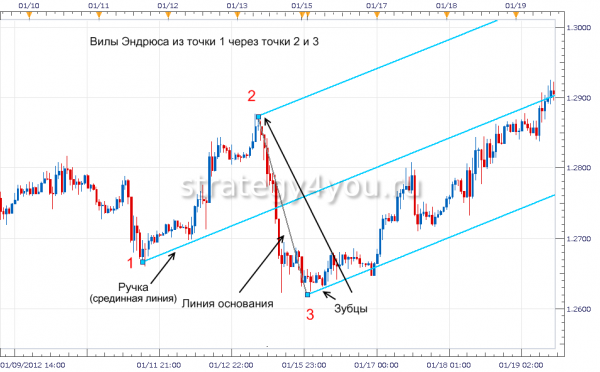 Andrews’ Pitchfork is a trading indicator / tool in MT4 (MT5) that shows on the chart the range of a trend’s movement, forming a price channel. The drawing consists of 1 median line and 2 parallel lines placed at equal distances. The median line shows the path of an emerging or dominant trend, while the parallel lines show support and resistance. The chart also lets you track possible pullbacks in price movement.
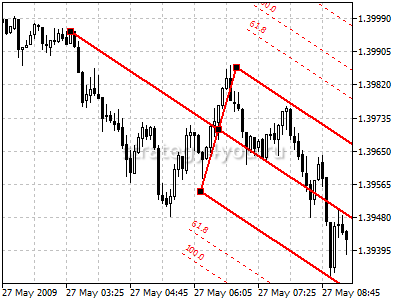 To put the indicator on a chart, first find a forming or already dominant trend in the futures or currency market with steadily rising or falling prices (an uptrend or a downtrend). The start of the move is marked as point A.
Then find the breakout line, i.e. the sharp reversal of price movement. Mark its price low (B) and high (C) on it and divide the distance between them into 2 equal parts. The median line is drawn through the midpoint of this breakout line and point A, which marks the start of the move. The auxiliary lines showing resistance and support are drawn parallel to the median line through points B and C.
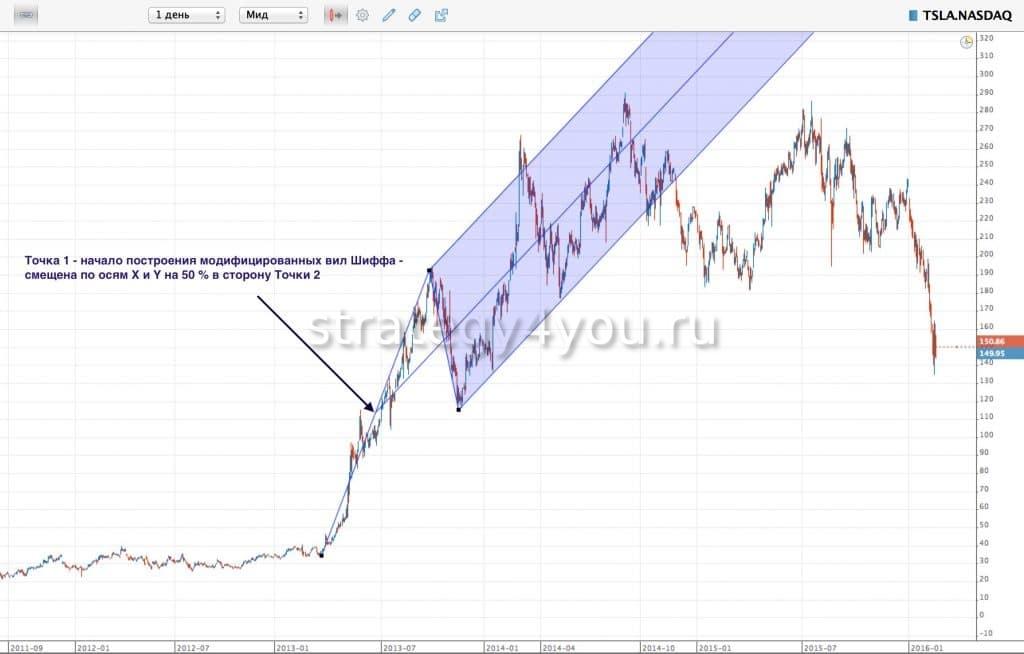
The figure obtained this way is the Pitchfork. There is a modification of it that avoids an overly narrow channel — the Schiff Pitchfork. Its median line is drawn not from the trend start point (A) but from a point shifted 50% along the axis.
With today’s technology, drawing the Pitchfork is easy. Any trading terminal lets you add this indicator to the chart.
Trading rules with Andrews’ Pitchfork
This technical indicator reveals regularities in price trends. The median line of the Pitchfork represents the optimized «true value» of the trend, while the prongs let you judge the price amplitude and predict likely bounces from the upper and lower resistance boundaries. The stronger the market, i.e. the more money involved, the more likely such a bounce is.
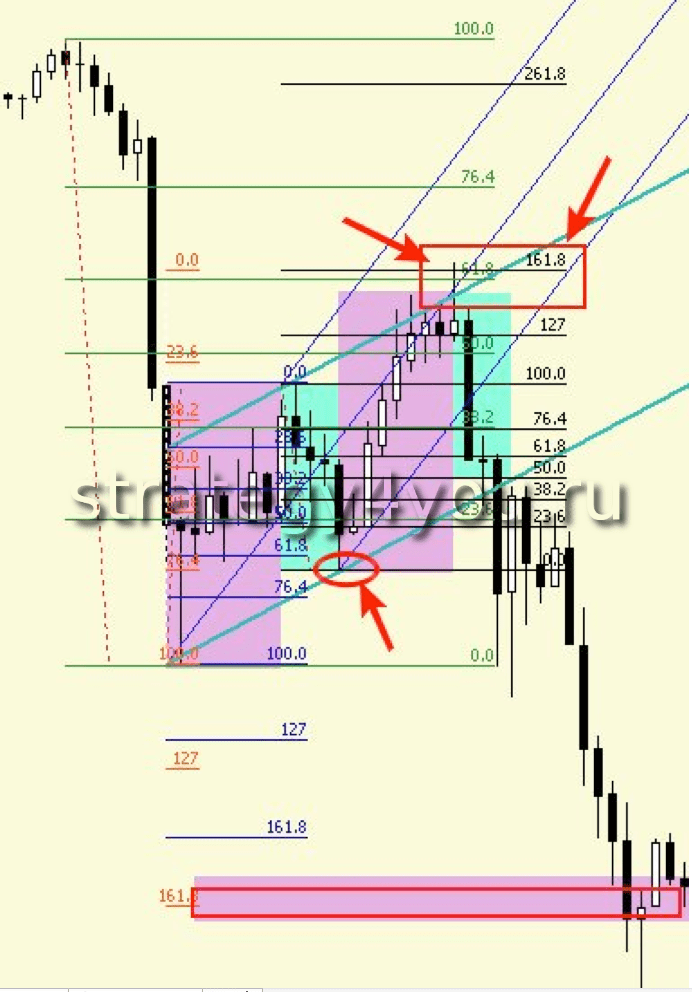 Price bounces trigger changes in market behavior in line with the price trend, so it is important to track them and, better still, to be able to forecast them. Trading the Pitchfork on short timeframes gives good results.
As long as the price fluctuates in a range close to the median line, the trend continues. As a rule, the price keeps returning to its median with minor deviations, and the trader’s strategy is based on this.
The market’s elasticity, defined by its upper and lower resistance boundaries, keeps the price inside the channel marked by the Pitchfork, so the trend develops mostly inside it. When the price crosses the upper or lower boundary of the range, a reversal is likely in 80% of cases.
- Example — using the Pitchfork with a Flag pattern:
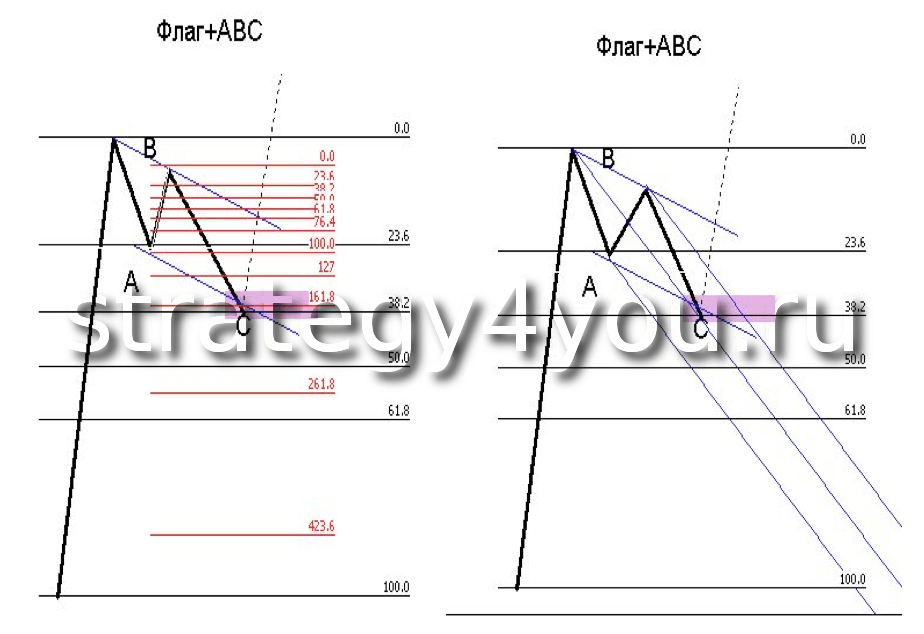
In less than 10% of cases a false breakout occurs: the price briefly and slightly goes beyond the Pitchfork and soon returns. This is a negligible and natural error.
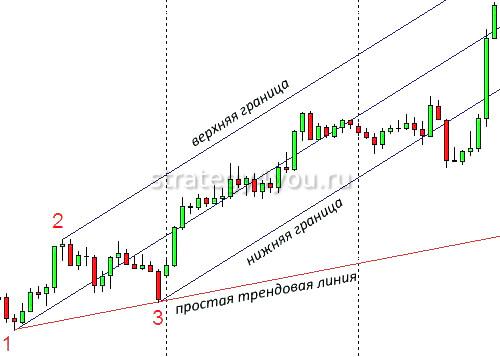 Only a breakout that is sustained in size and time beyond the boundaries signals an upcoming trend reversal. It should be confirmed by other signs, in particular a shift of the trend line.
In such a situation the trader has to make a decision quickly.
- Here is another example of the Pitchfork used in the «Rooks» strategy on our site:
Free EA for MT4 / MT5 + trade journals Get it free
Opening orders with the Pitchfork and signal lines
The signal line complements Andrews’ Pitchfork and helps assess how strong or weak the market is and, accordingly, how stable the price channel is. You get it on the chart by connecting the trend start point (A) with the low of the move for an uptrend (lower signal line) or with the high for a downtrend (upper signal line).
The rules for opening orders take into account both the Pitchfork and both signal lines.
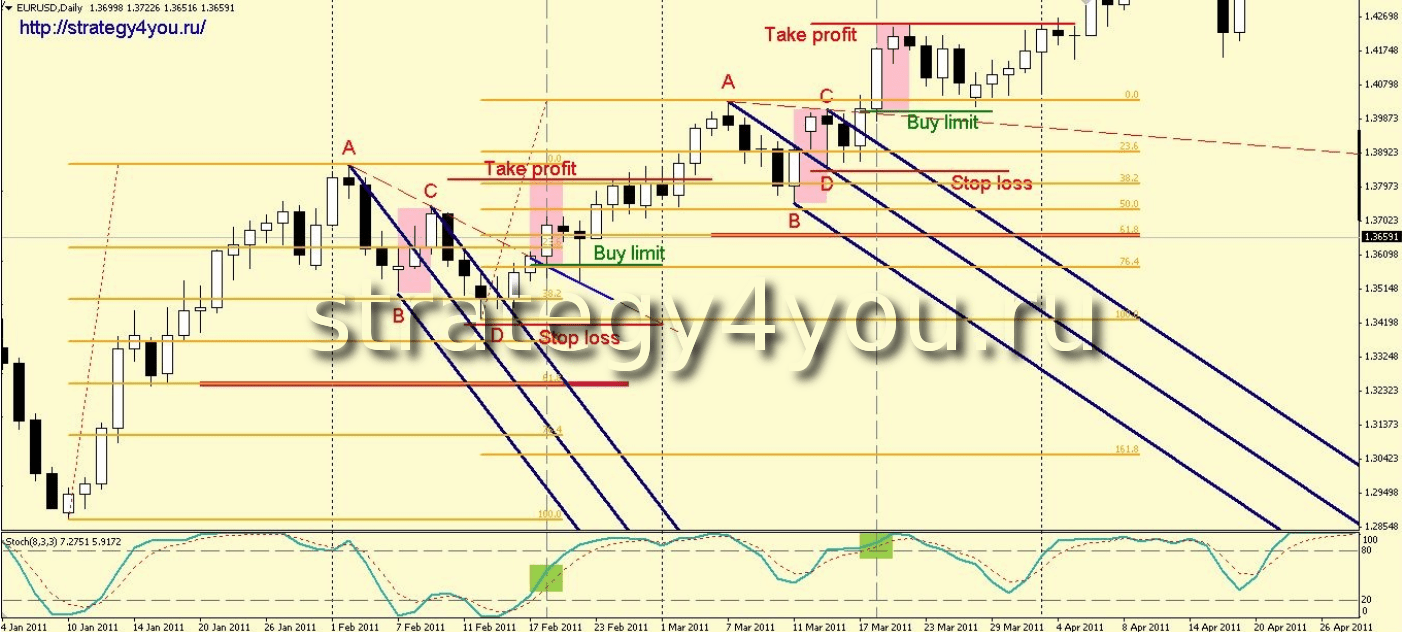
So a bounce from the lower prong is a good moment to open buy orders. The price stays in the growth zone until it reaches the median line. Once the median is crossed, a reversal is possible, so it is better to close the trade.
Conversely, a bounce from the upper prong is a signal to start selling. A reversal on reaching the median line is also possible here, so track the trend in time and lock in the profit.
A rise above the upper boundary of the Pitchfork in a downtrend signals a good moment to start buying. In an uptrend, crossing the lower boundary of the Pitchfork points to the need to sell.
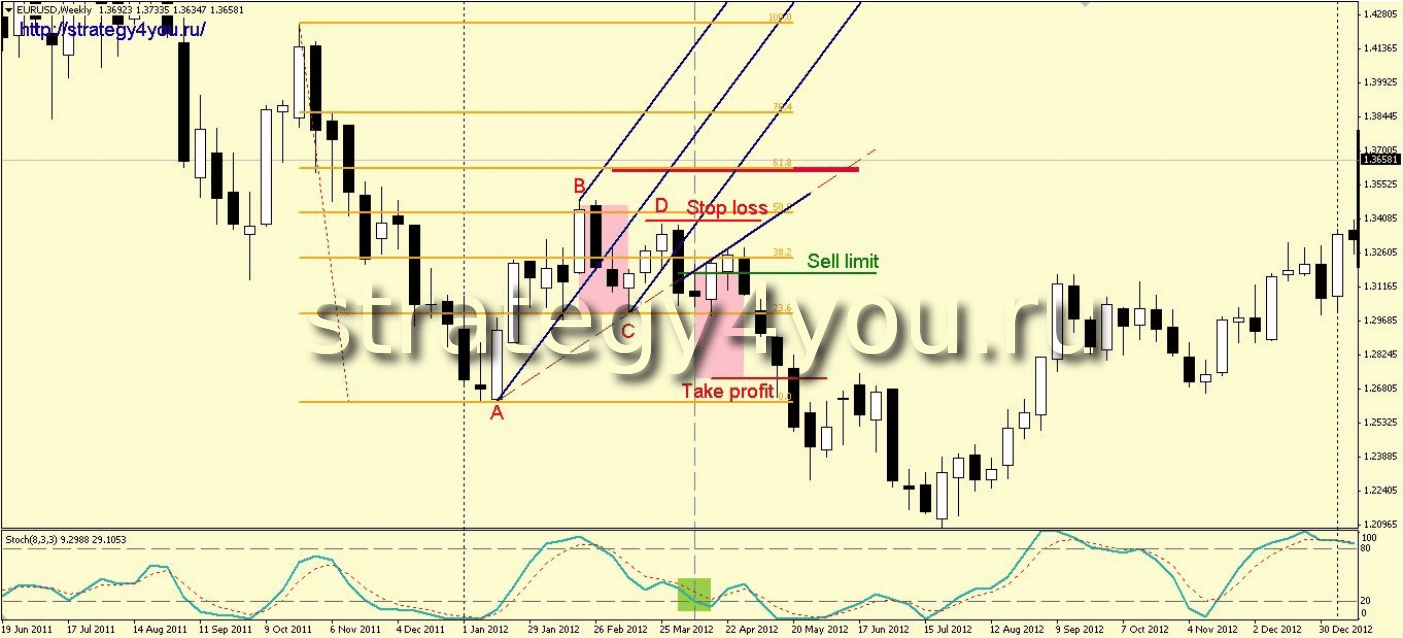
Breaking the upper signal line in a downtrend shows the strength of buyers and favors buying. Breaking the lower signal line in an uptrend signals market weakness and overall instability. In that case an experienced trader starts selling.
So spotting Pitchfork breakouts and using them in time brings tangible profit, especially in the short term.
- An example on our site — the «Fork» strategy:
Conclusion
The Pitchfork is a useful tool for analyzing price channels, including in the MetaTrader 4/5 terminal (MT4). The reliability of its readings exceeds 80%. However, a trader should build a strategy by analyzing other market indicators too, to minimize risk. It makes sense to use this indicator as part of a systematic analysis of the situation.