The H&S pattern (also called Head and Shoulders) is probably the most popular chart pattern in trading. It is described in almost every trading book, and every lecturer and teacher talks about it.
But we decided to go further and, besides the basics, cover:
- The biggest mistake traders make with the Head and Shoulders pattern.
- How to find the ideal entry point.
- What you should definitely not do.
What the pattern looks like
Head and Shoulders is a trend reversal pattern. For example, if you notice it in a bull market, sellers will soon take over and the price will start to fall.
This is what the Head and Shoulders pattern looks like on a chart:
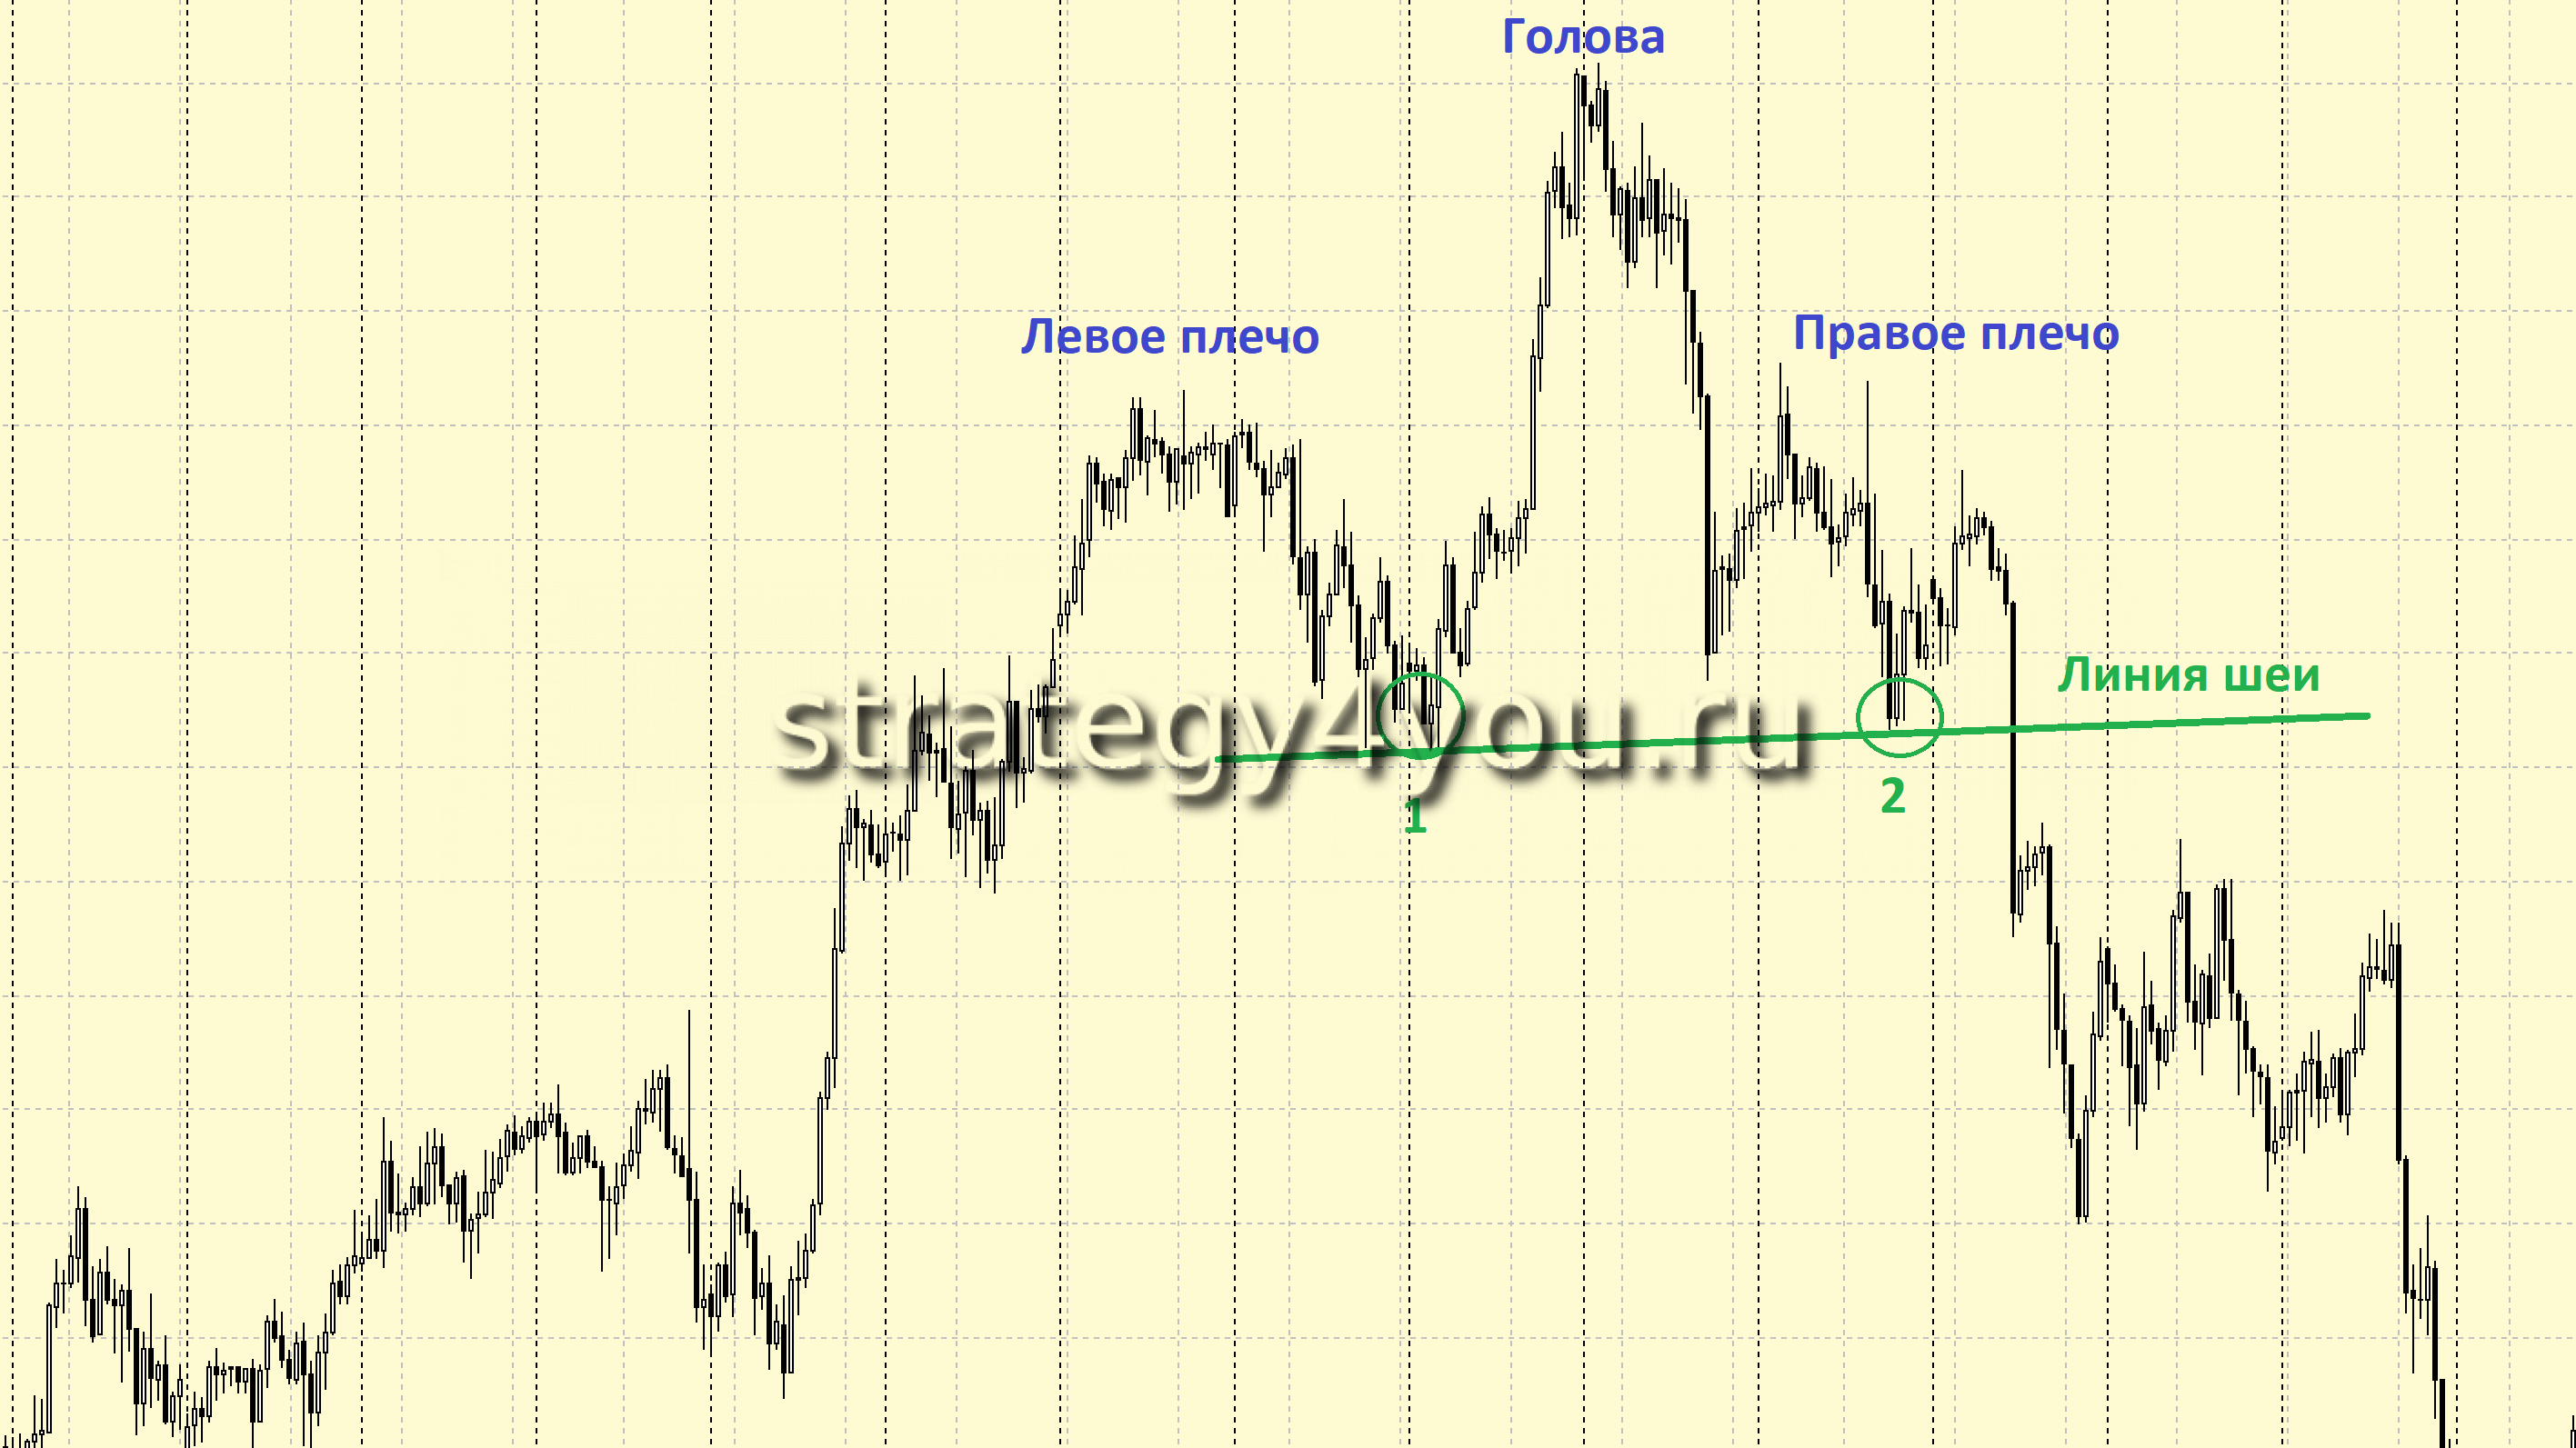
The pattern consists of 3 peaks, where:
- The middle peak is the head. It is the highest part of the pattern.
- The two side peaks are the shoulders. They are lower than the middle peak (the head).
Spotting patterns on a chart after the fact is easy, though. How do you identify this one in real time? Here is how:
- In an uptrend, the price makes a new high and then falls, forming the left shoulder. Here we can see the trend clearly weakening. The low of the left shoulder is the first trough of the pattern (1).
- Then, by inertia, the price rises again and sets a new high (the head). There is still hope that the trend will continue. But as soon as the price drops back to the level of the first trough, it becomes clear that the bulls are running out of steam. This is how the second trough (2) forms.
- The buyers still have enough strength for one last push, which reaches the high of the first shoulder. After that the inevitable decline begins — a clear trend reversal signal.
The pattern is considered complete, and we can sell, once the neckline is broken. The neckline is drawn between the first trough of the pattern (the end of the left shoulder and the start of the head) and the second trough (the end of the head and the start of the right shoulder):
How to trade Head and Shoulders
Now let’s look at the strategy for trading this pattern!
The most important condition is that the Head and Shoulders pattern must be preceded by an uptrend. Many beginners make the mistake of looking for this pattern when there is no trend. In a sideways market this pattern does not work.
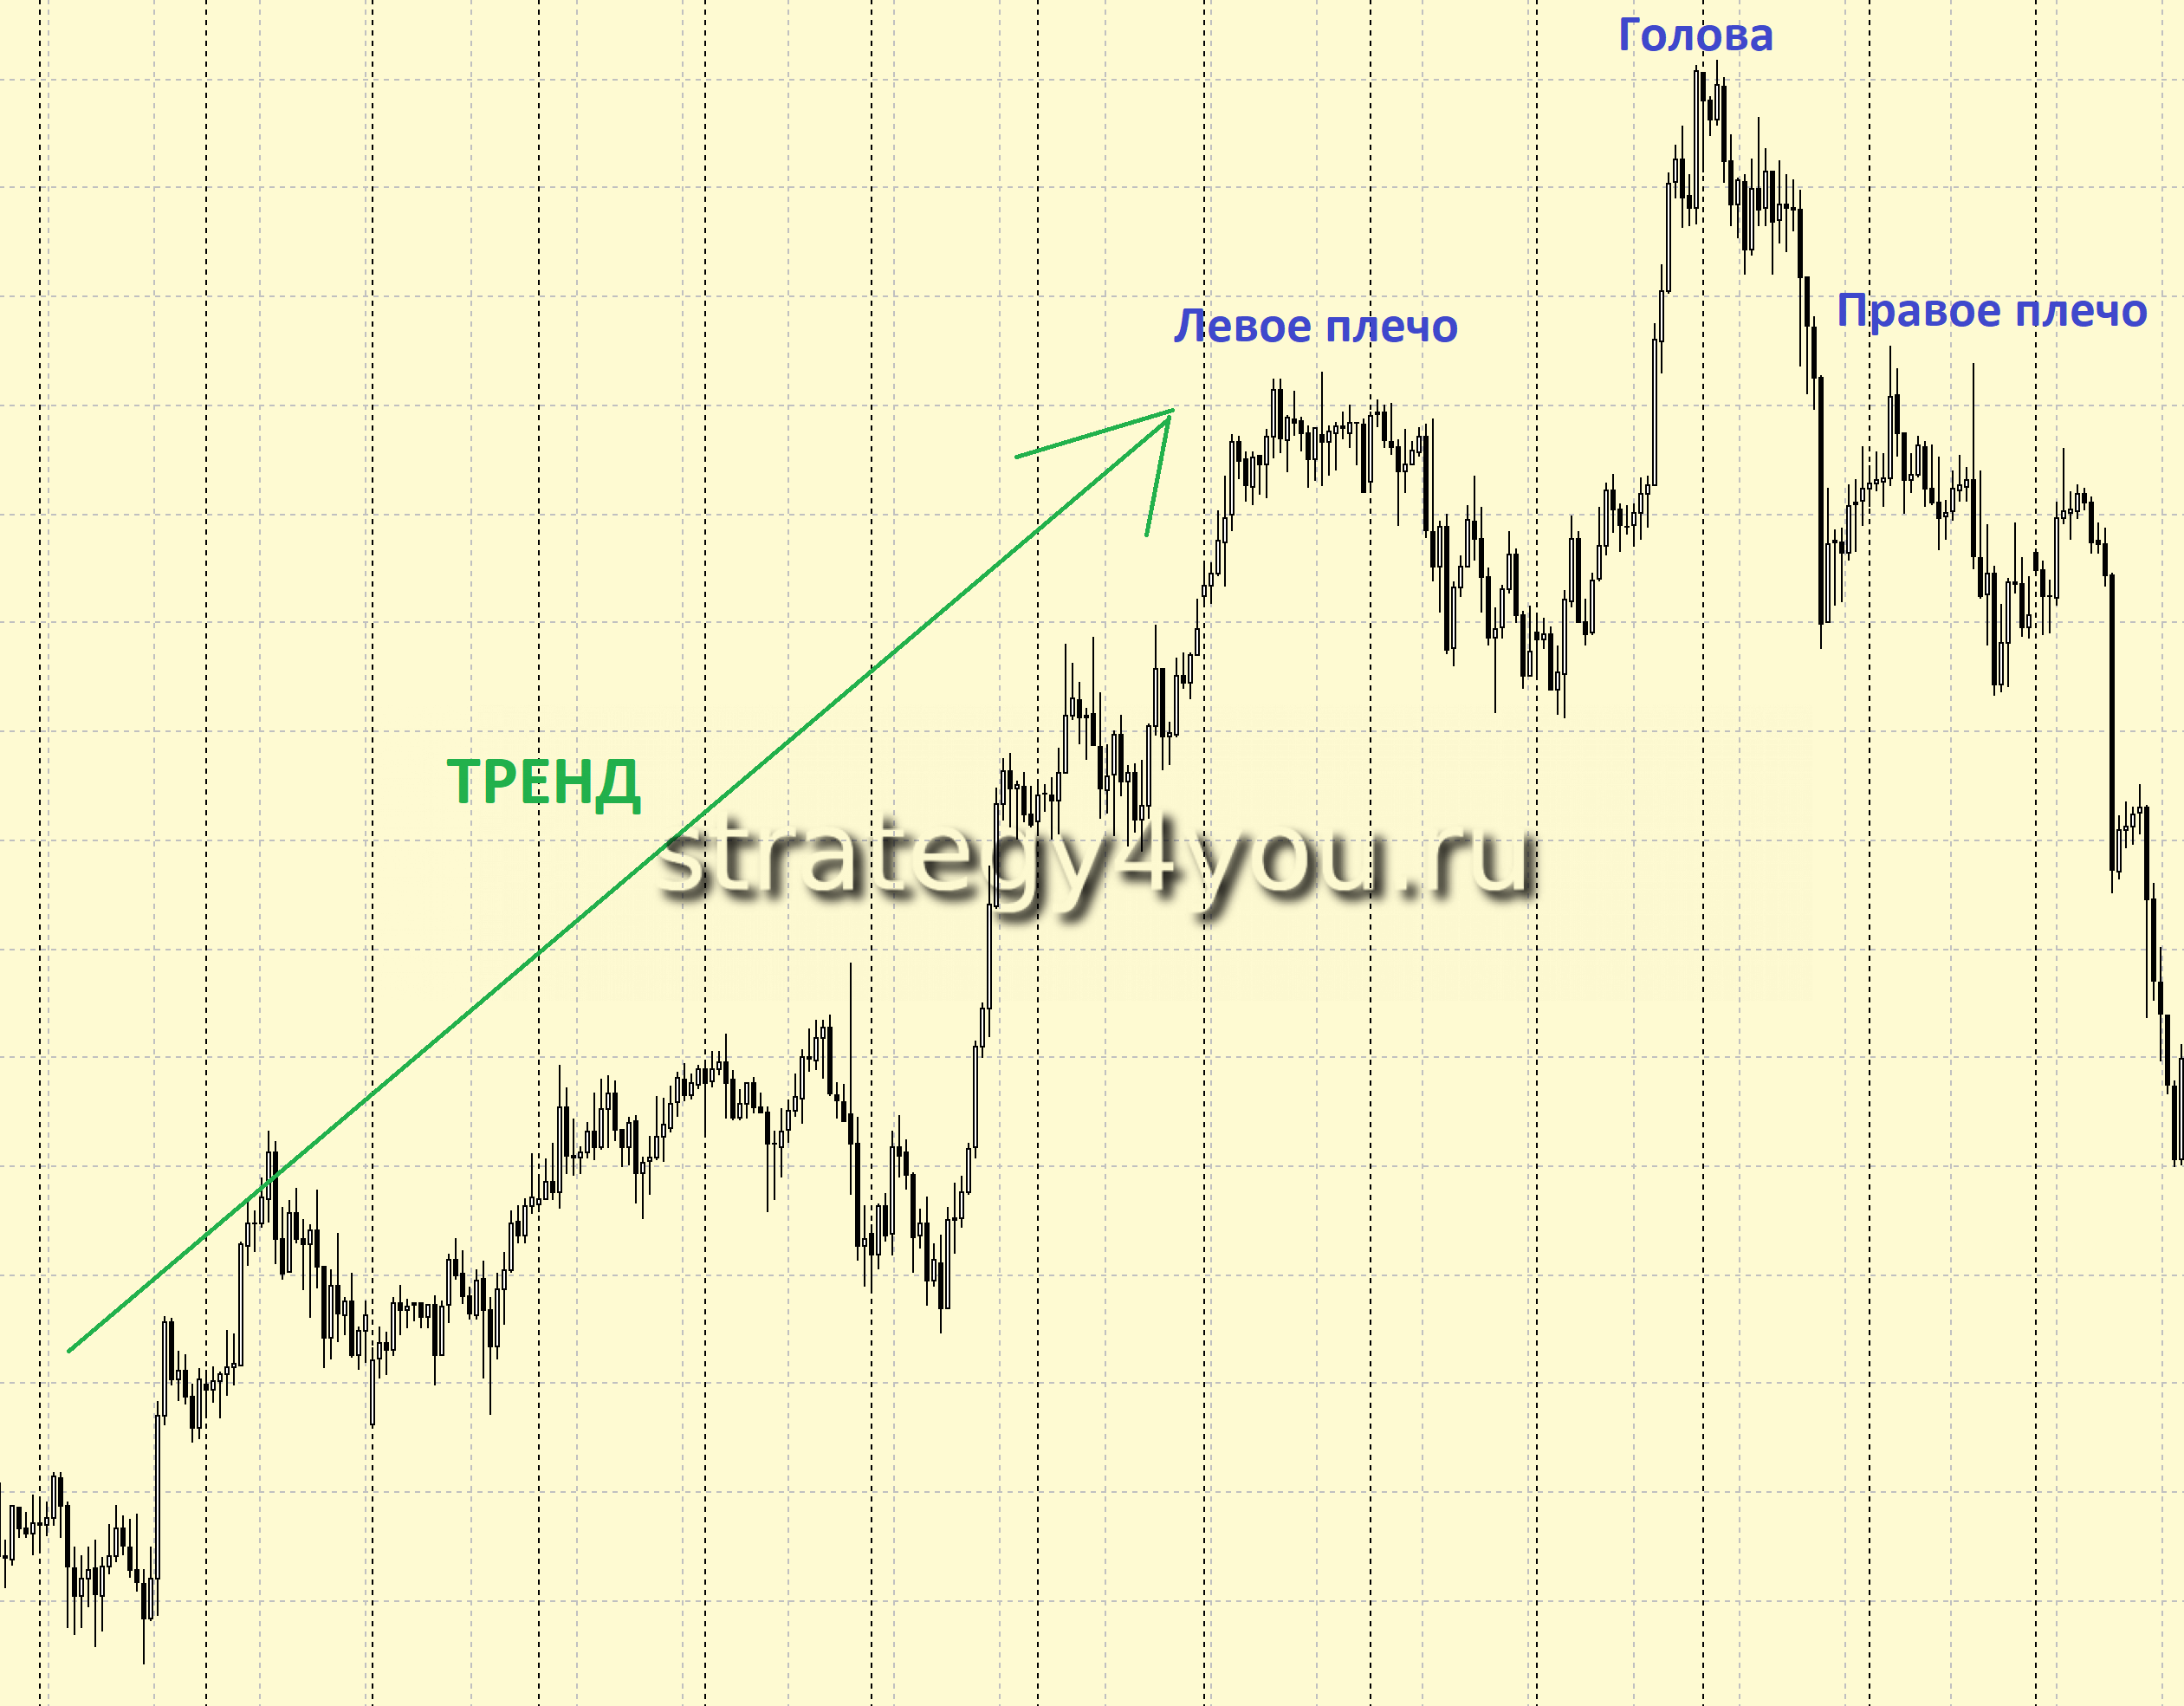
⇒ The entry signal is simple: open a short position (sell) when a candle closes below the neckline. It is important to wait not just for a break of the support level but for the candle close. After the breakout, the support level (the neckline) turns into resistance.
⇒ The minimum take-profit target equals the distance from the top of the head to the neckline. However, you will often get a chance to take much more profit than that. See the example on the chart above.
So when the take-profit level is reached, it is better to close part of the trade and put the rest on a trailing stop or calculate targets with Fibonacci.
⇒ Place the stop loss at least above the right shoulder.
How to improve your odds
There is a signal in the Head and Shoulders pattern that indicates the pattern is very likely to play out as expected. It is when the second trough is slightly higher than the first one. This means the neckline rises slightly from left to right.
If the neckline is horizontal or even slopes slightly downward from left to right, a failure is likely.
What does trading volume tell us?
Volume can be a great help when trading this chart pattern. Here are some features:
- Trading volume should be higher when the head forms than when the left shoulder forms.
- At the peak of the right shoulder, volume should be lower than at the other two peaks — the left shoulder and the head.
- Volume should increase when the neckline is broken.
- If the price retests the neckline, volume falls, and when the price bounces off it, volume rises again.
Which timeframe is best?
This pattern can be traded on any timeframe from M30 upward. But remember: the higher the timeframe, the better the pattern works.
Which chart type should you use?
Beginners who want a clearer picture can use a line chart. But I still recommend Japanese candlesticks. They carry more information, and the candle close lets us judge whether a neckline break is genuine.
A small trick that can double your profit
Sometimes, after the pattern is confirmed by a neckline break, the price starts rising again and returns to it. The neckline, which has already become resistance, gets tested once more.
How to enter at a better price
The Head and Shoulders pattern trades very well, but I would like to show how technical analysis on forex lets you enter the market even earlier and therefore earn even more.
Here are examples where we got many more entry signals at a much better price (before the neckline break):
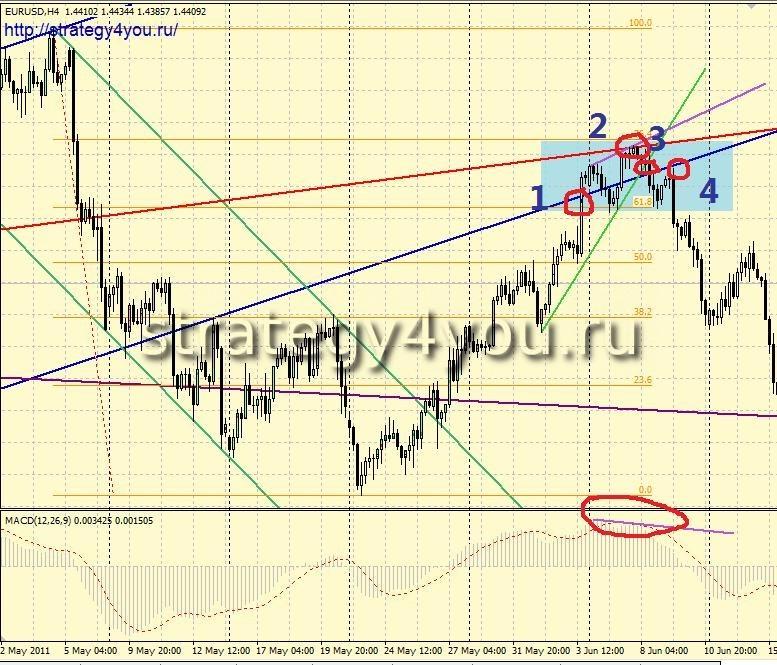
Point 1: A retest of the blue channel line + the 61.8% Fibonacci level, with a stop loss above 76.4% — an excellent entry point!
Point 2: If you did not sell at point 1, enter on the retest of the red trend line; note also that a MACD divergence has formed. The stop loss is the same.
Point 3: Suppose we missed the limit-order entries at points 1 and 2. Then we enter on the break of the green trend line.
Point 4: A break of the green and blue trend lines, candles closing below them, another retest of the blue line from below + all the signals above for points 1, 2 and 3.
Following the Head and Shoulders pattern alone, we would have entered on the neckline break much later than these signals allowed. We would have got a worse price than even at point 1.
Inverse Head and Shoulders
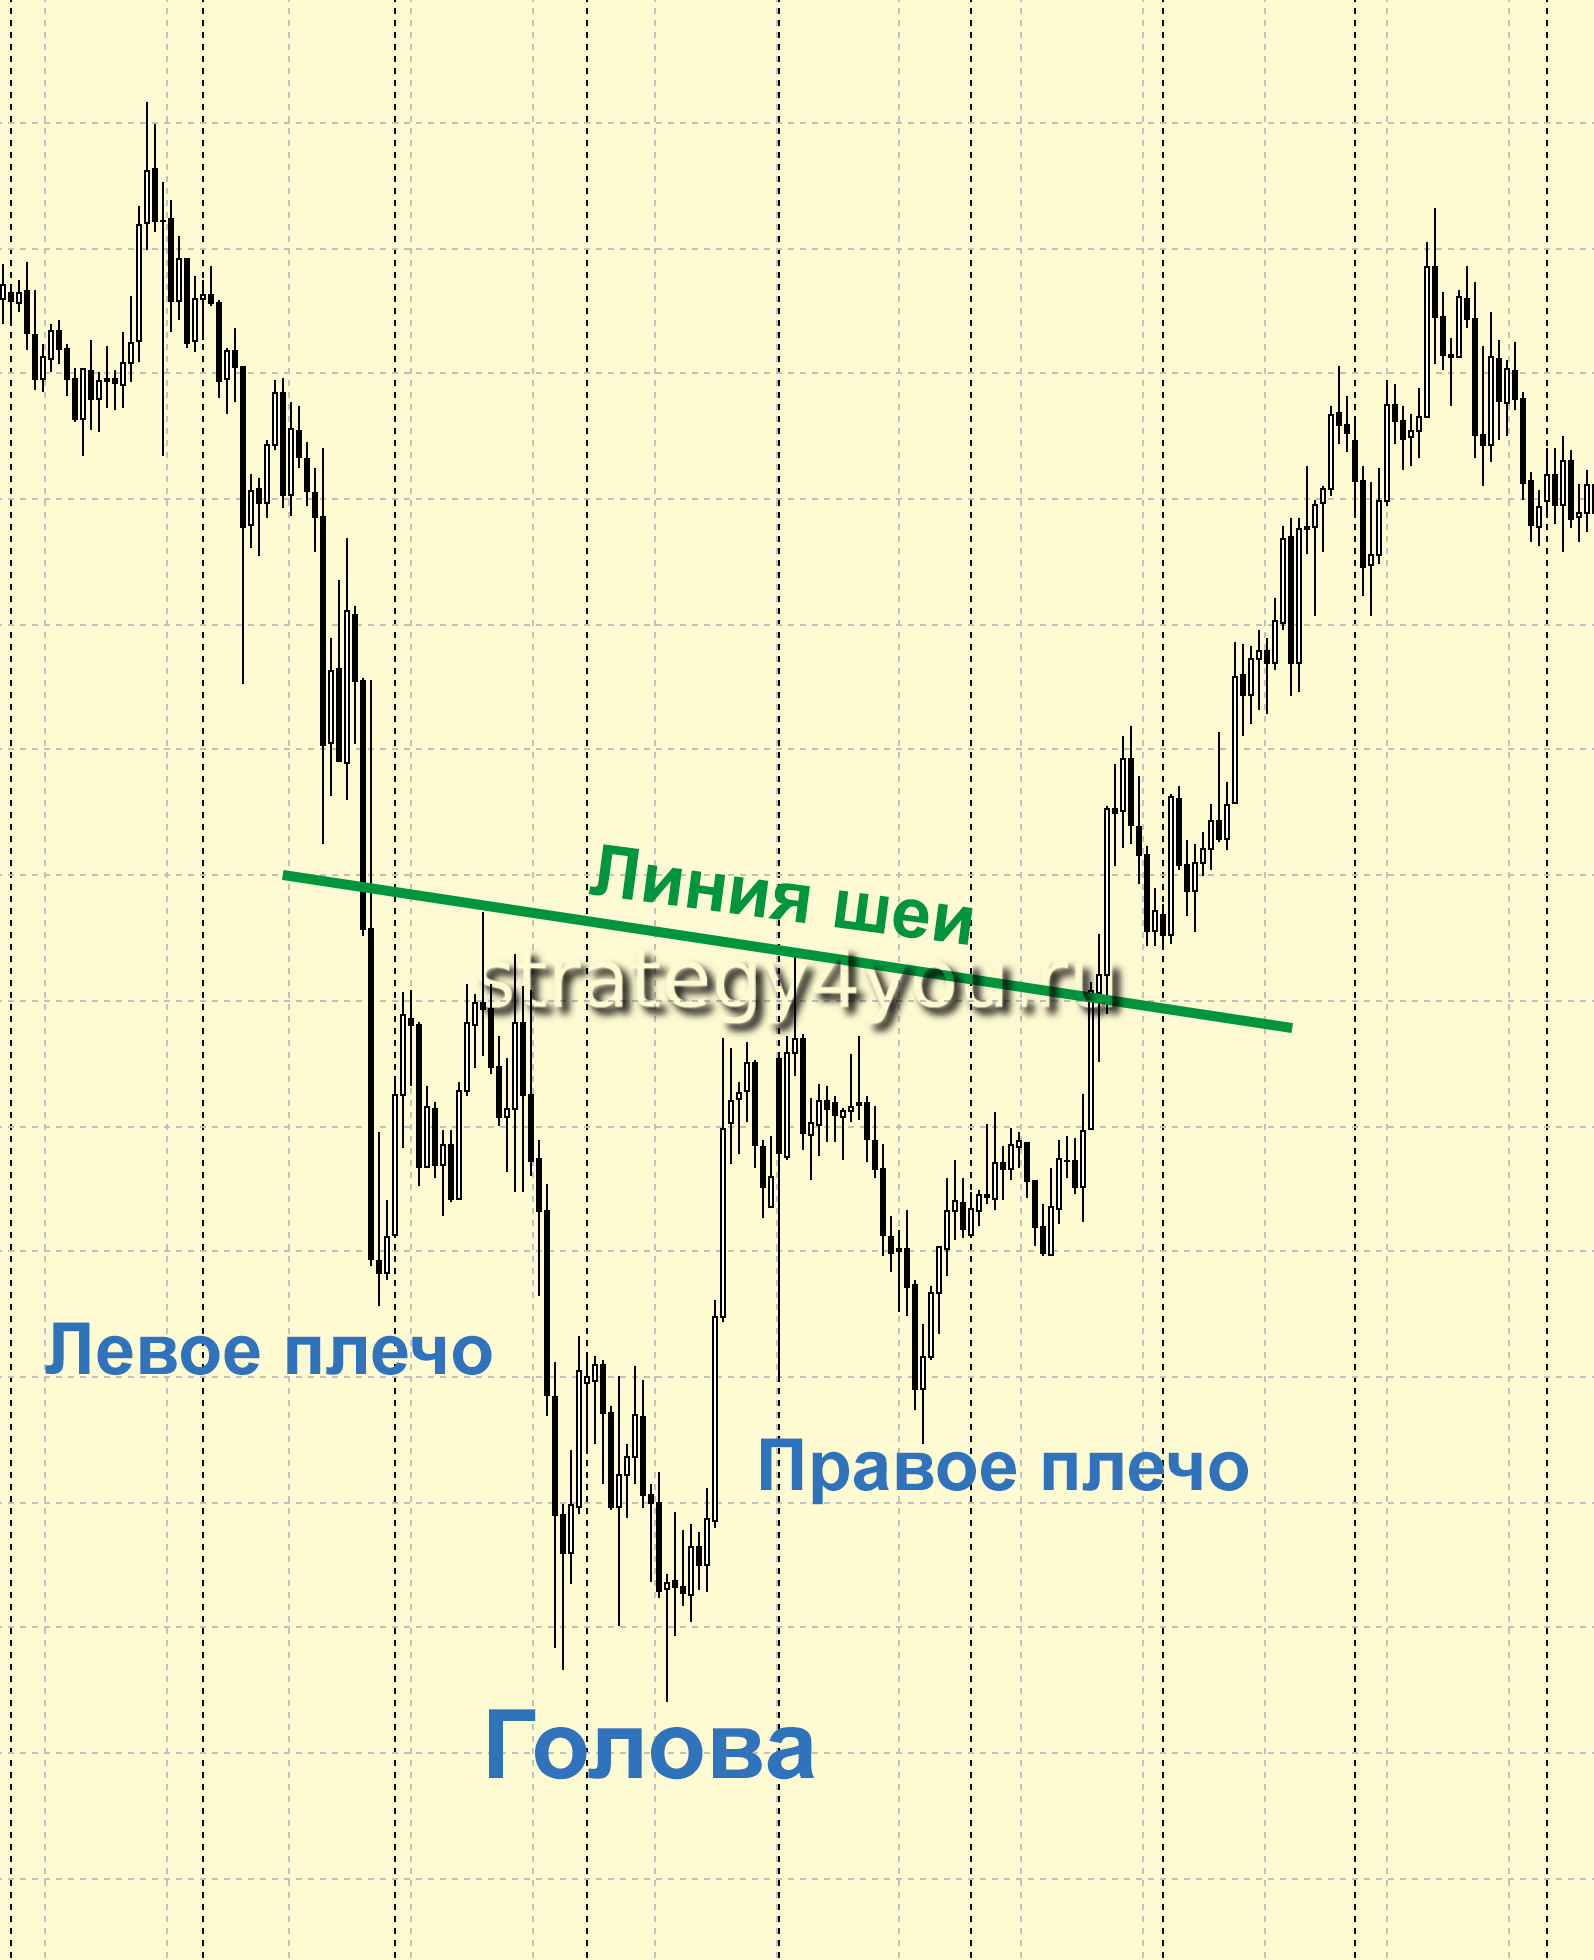
The inverse Head and Shoulders pattern appears in a downtrend and hints at growing demand. Instead of 3 peaks we have 3 troughs, where:
- The deepest trough in the middle is the head.
- The two smaller troughs on the sides are the shoulders.
Open the trade when a candle closes beyond the neckline. Before the breakout the neckline is resistance; after it, it becomes support:
Conclusions
Head and Shoulders works well on forex, but if you also apply technical analysis, your entries will be much more profitable. Either way, this pattern can give you plenty of profitable trades.
I have not yet come across a reliable Head and Shoulders indicator for MetaTrader 4, so I will not post anything like that. The best way to find these formations is the good old method — with your own eyes.
Video strategy: the Head and Shoulders trend reversal pattern: