Contents 16
- What the pattern looks like
- How to trade the pattern on Forex
- False pattern
- Inverted pattern
- Rules: which cup counts as a valid one
- How to trade the Cup and Handle: 3 ways to enter
- A false cup: what the program skips
- How we tested
- Results: 119 trades from 2000 to 2026
- Robustness checks
- Every trade with a chart
- How much to risk per trade
- Common mistakes
- FAQ
- Conclusion
- Other strategies we have backtested
The Cup and Handle is a chart pattern that signals the continuation of an uptrend. Price slowly drifts lower and just as slowly climbs back to the previous high, drawing a cup on the chart. Then it makes a small pullback — the handle — and breaks out to the upside. The pattern was described by William O’Neil, and traders have been looking for it on stocks, forex, gold and crypto ever since.
A lot has been written about the Cup and Handle, but almost nobody answers the main question: does it actually work? We taught a program to find the pattern on the chart using strict rules and tested it on 46 markets from 2000 to 2026. Below: what a proper cup looks like, how to trade it, honest statistics on 119 trades, every trade with a chart, and an Excel journal.
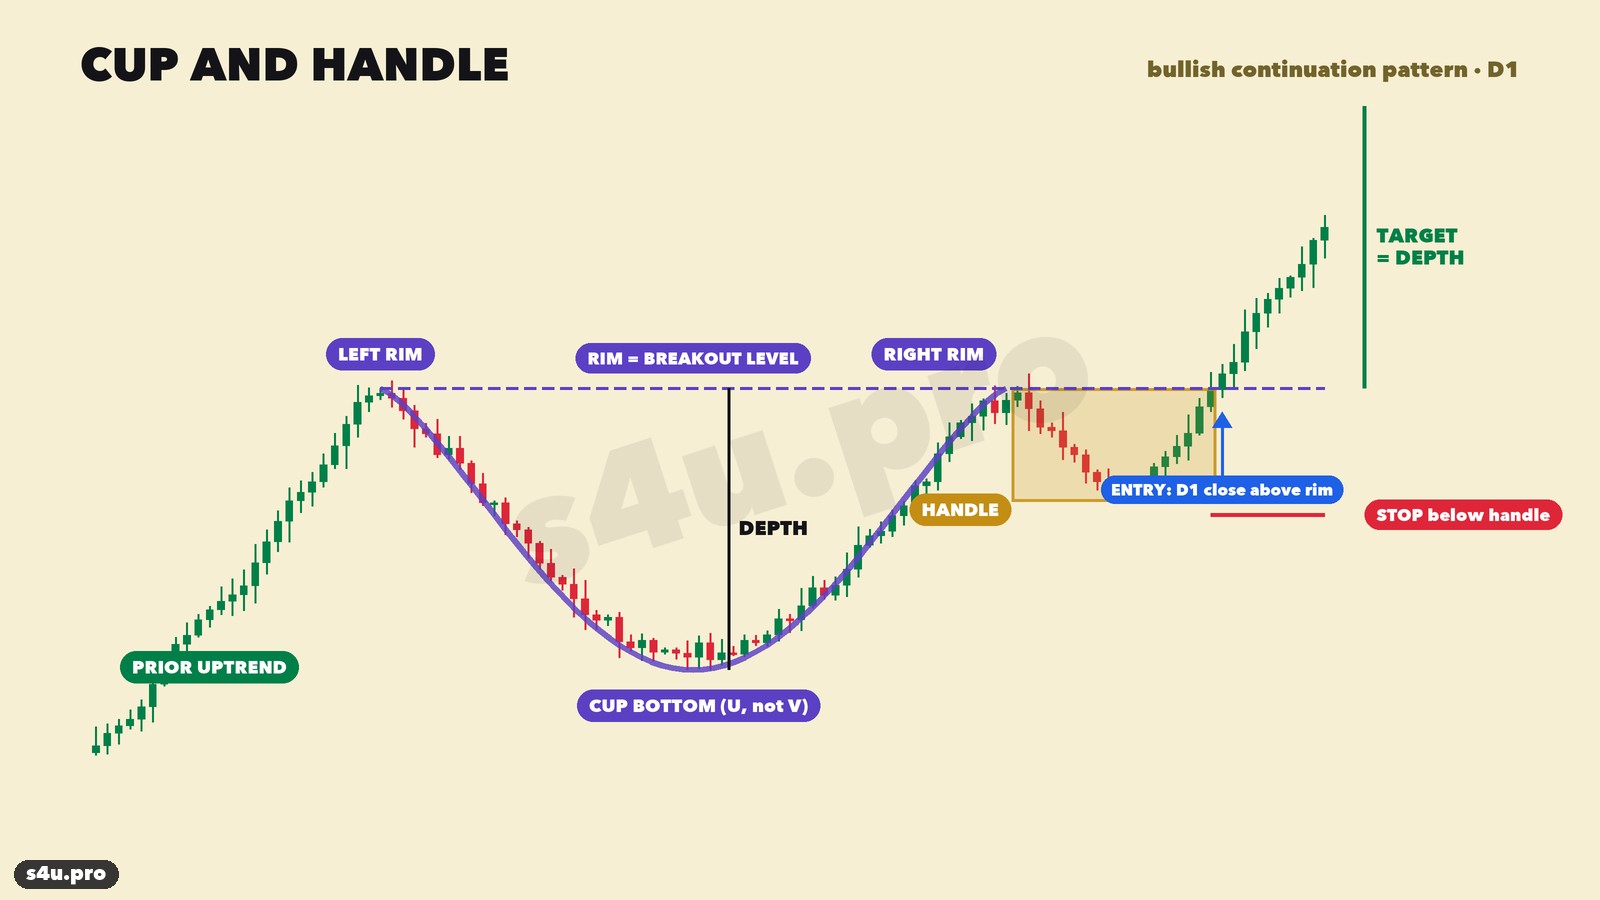
 Chart patterns that signal price changes play an important role in a trader’s work. One of them is the “cup and handle” formation.
What the pattern looks like
The name “cup and handle” was chosen because of the obvious resemblance between this piece of tableware and what a trader sees on the chart. It is hard to say how popular this pattern is among market participants, since there are other formations of greater practical interest.
According to experienced traders who have been in the market for a long time, this formation appears on charts quite rarely.
The cup: formation conditions
The key precondition for this pattern is a bullish trend, even though analysts classify it as a reversal pattern. The cup and handle forms when the previous upward move is being corrected. The trader must pay close attention to how deep the pullback is.

The pattern is worth trading if the pullback does not exceed 80% of the trend that preceded this formation. The bottom of the cup corresponds to a period of price consolidation, after which the price starts to climb.
The handle: formation conditions
On the chart, the handle is nothing more than a price correction relative to the levels reached while the right side of the cup was forming. Analysts compare this section not so much to a handle as to a flag. The most interesting case is when the flag starts forming right after the right side of the cup is complete. The length of the handle should not exceed 50% of the right side of the cup.

This part of the chart takes quite a long time to form. A long time span points to a trend that follows. The section is only complete once the resistance level is broken.
In practical terms, this is what we see on the chart: as the left side of the cup is drawn, prices gradually decline; while the bottom forms, they stay steadily low; and while the right side forms, they gradually rise. At the moment of the breakout, the number of trades rises sharply.
How to trade the pattern on Forex
You can trade the cup and handle using one of the following approaches:

- aggressive;
- conservative;
- standard.
Each of them has its pros and cons. The pattern is rarely used among Forex methods because it requires taking many factors into account at once; otherwise the risk of a mistake is very high. Particular difficulties can arise when analysing the depth and width of the shape drawn by the chart. The chance of missing a profitable move with this pattern is quite high.
Aggressive entry
This is considered the riskiest approach. It is based on the behaviour of the handle. Orders should be placed after the handle is broken — in other words, after the breakout of the flag. The stop is set below the level of the breakout candle.

Standard entry
With the standard approach, positions are opened right after the breakout of the pattern line. The stop loss should be below the handle, i.e. below the line that forms resistance.

Conservative entry
This is the most commonly used approach. It follows classic trading tradition and focuses on the breakout of the technical line. The ideal option is to enter after a retest of the breakout line. The stop loss should be below the handle or below the candle that bounced off the breakout line (at least if that candle is large enough).

False pattern
Not every pattern that forms is genuine. A trader must know the signs of a false cup well. There are several of them:
- A genuine cup and handle must always be preceded by an uptrend.
- The reliability of the pattern is checked against the timeframe. The higher it is (H4, D1, W1), the more likely the cup is genuine.

- The next criterion is the breakout. Very often it turns out to be a false breakout, which means prices are heading back. This part of the chart should sit slightly below the high that marks the end of the right side of the cup — roughly 5–15% lower.
- It also matters how
. Experts believe that for a “correct” shape you can calculate the arithmetic mean between the high of the left side and the low of the bottom. The arithmetic mean between the low and the high of the handle is calculated the same way. When you compare the two, the value for the handle will be greater than the value for the cup.correctly the outline of the cup was formed
- To confirm the pattern, traders use a moving average with a period of 200. It must always stay below the handle.


Inverted pattern
Logically, if the cup and handle exists, the chart can also form an inverted version of it. In this case it would be a “bearish pattern”. However, William O’Neil, who created the method, never mentions such a setup. So the theory has not been confirmed in practice: there are no accounts of how the inverted cup and handle has been used.

Debates about whether to use this pattern started fairly recently, although the possibility itself was noticed and worked out several years ago. Since the setup is extremely rare, not everyone gets the chance to try it and test how effective this trading method is.
Rules: which cup counts as a valid one
You can «see» a cup almost anywhere. That is why we wrote the rules down in numbers — the program finds the pattern using them, and any trader can check a pattern with the same rules:
- Cup width — from 10 to 200 daily candles (from two weeks to about 9 months).
- Depth — from 3 to 15 average daily ranges (ATR 14). A cup that is too shallow is noise; one that is too deep is no longer a pause but a reversal.
- Trend before the cup: the rise before the left rim is at least as large as the depth of the cup. The classic rule says «depth no more than 80% of the trend» — we tested both versions, more on that below.
- U shape: the bottom is in the middle part of the cup (between 20% and 80% of its width), and price spent noticeable time near the bottom — at least 15% of the cup’s candles in its lower third.
- Rims at one level: the right rim differs from the left one by no more than 15% of the cup depth. Inside the cup price does not rise above the rims.
- Handle: from 3 candles to a quarter of the cup width, the pullback no deeper than half the cup.
- MA200 filter: the 200-period moving average runs below the handle — the market is in an uptrend.
How to trade the Cup and Handle: 3 ways to enter
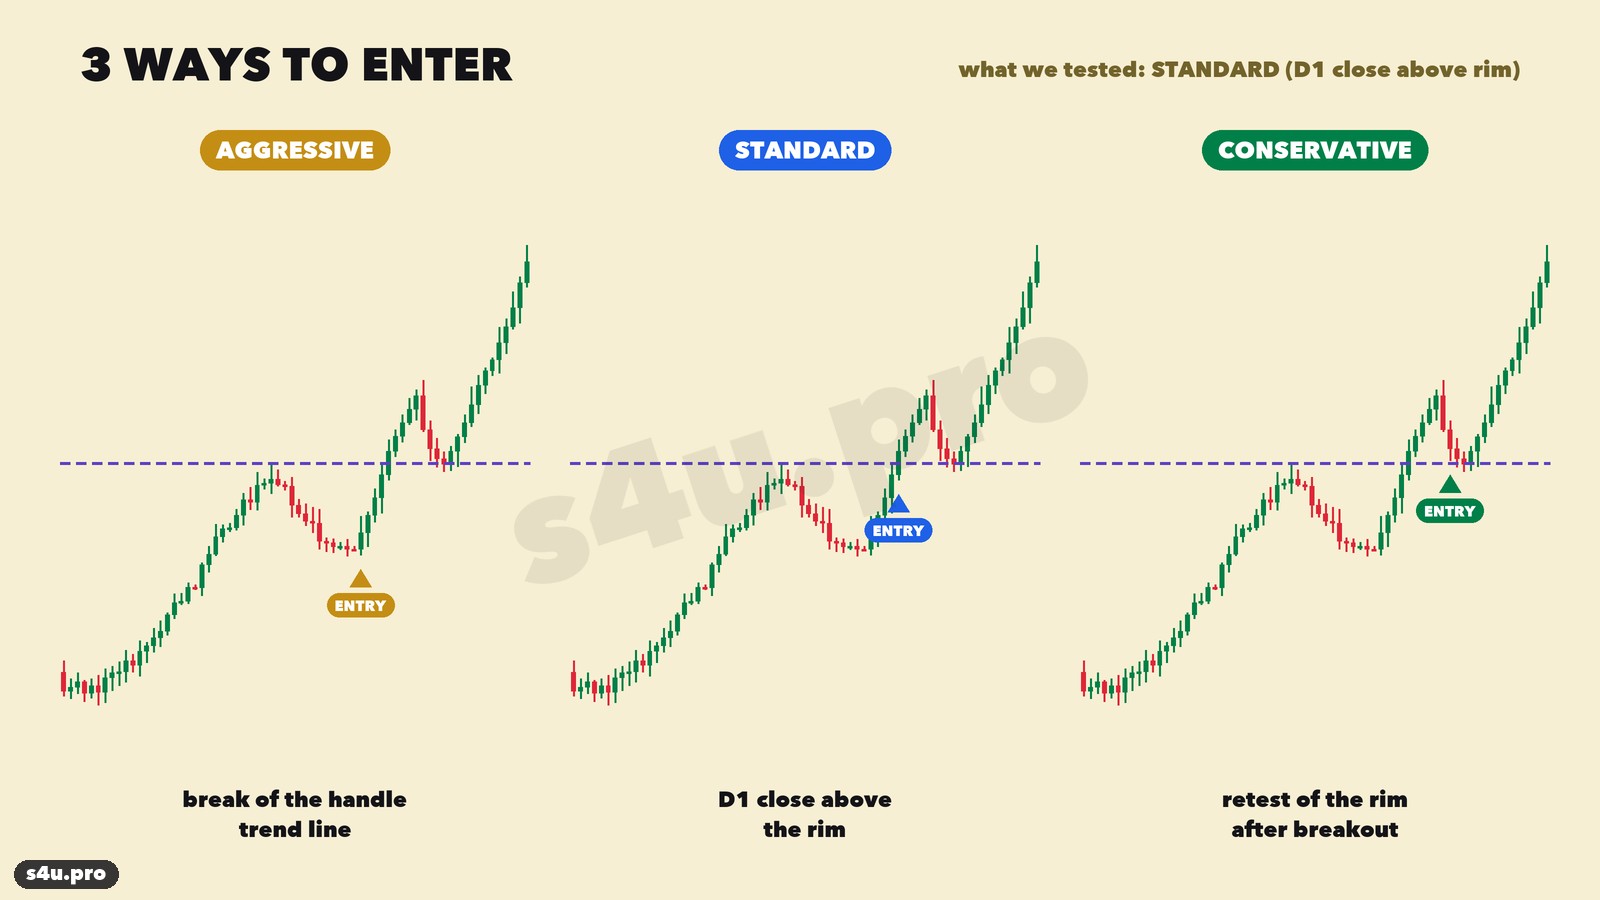
- Aggressive — buy on the break of the handle’s trend line, before the rims are broken. Earlier entry and a shorter stop, but more false signals.
- Standard — buy after a breakout of the rim level. This is the version we tested, in its strictest form: we wait for the daily candle to close above the level and buy at the next day’s open. A breakout by a wick alone does not count.
- Conservative — buy on the return to the broken level (retest). The price can be better, but some strong moves leave without a retest.
Stop loss — below the low of the handle (we add a small buffer of 0.1 ATR). Take profit — the classic target of the pattern: the depth of the cup measured up from the entry.
Why enter on the close rather than on a touch of the level? We tested both. Entering on the close gives fewer trades but a clearly better result: some wick breakouts turn out to be false, and the daily close filters them out.
A false cup: what the program skips
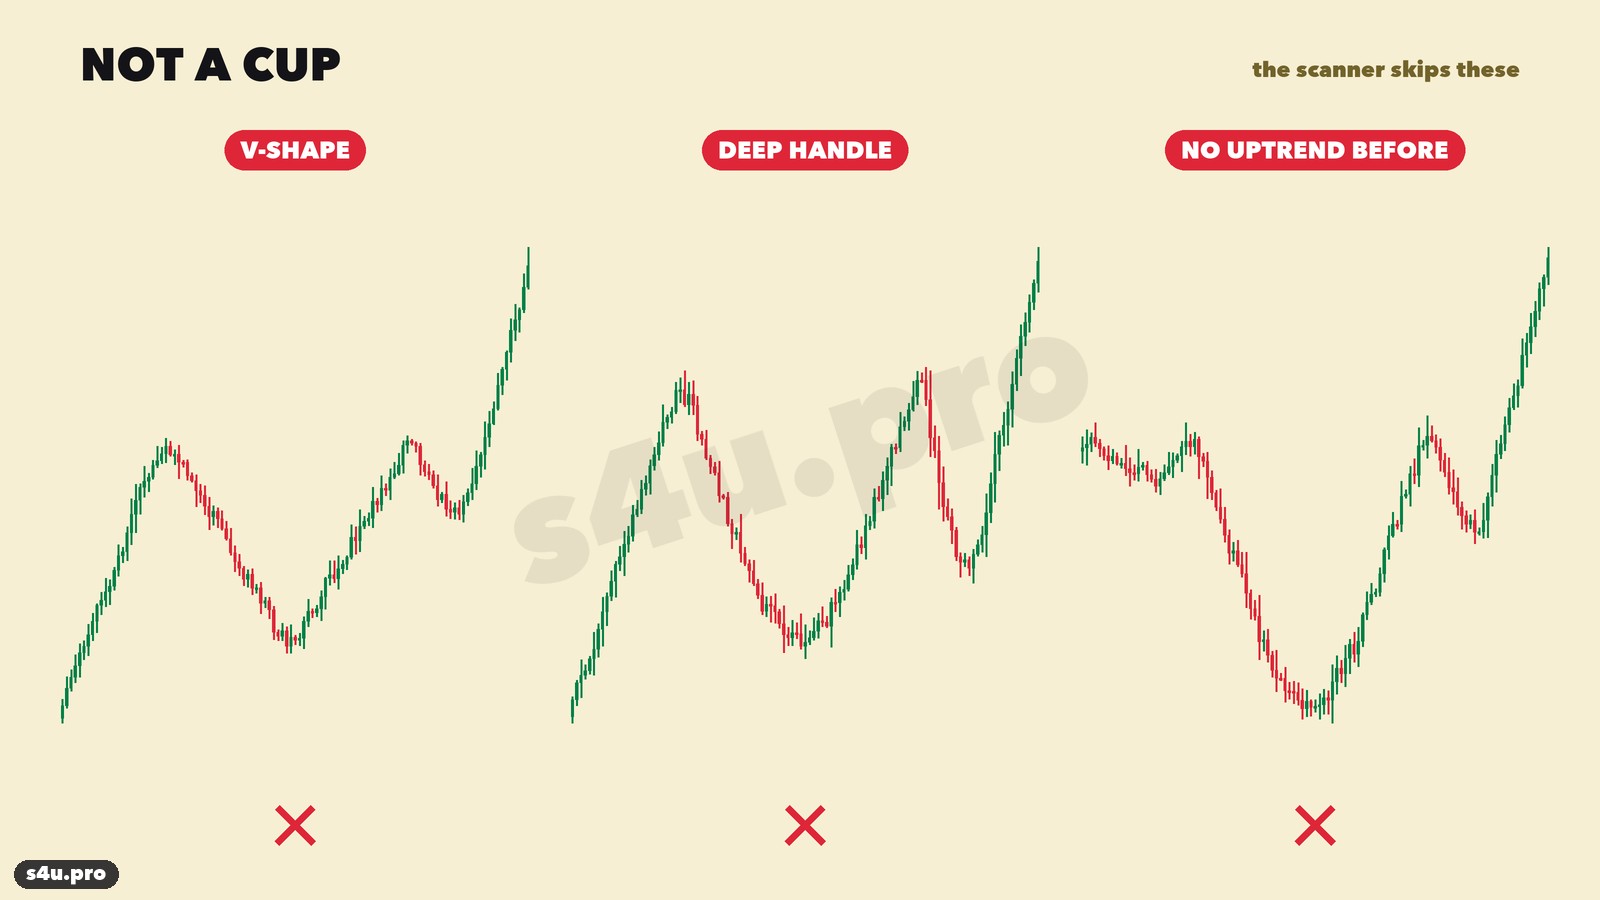
- V-shaped bottom. A sharp drop and an equally sharp rebound is not a pause in a trend but a nervous market. Breakouts after such a «cup» often fail.
- Deep handle. If the pullback after the right rim goes below the middle of the cup, buyers have not coped — the pattern is broken.
- No trend before the pattern. A cup in a range is just a swing inside the range.
- Price below MA200. The market is in a downtrend — the «cup» is more likely a bounce before the decline continues.
- Inverted cup (the bearish version) — it is drawn in textbooks too, but O’Neil does not have it. We tested it as well: short trades lose money, so it is not part of the strategy.
How we tested
- Markets: 46 instruments — 28 currency pairs, gold and silver, the NASDAQ 100, S&P 500 and DAX indices, Brent oil and 12 cryptocurrencies. Trades were found on 32 of them.
- Data: daily candles built from MetaTrader 4 hourly history (Alpari) since 2000; crypto — Binance since 2018. The latest data is October 2026.
- No look-ahead: at the moment of entry the program knows only past candles. The right rim counts as found only after 3 more candles have closed (like a fractal).
- Spread is included in every trade. If a single candle touched both the stop and the target, we count the stop.
- Results in R: 1R is the risk of a trade (the distance from entry to stop). For example, with 1% risk per trade, +1R = +1% of the account.
Results: 119 trades from 2000 to 2026
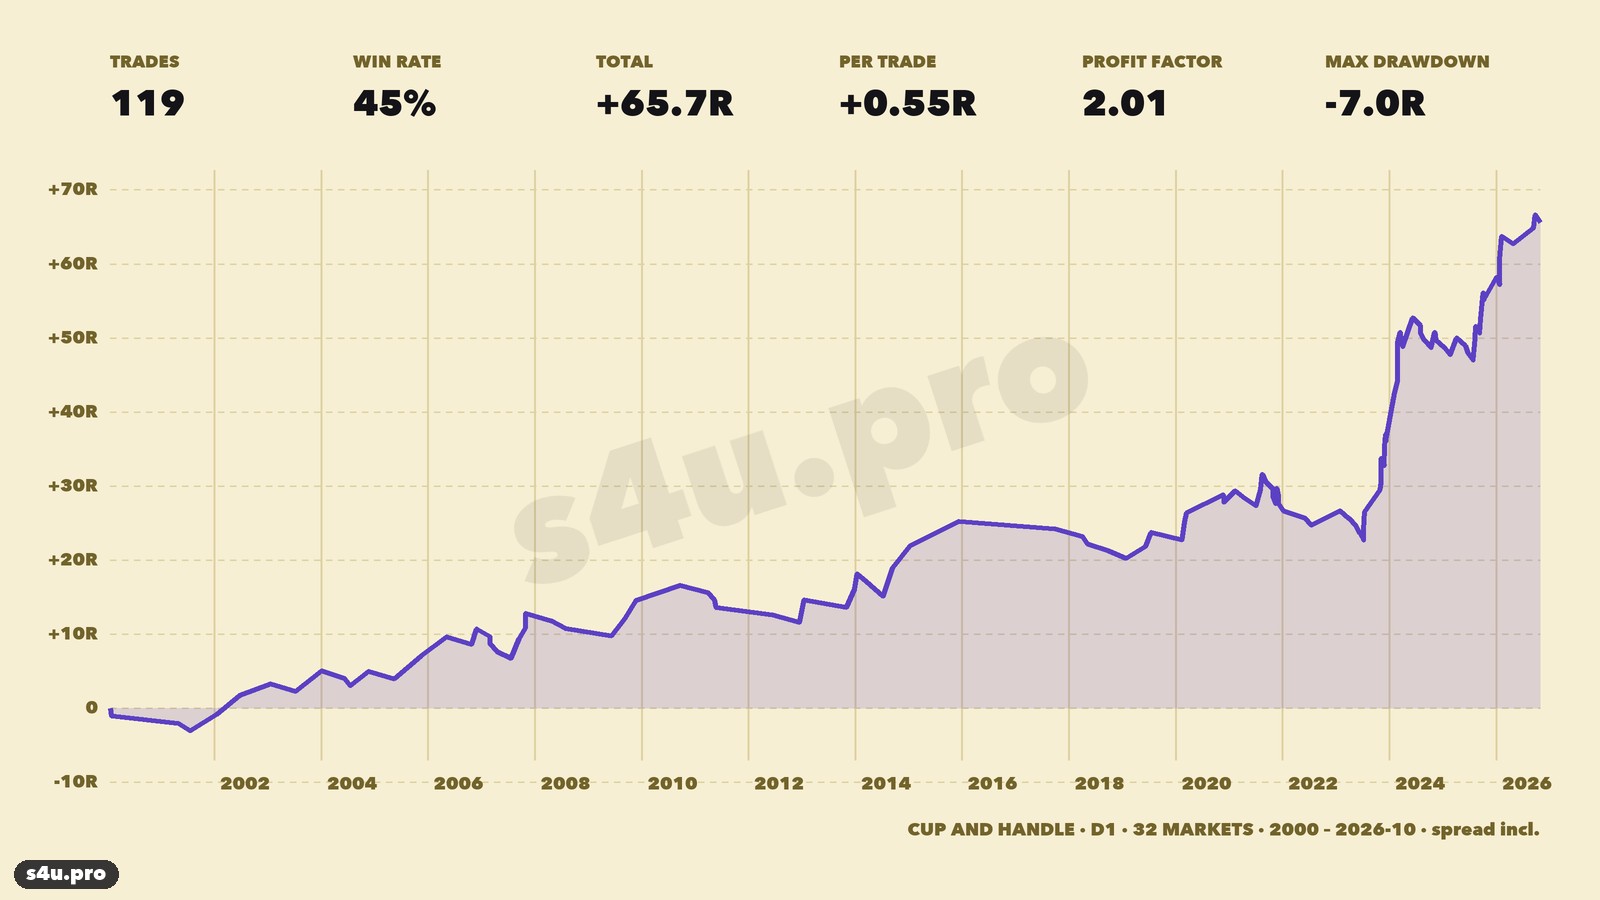
The curve grows in steps: the pattern is rare, but an average winner makes 2.4 times more than a loser costs. That is why the strategy is profitable even with 45% winning trades.
- Total trades: 119, winners: 45%.
- Result: +65.7R, on average +0.55R per trade.
- Profit factor: 2.01 — profits are 2.01 times larger than losses.
- Maximum drawdown: -7.0R, the longest losing streak — 7 trades in a row.
- Average trade length — 39 days. This is a strategy for those who are ready to hold a position for weeks.
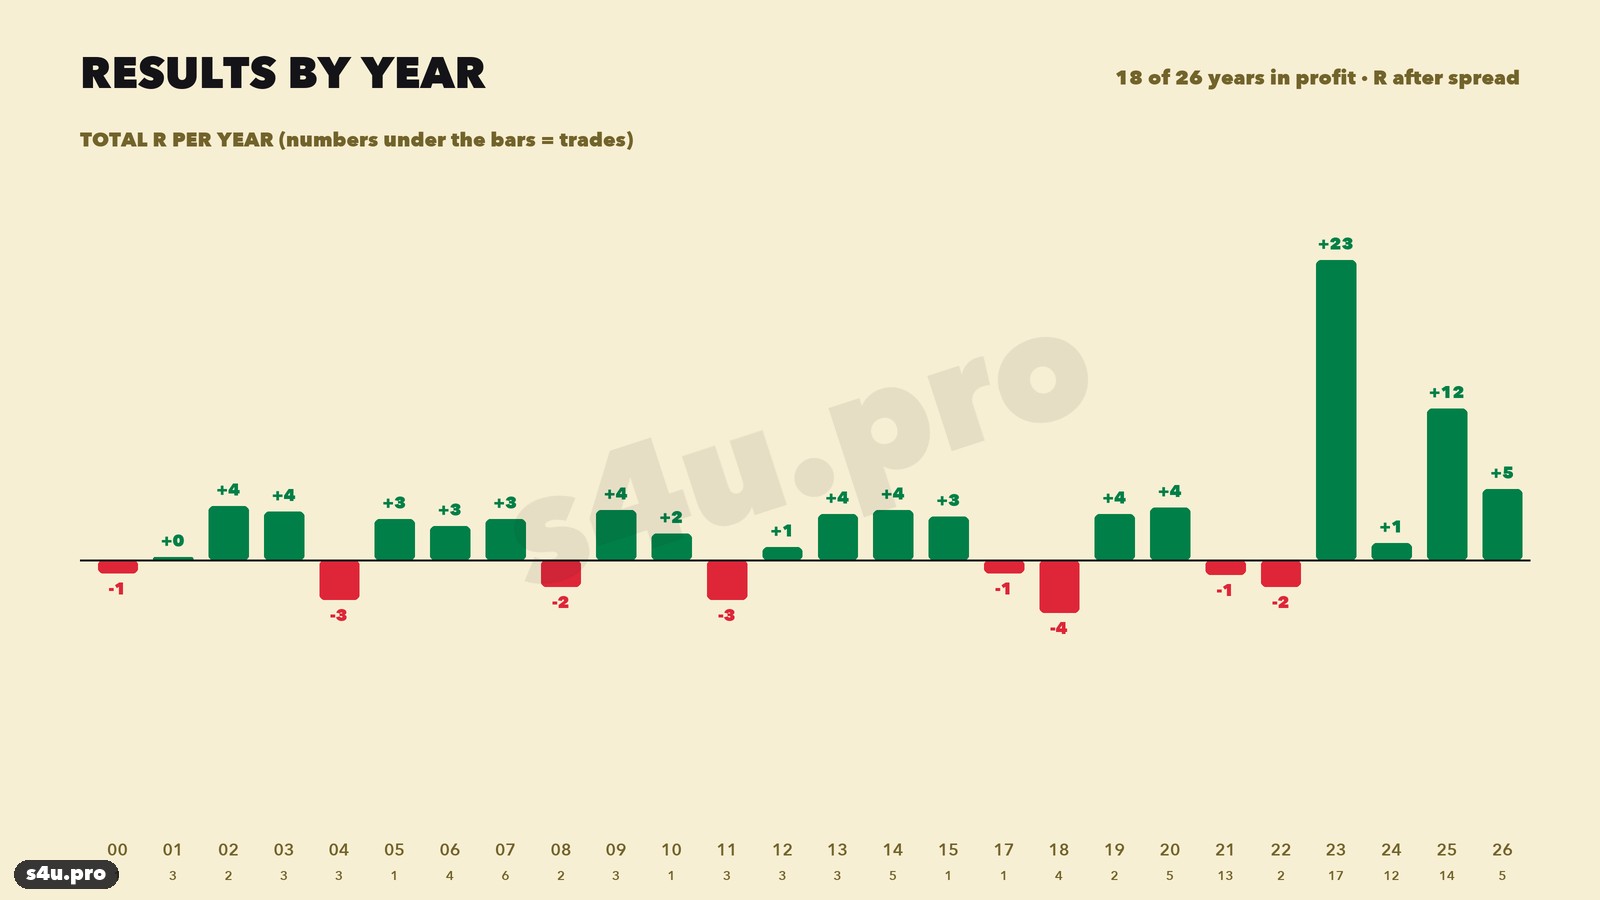
18 of 26 years were profitable. The losing years are small — from −1R to −4R. The best year was 2023 (+22.8R): after the 2022 decline, strong cups appeared in crypto (+11.9R) and indices (+12.2R). 2025 — +11.5R, 2026 (through June) — +5.4R.
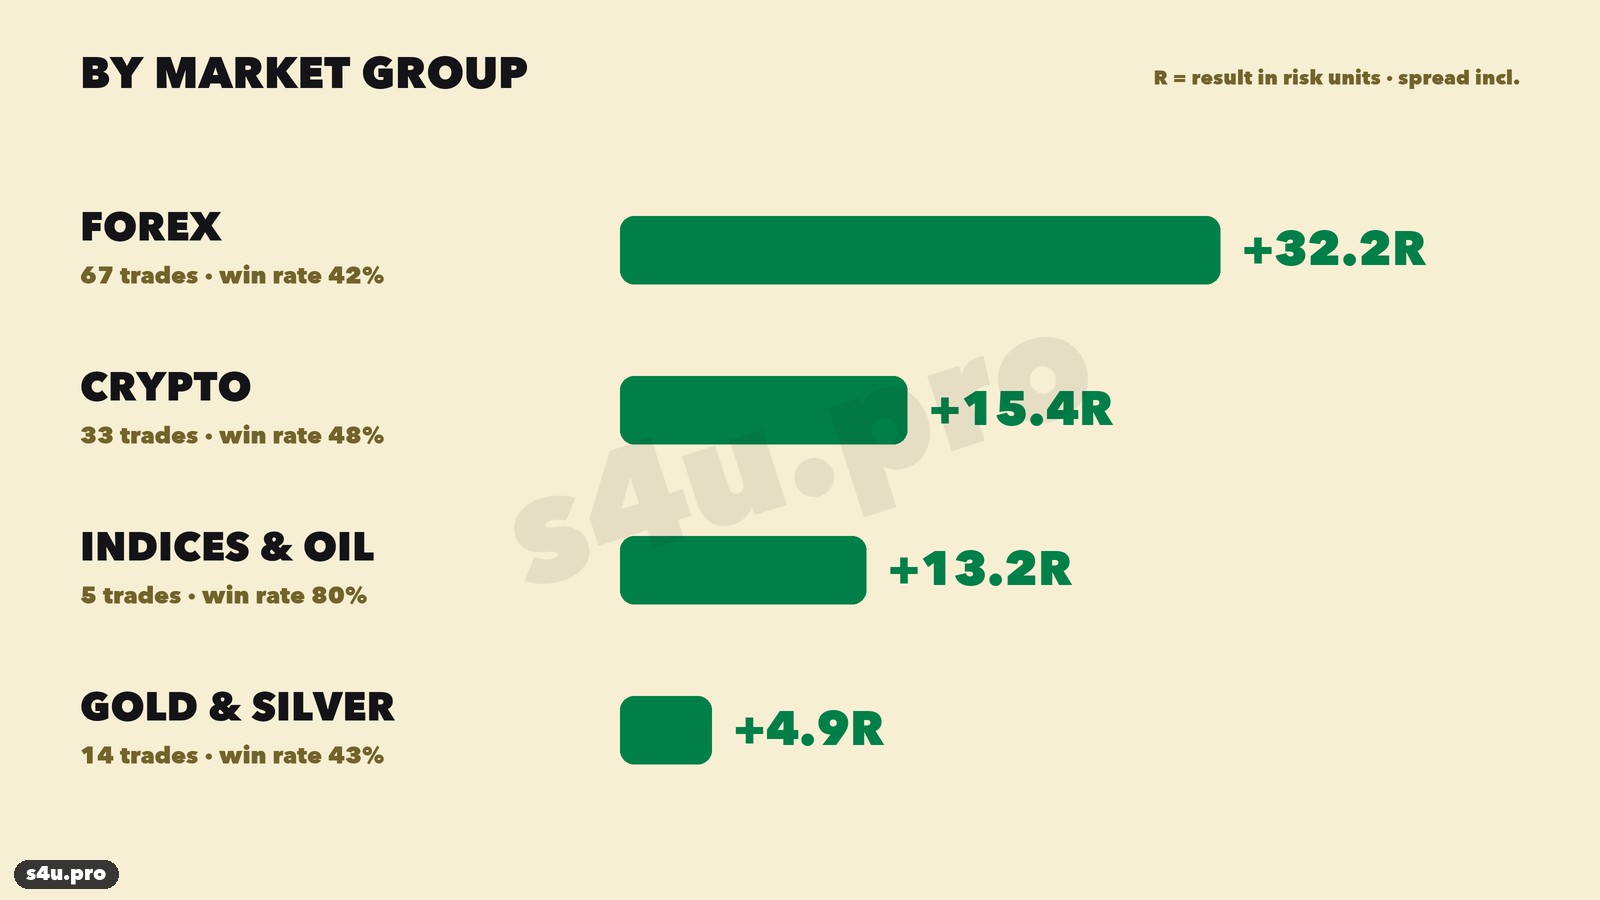
The pattern works in every market group. Most trades and most profit came from currency pairs (+32.2R). Crypto (+15.4R) and indices also do well: there are only 5 index trades, but 4 of them reached the target. Gold and silver — +4.9R.
Robustness checks
To make sure the result is not an accidental curve fit, we ran three checks:
- Neighbouring settings. We changed one rule at a time: cup width, handle length, rim tolerance, depth, trend, MA200, stop buffer, target. All 15 variants stayed profitable, with a profit factor from 1.5 to 2.1. The classic rule «cup depth no more than 80% of the trend» is also profitable: 77 trades, +44.9R, profit factor 2.05 — but there are fewer trades and 2026 is around zero (−0.3R). That is why the final rules use «depth no more than 100% of the trend».
- Two halves of history. 2000–2012 — +14.7R, 2013–2026 — +51R. The pattern worked before and works now.
- Random entries. 200 times we bought on random days of an uptrend (price above MA200) with the same stops and targets. On average that gives +32.5R — so part of the profit comes from the rising market itself. But the Cup and Handle beat 96% of the random runs: the pattern itself adds noticeable profit on top.
What did not work: on the 4-hour chart (H4) the pattern is also profitable over the long history, but weaker and less stable — 2026 is negative there. That is why we recommend trading it on the daily chart.
Every trade with a chart
Below are all 119 trades. Click any of them to open the chart: it shows the rims, the bottom, the handle, the breakout level, the entry, the stop and the target.
| # | Market | Opened | Entry | Stop | Target | Closed | Result | Price, % | R | Chart |
|---|---|---|---|---|---|---|---|---|---|---|
| 119 | USDCHF | 18.06.2026 | 0.80518 | 0.79038 | 0.83094 | 27.09.2026 | TP | +3.2% | +1.74R | |
| 118 | AUDJPY | 27.04.2026 | 114.530 | 112.934 | 119.705 | 29.04.2026 | SL | -1.4% | -1.00R | |
| 117 | TRXUSD | 15.04.2026 | 0.32751 | 0.30275 | 0.38451 | 30.10.2026 | SL | -7.6% | -1.00R | |
| 116 | AUDCHF | 11.02.2026 | 0.54950 | 0.53242 | 0.58694 | 16.09.2026 | TP | +6.8% | +2.19R | |
| 115 | AUDUSD | 06.01.2026 | 0.67386 | 0.66553 | 0.70240 | 27.01.2026 | TP | +4.2% | +3.43R | |
| 114 | USDJPY | 17.11.2025 | 155.245 | 152.710 | 170.152 | 26.01.2026 | SL | -1.6% | -1.00R | |
| 113 | LTCUSD | 09.10.2025 | 125.955 | 114.651 | 150.475 | 09.10.2025 | SL | -9.0% | -1.00R | |
| 112 | AUDNZD | 18.09.2025 | 1.12356 | 1.10657 | 1.17629 | 10.02.2026 | TP | +4.7% | +3.10R | |
| 111 | XAGUSD | 31.08.2025 | 39.730 | 38.018 | 43.030 | 18.09.2025 | TP | +8.3% | +1.93R | |
| 110 | BTCUSD | 09.07.2025 | 111311.93 | 106965.25 | 123829.93 | 13.08.2025 | TP | +11.2% | +2.88R | |
| 109 | GBPJPY | 25.06.2025 | 198.126 | 193.606 | 212.01 | 05.01.2026 | TP | +7.0% | +3.07R | |
| 108 | EURUSD | 25.06.2025 | 1.16578 | 1.14371 | 1.21660 | 29.07.2025 | SL | -1.9% | -1.00R | |
| 107 | EURAUD | 23.06.2025 | 1.79232 | 1.76167 | 1.85642 | 10.09.2025 | SL | -1.7% | -1.00R | |
| 106 | EURNZD | 22.06.2025 | 1.92753 | 1.90109 | 1.97294 | 14.08.2025 | TP | +2.4% | +1.72R | |
| 105 | CHFJPY | 15.06.2025 | 177.166 | 173.965 | 188.625 | 05.10.2025 | TP | +6.5% | +3.58R | |
| 104 | TRXUSD | 07.06.2025 | 0.28721 | 0.25977 | 0.36031 | 21.06.2025 | SL | -9.6% | -1.00R | |
| 103 | BTCUSD | 21.05.2025 | 109721.92 | 101114.51 | 141671.36 | 04.06.2025 | SL | -7.8% | -1.00R | |
| 102 | EURNZD | 03.03.2025 | 1.86734 | 1.81608 | 1.98324 | 06.04.2025 | TP | +6.2% | +2.26R | |
| 101 | NAS100 | 13.02.2025 | 22014.60 | 21378.63 | 23325.60 | 23.02.2025 | SL | -2.9% | -1.00R | |
| 100 | GBPAUD | 18.12.2024 | 2.020 | 1.97830 | 2.111 | 12.01.2025 | SL | -2.1% | -1.00R | |
| 099 | DOGEUSD | 28.10.2024 | 0.16153 | 0.12699 | 0.23199 | 09.11.2024 | TP | +43.6% | +2.04R | |
| 098 | XAGUSD | 20.10.2024 | 33.881 | 30.018 | 39.714 | 13.11.2024 | SL | -11.4% | -1.00R | |
| 097 | EURUSD | 19.08.2024 | 1.10866 | 1.08757 | 1.14668 | 15.10.2024 | SL | -1.9% | -1.00R | |
| 096 | EURCAD | 04.08.2024 | 1.51434 | 1.48893 | 1.57268 | 29.08.2024 | SL | -1.7% | -1.00R | |
| 095 | AUDCAD | 15.05.2024 | 0.91042 | 0.90001 | 0.94418 | 30.07.2024 | SL | -1.1% | -1.00R | |
| 094 | USDJPY | 10.04.2024 | 153.066 | 150.697 | 164.726 | 30.07.2024 | SL | -1.6% | -1.00R | |
| 093 | AVAXUSD | 11.03.2024 | 49.099 | 37.569 | 65.299 | 17.03.2024 | TP | +33.0% | +1.41R | |
| 092 | XRPUSD | 11.03.2024 | 0.72425 | 0.57109 | 0.93895 | 19.03.2024 | SL | -21.1% | -1.00R | |
| 091 | ADAUSD | 01.03.2024 | 0.71979 | 0.56464 | 0.88949 | 02.04.2024 | SL | -21.6% | -1.00R | |
| 090 | GBPJPY | 22.02.2024 | 190.502 | 187.869 | 200.82 | 11.06.2024 | TP | +5.4% | +3.92R | |
| 089 | GER40 | 15.02.2024 | 17119.10 | 16773.22 | 17783.70 | 29.02.2024 | TP | +3.9% | +1.92R | |
| 088 | NAS100 | 11.12.2023 | 16250.00 | 15675.70 | 18143.40 | 29.02.2024 | TP | +11.7% | +3.30R | |
| 087 | LINKUSD | 08.12.2023 | 16.937 | 14.564 | 20.684 | 10.12.2023 | SL | -14.0% | -1.00R | |
| 086 | ADAUSD | 05.12.2023 | 0.42599 | 0.33765 | 0.56859 | 07.12.2023 | TP | +33.5% | +1.61R | |
| 085 | US500 | 03.12.2023 | 4598.20 | 4533.72 | 5024.10 | 08.02.2024 | TP | +9.3% | +6.61R | |
| 084 | XAUUSD | 27.11.2023 | 2013.85 | 1984.47 | 2091.66 | 03.12.2023 | TP | +3.9% | +2.65R | |
| 083 | DOGEUSD | 17.11.2023 | 0.08650 | 0.06836 | 0.11470 | 27.02.2024 | TP | +32.6% | +1.55R | |
| 082 | SOLUSD | 30.10.2023 | 35.034 | 30.513 | 49.834 | 09.11.2023 | TP | +42.2% | +3.27R | |
| 081 | USDCAD | 26.10.2023 | 1.38262 | 1.35613 | 1.45379 | 27.11.2023 | SL | -1.9% | -1.00R | |
| 080 | BTCUSD | 23.10.2023 | 33147.92 | 27996.82 | 37942.24 | 08.11.2023 | TP | +14.5% | +0.93R | |
| 079 | TRXUSD | 28.09.2023 | 0.08705 | 0.08257 | 0.10062 | 31.10.2023 | TP | +15.6% | +3.03R | |
| 078 | USDJPY | 22.06.2023 | 143.076 | 138.301 | 158.115 | 11.07.2023 | SL | -3.3% | -1.00R | |
| 077 | US500 | 18.05.2023 | 4204.00 | 4044.06 | 4575.70 | 18.07.2023 | TP | +8.8% | +2.32R | |
| 076 | EURUSD | 13.04.2023 | 1.10467 | 1.08220 | 1.15636 | 16.05.2023 | SL | -2.0% | -1.00R | |
| 075 | ETHUSD | 04.04.2023 | 1872.64 | 1676.97 | 2588.11 | 13.06.2023 | SL | -10.4% | -1.00R | |
| 074 | XRPUSD | 29.03.2023 | 0.54375 | 0.40399 | 0.75625 | 12.07.2023 | TP | +39.1% | +1.52R | |
| 073 | USDCAD | 07.03.2023 | 1.37480 | 1.35237 | 1.41706 | 29.03.2023 | SL | -1.6% | -1.00R | |
| 072 | LTCUSD | 09.01.2023 | 81.665 | 72.097 | 100.465 | 31.01.2023 | TP | +23.0% | +1.96R | |
| 071 | USDCAD | 14.07.2022 | 1.31185 | 1.29260 | 1.36771 | 17.07.2022 | SL | -1.5% | -1.00R | |
| 070 | USDCAD | 09.05.2022 | 1.30101 | 1.27024 | 1.35714 | 29.05.2022 | SL | -2.4% | -1.00R | |
| 069 | TRXUSD | 15.11.2021 | 0.12411 | 0.10406 | 0.16453 | 17.11.2021 | SL | -16.1% | -1.00R | |
| 068 | SOLUSD | 02.11.2021 | 220.90 | 175.418 | 320.90 | 03.12.2021 | SL | -20.6% | -1.00R | |
| 067 | BNBUSD | 29.10.2021 | 531.01 | 432.51 | 720.91 | 07.01.2022 | SL | -18.6% | -1.00R | |
| 066 | ETHUSD | 20.10.2021 | 4163.63 | 3621.41 | 5539.51 | 03.12.2021 | SL | -13.0% | -1.00R | |
| 065 | BTCUSD | 19.10.2021 | 64358.52 | 58667.84 | 95053.52 | 26.10.2021 | SL | -8.8% | -1.00R | |
| 064 | USDJPY | 10.10.2021 | 112.164 | 110.750 | 115.102 | 22.11.2021 | TP | +2.6% | +2.08R | |
| 063 | ADAUSD | 22.08.2021 | 2.705 | 1.85644 | 4.175 | 26.10.2021 | SL | -31.4% | -1.00R | |
| 062 | BNBUSD | 20.08.2021 | 455.63 | 383.12 | 663.21 | 06.09.2021 | SL | -15.9% | -1.00R | |
| 061 | SOLUSD | 06.08.2021 | 39.596 | 32.040 | 55.596 | 15.08.2021 | TP | +40.4% | +2.12R | |
| 060 | ETHUSD | 30.07.2021 | 2464.03 | 2136.41 | 3167.03 | 06.08.2021 | TP | +28.5% | +2.15R | |
| 059 | USDJPY | 01.07.2021 | 111.528 | 109.653 | 115.016 | 07.07.2021 | SL | -1.7% | -1.00R | |
| 058 | USDJPY | 30.03.2021 | 110.365 | 108.265 | 117.625 | 18.04.2021 | SL | -1.9% | -1.00R | |
| 057 | LINKUSD | 15.01.2021 | 20.752 | 12.299 | 33.576 | 12.02.2021 | TP | +61.8% | +1.52R | |
| 056 | LINKUSD | 21.11.2020 | 15.452 | 11.375 | 21.445 | 25.11.2020 | SL | -26.4% | -1.00R | |
| 055 | LTCUSD | 13.11.2020 | 66.015 | 56.635 | 88.735 | 22.11.2020 | TP | +34.4% | +2.42R | |
| 054 | USDCAD | 09.03.2020 | 1.36879 | 1.33086 | 1.41691 | 16.03.2020 | TP | +3.5% | +1.27R | |
| 053 | TRXUSD | 14.02.2020 | 0.02668 | 0.02010 | 0.03757 | 15.02.2020 | SL | -24.7% | -1.00R | |
| 052 | LINKUSD | 07.02.2020 | 3.318 | 2.656 | 4.879 | 03.03.2020 | TP | +47.0% | +2.36R | |
| 051 | XAUUSD | 19.06.2019 | 1360.64 | 1318.58 | 1441.12 | 17.07.2019 | TP | +5.9% | +1.91R | |
| 050 | LTCUSD | 15.05.2019 | 102.085 | 82.429 | 134.085 | 10.06.2019 | TP | +31.4% | +1.63R | |
| 049 | USDCAD | 20.11.2018 | 1.33056 | 1.31190 | 1.38132 | 29.01.2019 | SL | -1.4% | -1.00R | |
| 048 | USDCAD | 17.06.2018 | 1.31824 | 1.28460 | 1.37803 | 30.09.2018 | SL | -2.5% | -1.00R | |
| 047 | USDCAD | 15.03.2018 | 1.30492 | 1.27925 | 1.37104 | 02.04.2018 | SL | -2.0% | -1.00R | |
| 046 | EURUSD | 14.01.2018 | 1.21939 | 1.19083 | 1.26734 | 06.05.2018 | SL | -2.3% | -1.00R | |
| 045 | XAUUSD | 28.08.2017 | 1310.32 | 1274.35 | 1400.99 | 01.10.2017 | SL | -2.7% | -1.00R | |
| 044 | USDCAD | 15.07.2015 | 1.29128 | 1.26519 | 1.37771 | 13.12.2015 | TP | +6.7% | +3.31R | |
| 043 | USDCAD | 14.10.2014 | 1.12969 | 1.10722 | 1.19556 | 11.01.2015 | TP | +5.8% | +2.93R | |
| 042 | USDJPY | 01.09.2014 | 104.355 | 103.499 | 107.654 | 16.09.2014 | TP | +3.2% | +3.85R | |
| 041 | XAUUSD | 10.07.2014 | 1335.67 | 1308.35 | 1426.16 | 13.07.2014 | SL | -2.0% | -1.00R | |
| 040 | GBPUSD | 30.04.2014 | 1.68730 | 1.67550 | 1.72299 | 13.05.2014 | SL | -0.7% | -1.00R | |
| 039 | XAUUSD | 12.03.2014 | 1367.03 | 1326.30 | 1545.08 | 19.03.2014 | SL | -3.0% | -1.00R | |
| 038 | USDCAD | 27.11.2013 | 1.05953 | 1.04094 | 1.09809 | 14.01.2014 | TP | +3.6% | +2.07R | |
| 037 | USDJPY | 21.11.2013 | 101.164 | 99.492 | 105.195 | 29.12.2013 | TP | +4.0% | +2.41R | |
| 036 | EURUSD | 03.10.2013 | 1.36193 | 1.34538 | 1.43917 | 03.11.2013 | SL | -1.2% | -1.00R | |
| 035 | USDJPY | 13.12.2012 | 83.655 | 81.623 | 89.812 | 16.01.2013 | TP | +7.4% | +3.03R | |
| 034 | XAUUSD | 02.09.2012 | 1690.92 | 1649.22 | 1843.89 | 19.12.2012 | SL | -2.5% | -1.00R | |
| 033 | USDCAD | 31.05.2012 | 1.03281 | 1.01983 | 1.08115 | 17.06.2012 | SL | -1.3% | -1.00R | |
| 032 | GBPUSD | 21.04.2011 | 1.65137 | 1.61536 | 1.74678 | 12.05.2011 | SL | -2.2% | -1.00R | |
| 031 | EURUSD | 06.04.2011 | 1.43320 | 1.40079 | 1.57395 | 22.05.2011 | SL | -2.3% | -1.00R | |
| 030 | GBPUSD | 22.03.2011 | 1.63724 | 1.59634 | 1.73265 | 27.03.2011 | SL | -2.5% | -1.00R | |
| 029 | XAUUSD | 02.05.2010 | 1179.80 | 1122.33 | 1296.97 | 23.09.2010 | TP | +9.9% | +2.04R | |
| 028 | XAUUSD | 06.10.2009 | 1041.85 | 983.42 | 1183.21 | 24.11.2009 | TP | +13.6% | +2.42R | |
| 027 | XAUUSD | 31.05.2009 | 979.04 | 939.69 | 1081.20 | 11.06.2009 | SL | -4.0% | -1.00R | |
| 026 | EURUSD | 20.05.2009 | 1.37645 | 1.34049 | 1.46177 | 10.09.2009 | TP | +6.2% | +2.37R | |
| 025 | XAUUSD | 13.07.2008 | 966.15 | 910.41 | 1043.95 | 29.07.2008 | SL | -5.8% | -1.00R | |
| 024 | EURUSD | 16.04.2008 | 1.59445 | 1.56546 | 1.65045 | 23.04.2008 | SL | -1.8% | -1.00R | |
| 023 | USDJPY | 13.06.2007 | 122.625 | 120.702 | 129.545 | 23.07.2007 | SL | -1.6% | -1.00R | |
| 022 | GBPUSD | 17.04.2007 | 2.008 | 1.95794 | 2.081 | 30.10.2007 | TP | +3.6% | +1.46R | |
| 021 | XAUUSD | 16.04.2007 | 690.25 | 630.97 | 807.05 | 01.11.2007 | TP | +16.9% | +1.97R | |
| 020 | EURUSD | 05.04.2007 | 1.34325 | 1.32452 | 1.39305 | 17.09.2007 | TP | +3.7% | +2.66R | |
| 019 | XAUUSD | 01.02.2007 | 656.55 | 639.63 | 704.65 | 01.03.2007 | SL | -2.6% | -1.00R | |
| 018 | USDJPY | 11.01.2007 | 120.435 | 117.894 | 125.885 | 26.02.2007 | SL | -2.1% | -1.00R | |
| 017 | USDCAD | 12.12.2006 | 1.15265 | 1.12784 | 1.19535 | 17.04.2007 | SL | -2.1% | -1.00R | |
| 016 | EURUSD | 22.11.2006 | 1.29435 | 1.27537 | 1.33385 | 30.11.2006 | TP | +3.0% | +2.08R | |
| 015 | USDJPY | 08.10.2006 | 119.015 | 117.302 | 122.925 | 26.10.2006 | SL | -1.4% | -1.00R | |
| 014 | GBPUSD | 27.04.2006 | 1.80135 | 1.77349 | 1.87185 | 09.05.2006 | TP | +3.9% | +2.53R | |
| 013 | USDJPY | 11.10.2005 | 114.525 | 112.929 | 119.485 | 15.11.2005 | TP | +4.3% | +3.11R | |
| 012 | GBPUSD | 24.11.2004 | 1.88205 | 1.83616 | 1.98815 | 15.05.2005 | SL | -2.4% | -1.00R | |
| 011 | GBPUSD | 18.07.2004 | 1.87435 | 1.84591 | 1.98055 | 20.07.2004 | SL | -1.5% | -1.00R | |
| 010 | USDCAD | 28.04.2004 | 1.37505 | 1.34542 | 1.43305 | 06.06.2004 | SL | -2.1% | -1.00R | |
| 009 | EURUSD | 18.11.2003 | 1.19695 | 1.13626 | 1.31395 | 23.11.2004 | TP | +9.8% | +1.93R | |
| 008 | GBPUSD | 22.10.2003 | 1.69295 | 1.65180 | 1.80665 | 04.01.2004 | TP | +6.7% | +2.76R | |
| 007 | GBPUSD | 05.06.2003 | 1.66045 | 1.62164 | 1.77175 | 13.07.2003 | SL | -2.3% | -1.00R | |
| 006 | EURUSD | 15.12.2002 | 1.02315 | 0.98512 | 1.08335 | 23.01.2003 | TP | +5.9% | +1.58R | |
| 005 | EURUSD | 19.05.2002 | 0.92075 | 0.89870 | 0.97665 | 23.06.2002 | TP | +6.1% | +2.53R | |
| 004 | USDCAD | 04.09.2001 | 1.55875 | 1.53648 | 1.60815 | 16.01.2002 | TP | +3.2% | +2.22R | |
| 003 | USDJPY | 05.07.2001 | 125.725 | 123.137 | 131.785 | 19.07.2001 | SL | -2.1% | -1.00R | |
| 002 | USDCAD | 14.03.2001 | 1.55685 | 1.53568 | 1.62155 | 29.04.2001 | SL | -1.4% | -1.00R | |
| 001 | GBPUSD | 20.01.2000 | 1.65435 | 1.62867 | 1.71515 | 27.01.2000 | SL | -1.6% | -1.00R | |
| Total: 119 | +65.7R | |||||||||
How much to risk per trade
The stop in this strategy is wide — below the handle low on the daily chart. So size the lot from your risk, not «by eye»: 1% of the account per trade is a normal size with such a stop. With 1% risk, the maximum drawdown over the whole history would have been about 7% of the account.
Common mistakes
- Seeing a cup in every pullback. Without an uptrend before the pattern and without a rounded bottom, it is not a cup.
- Buying before the daily close. A wick breakout often turns out to be false. Wait for the daily candle to close above the level.
- Placing the stop under the nearest candle. A short stop gets hit by ordinary noise. The right place is below the handle low.
- Expecting a trade every day. A valid cup is rare. On one market it appears once every year or two, so it is worth watching many markets at once.
- Trading the inverted cup. In our test the bearish version loses money.
FAQ
Which timeframe is best for the Cup and Handle?
The daily (D1). On H4 the pattern is weaker and less stable from year to year.
Which markets does it work on?
On every group we tested: currency pairs, crypto, indices, gold and silver. The more markets you scan, the more signals you get.
What is the pattern’s target?
The classic one — the depth of the cup measured up from the breakout. We also tested other targets (half the depth, one and a half depths, 2R, 3R): the cup depth is one of the best and the simplest.
How long does a trade last?
About 39 days on average. A cup takes weeks or months to form, and the move after the breakout is not fast either.
Does the inverted (bearish) cup work?
Not in our test: short trades lose money.
Conclusion
The Cup and Handle is one of the few classic patterns that survives an honest test. On the daily chart across 46 markets it made +65.7R on 119 trades with a profit factor of 2.01, and 2025 and 2026 are both profitable. The key is strict rules: a trend before the pattern, a rounded bottom, a shallow handle, MA200 below the handle, entry only after a daily close above the rims, a stop below the handle and a target equal to the cup depth. There are few signals, so scan many markets at once and do not rush the entry.
 Point your phone camera here