Contents 5
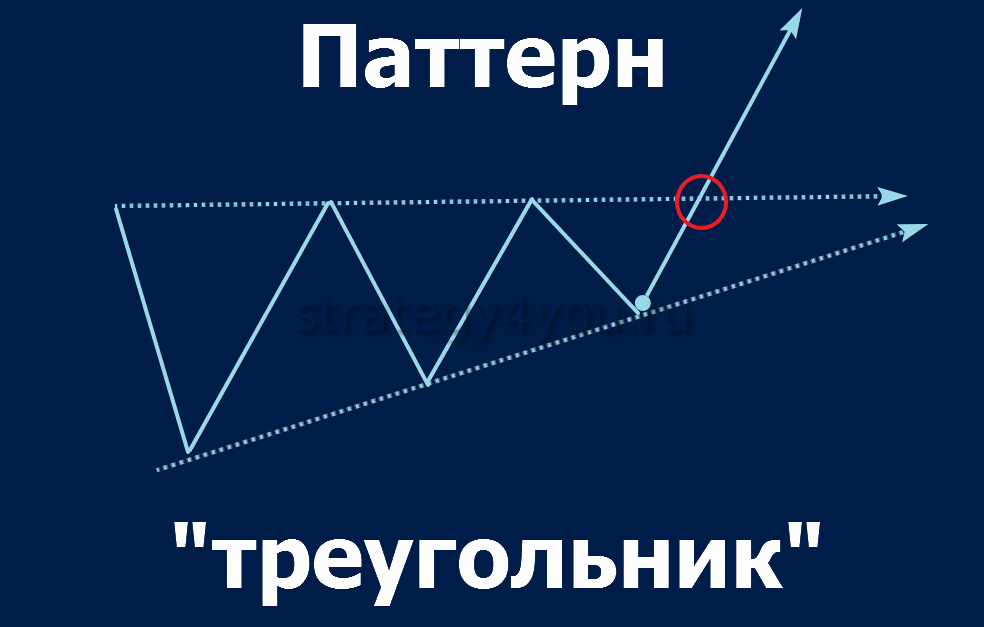 Forex (FX), or Foreign Exchange, is a system of interbank currency exchange at free prices that has been working for more than 40 years. It is popular with analysts who want to profit from exchange rate differences or the direction of trends. Chart patterns in trading are one of the ways to «invest money» wisely and earn from it.
Technical analysis chart patterns
Beginners don’t realize that patterns constantly repeating on the chart let professionals forecast a situation before it reaches its peak and profit from it. An outsider only vaguely knows that exchange traders earn quite well on currency rate differences precisely thanks to them.
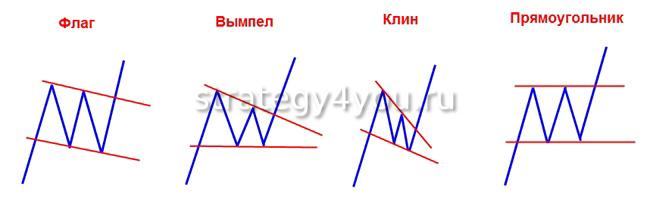
Beginners are taught that technical analysis of what happens on the screen uses geometric shapes that professionals call «trading patterns». Literally, the English word «pattern» means «model» or «template». Each pattern also has common features that make it possible to forecast the situation.
Chart formations that allow an accurate forecast of an asset’s rise or fall are called «chart analysis patterns» in traders’ language.
The chart patterns traders see on their screens are:Experts note that chart analysis is based on universal tools such as resistance (the upper conditional line) and support (the lower level).
- triangles;
- rectangles;
 wedges;
- spikes;
- head and shoulders;
- saucers;
- cup and handle;
- tops;
- bottoms;
- flags;
- gaps;
- Japanese candlestick patterns.
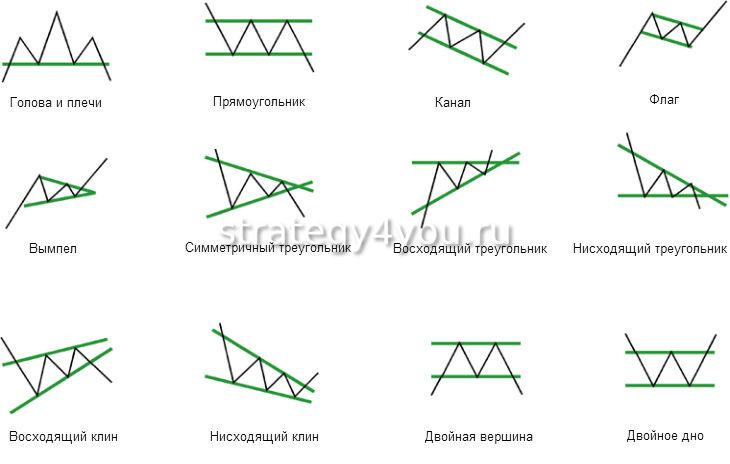
All chart patterns of the stock market, forex and other financial markets can be rising, falling or symmetrical. Experienced traders know how trading will develop just by looking at the patterns that appear.
Each pattern has its own advantages and drawbacks. Some traders earn on tops, others prefer triangles or wedges.
Advantages and drawbacks
Forex patterns have their pros and cons.
Arguments for using these geometric «hints» in trading:- they are easy to see;
- they have clear formation rules;
- the analysis needs no extra tools.
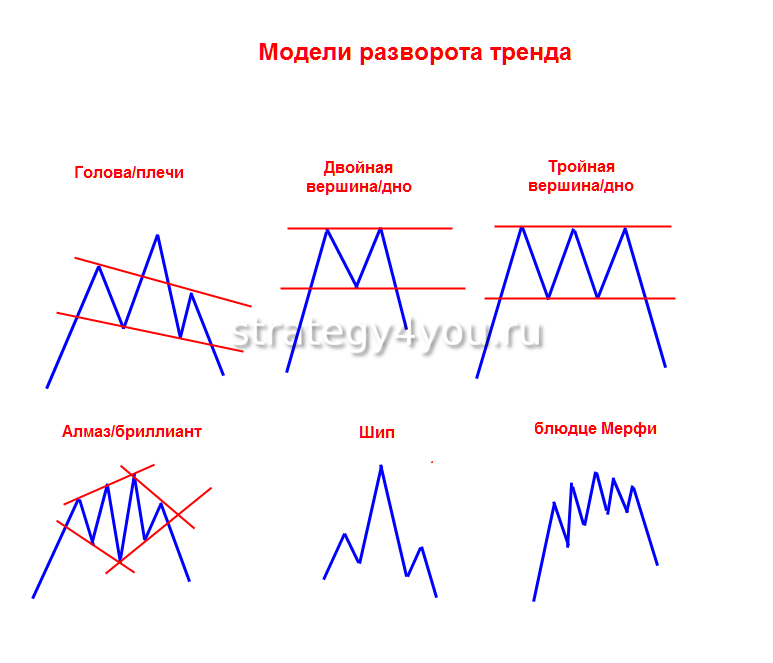 Once a trader understands what a pattern is and how it is born, a whole range of options for analyzing and forecasting the market opens up. Thanks to chart analysis, the trader can quickly buy or sell assets.
The established formation rules of patterns and their meaning give a forex trader a guide for acting in a given situation. To spot chart patterns in a rising or falling market, it is enough to use levels and trends, which lets you understand the situation without extra materials or indicators.
The main drawback of working with patterns is the subjectivity of interpretation.
Classification of chart patterns
Trading has an established classification of chart patterns.
The main groups are:- reversal patterns;
- trend continuation patterns;
- bilateral patterns.
 When the first type appears on the chart, it tells the trader that the trend is about to change direction. Continuation patterns show that after a pause or consolidation the move will most likely continue in the same direction.
As for bilateral patterns, you should know that their potential rise equals their potential fall and vice versa. Such patterns are considered dangerous for beginners, because it is hard to predict how and in which direction the breakout will happen.
Reversal patterns
Experts name several popular reversal patterns.
They include:- head and shoulders;
- inverse head and shoulders;
- double top;
- double bottom;
- falling wedge;
- rising wedge;
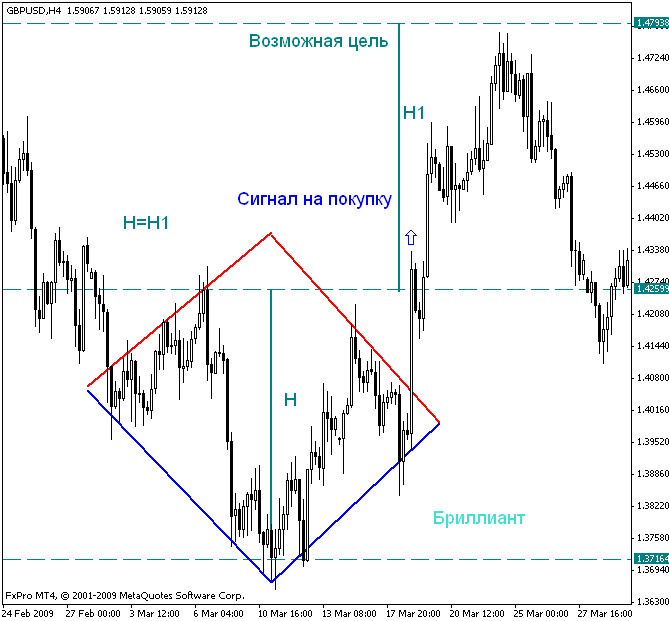
- diamond.
The «double top» or «double bottom» pattern forms within a price range. Testing the support level and then breaking through, the trend gauges market conditions, after which it may form a head and shoulders or turn into another chart pattern.
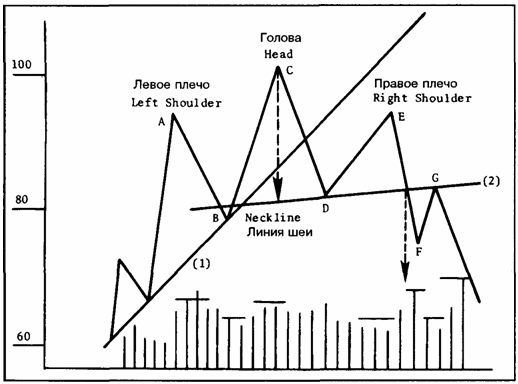 The «Head and Shoulders» pattern can form both at the bottom and at the top of the chart. The head is the highest point between two almost equal ones. Whether the pattern is regular or inverse depends on whether it forms at the top or at the bottom.
Traders see several variations of the wedge on their screens. This pattern forms at market lows or highs. Remember that traders call a falling wedge «bullish» and a rising wedge «bearish».
Trend patterns
FX also has trend (continuation) patterns, which show periods when the price rests before a push up or down.
The most common ones are: falling or rising wedge;
- bullish rectangle;
- bearish rectangle;
- bull flag;
- bear flag.

Brokers and traders know that a pattern labeled «bullish» points to a rise of the asset, while a «bearish» one points to a decline.
Wedges, rising or falling, end with a point where the lines converge. When the price breaks through the lower boundary, it is time to sell. If in a falling wedge the price breaks above the upper boundary line, it is time to buy.
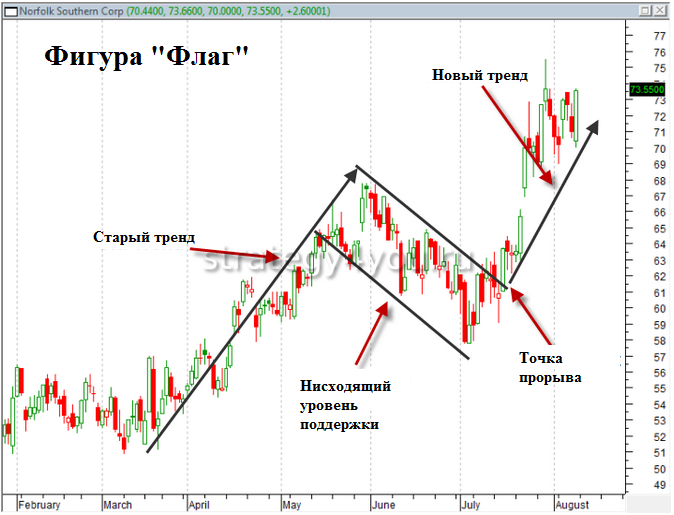
The pennant, although it looks like a triangle, differs from it in how fast it forms. This chart pattern forms within 45-60 minutes. The flag on an exchange chart is a rectangle that in most cases slopes against the trend.
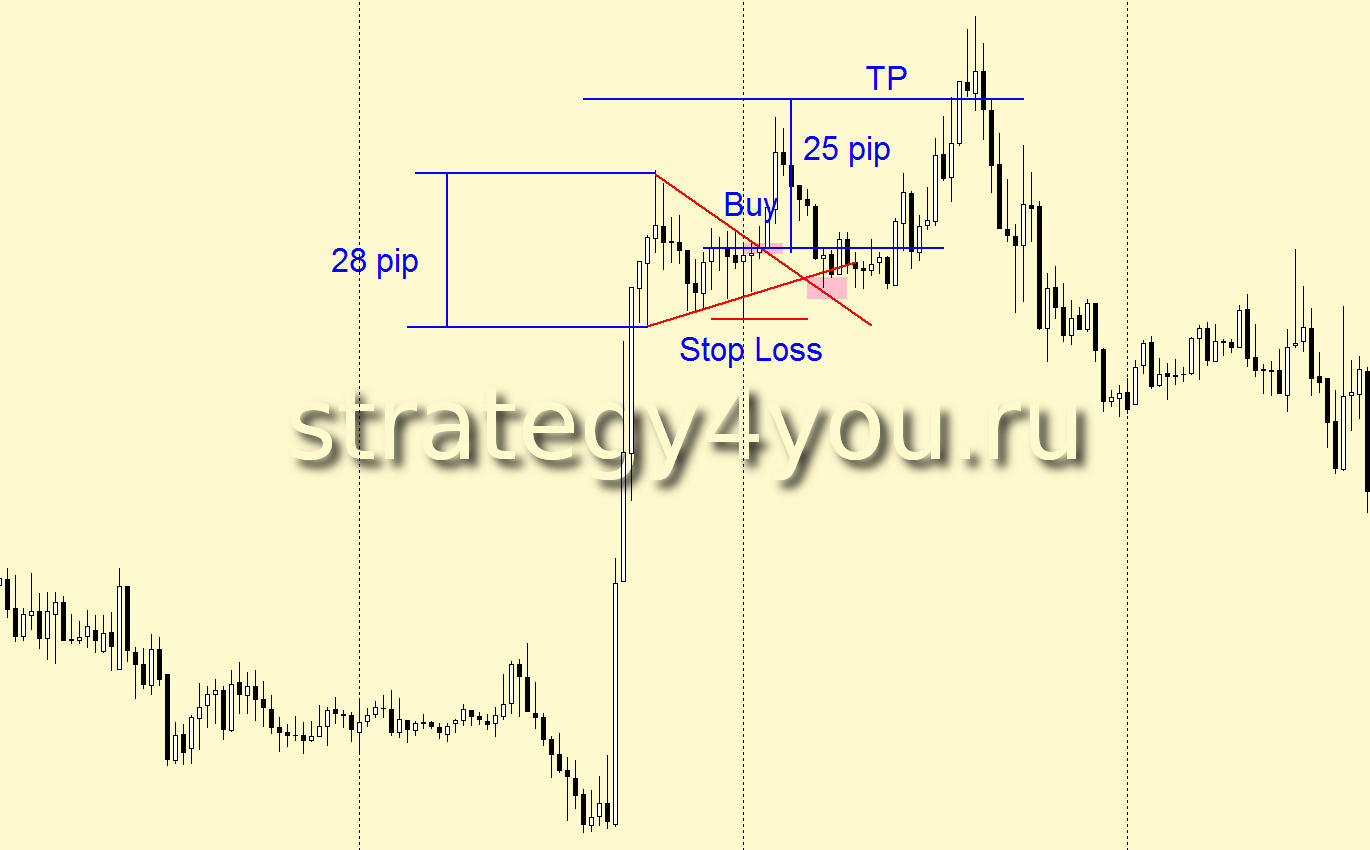
Experienced traders and brokers advise FX beginners not to act unless they are completely sure. If the pattern on the screen does not clearly look like a triangle or a pennant, don’t base your trades on it.