Indice 14
- Regole del Metodo Puria (originale)
- Come abbiamo testato la strategia
- Risultato: il Metodo Puria classico perde soldi
- Puria 2.0: la versione migliorata sull’oro
- Come ci siamo assicurati che non sia sovra-ottimizzazione
- Statistiche: 994 operazioni sull’oro nel 2008–2026
- Esempi di operazioni Puria 2.0 passo dopo passo
- Galleria: tutte le operazioni sull’oro 2024–2026
- Come calcolare il lotto sull’oro
- Risultati su USDJPY: perché lo yen è alla fine dell’articolo
- Errori frequenti
- FAQ: domande frequenti sul Metodo Puria
- Video: il Metodo Puria testato su operazioni reali
- Conclusione
Il Metodo Puria è una delle strategie forex semplici più conosciute: tre medie mobili e il MACD, un take profit piccolo e la promessa di «almeno 50 pip al giorno». Abbiamo pubblicato questo articolo molti anni fa e da allora lo hanno letto migliaia di trader.
Nel 2026 abbiamo testato la strategia con un programma su tutto lo storico. Prima rigorosamente secondo le regole dell’autore: 13,002 operazioni su quattro coppie di valute nel 2008–2024, spread incluso. Poi l’abbiamo migliorata passo dopo passo e trovato una versione che funziona sull’oro (XAUUSD): utile nel 2008–2025 e utile nel 2026, un anno che non abbiamo usato per scegliere le regole. Qui sotto: le regole originali, i risultati onesti della versione classica, Puria 2.0 sull’oro con tutte le operazioni e, a parte, cosa è successo su USDJPY.
Regole del Metodo Puria (originale)
Ecco le regole esattamente come sono sempre apparse in questo articolo. Sono quelle che abbiamo testato.
Indicatori
Su un grafico H1 o M30 (a seconda della coppia — vedi la tabella sotto) si inseriscono:
- Moving Average 1: periodo 85, metodo Linear Weighted (LWMA), applicare a Low, colore rosso.
- Moving Average 2: periodo 75, metodo Linear Weighted, applicare a Low, colore rosso.
- Moving Average 3: periodo 5, metodo Exponential (EMA), applicare a Close, colore giallo.
- MACD: EMA veloce 15, EMA lenta 26, MACD SMA 1.
Tutti gli indicatori sono inclusi di serie in MetaTrader 4 e 5. Un template pronto per MT4 si trova alla fine di questa sezione.

Ingresso in posizione
- Acquisto: la EMA 5 gialla incrocia entrambe le LWMA rosse dal basso verso l’alto e il MACD conferma — la barra ha chiuso sopra lo zero.
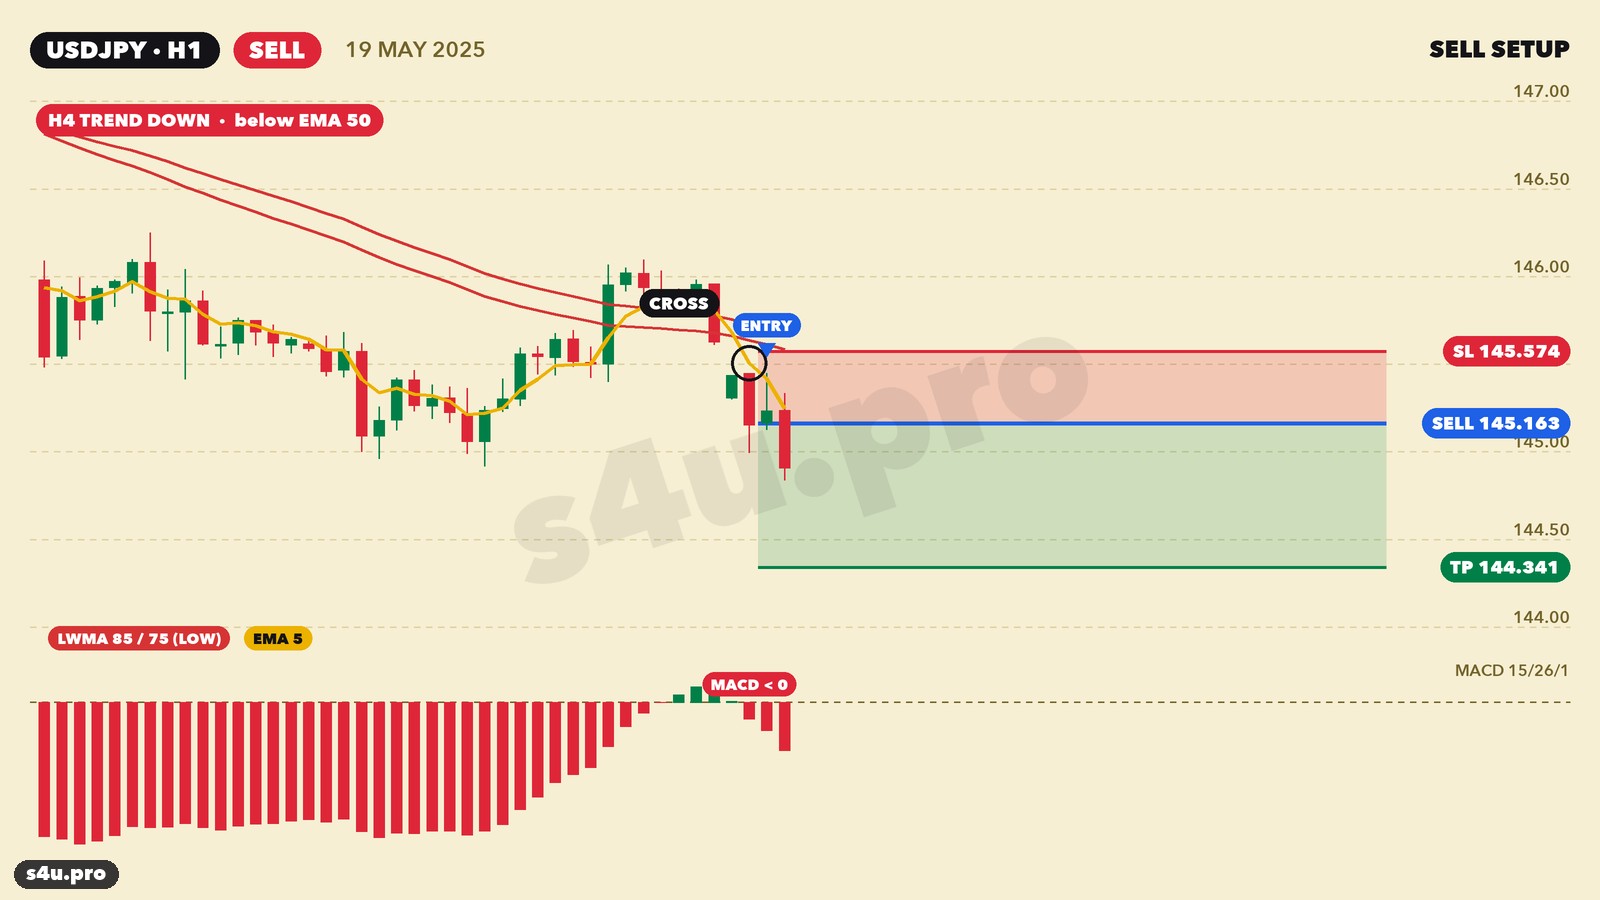
- Vendita: la EMA 5 gialla incrocia entrambe le LWMA rosse dall’alto verso il basso e la barra del MACD ha chiuso sotto lo zero.
- Stop Loss: al massimo 14 pip.
- Take Profit: fisso, diverso per ogni coppia.
Coppie, timeframe e take profit
| Coppia | Timeframe | Take Profit |
|---|---|---|
| AUDJPY | M30 | 15 pip |
| NZDUSD | H1 | 25 pip |
| USDCAD | H1 | 20 pip |
| EURGBP | H1 | 10 pip |
| USDJPY | M30 | 15 pip |
| GBPUSD | M30 | 20 pip |
| USDCHF | M30 | 10 pip |
| EURCHF | H1 | 15 pip |
| AUDUSD | M30 | 10 pip |
| EURJPY | M30 | 15 pip |
| CHFJPY | H1 | 15 pip |
| CADJPY | M30 | 20 pip |
| EURUSD | M30 | 15 pip |
L’idea dell’autore: «meglio prendere un po’ ogni giorno». Un take profit piccolo viene raggiunto spesso e lo stop, secondo l’autore, «capita molto di rado». Vediamo se è vero.
- Scarica il template classico per MetaTrader 4 — method_puria.tpl
- Il nostro vecchio test manuale del 2018–2019 — qui >>
Come abbiamo testato la strategia
Prima testavamo la strategia a mano in Forex Tester — qualche mese su ogni coppia. Questa volta l’abbiamo fatta girare con un programma su tutte le barre, senza buchi e senza scegliere operazioni «comode».
- Dati: storico quotazioni MetaTrader 4 (Alpari), 2008–2024, ora del terminale.
- Coppie: GBPUSD, EURUSD, USDJPY (M30) e USDCAD (H1) — quelle con lo storico più lungo e pulito. Timeframe e take profit rigorosamente dalla tabella dell’autore.
- Segnale: sulla barra chiusa la EMA 5 si trova dall’altra parte di entrambe le LWMA, mentre sulla barra precedente non ancora; il MACD sulla stessa barra è sopra lo zero (acquisto) o sotto lo zero (vendita).
- Ingresso: all’apertura della barra successiva. Stop di 14 pip, take profit dalla tabella. Un’operazione per coppia alla volta.
- Spread: dedotto da ogni operazione — GBPUSD 1.5 pip, EURUSD 1.0, USDJPY 1.2, USDCAD 1.8.
- Precisione: se in una barra M30 il prezzo ha toccato sia lo stop sia il take profit, abbiamo guardato su M5 cosa è venuto prima.
Risultato: il Metodo Puria classico perde soldi
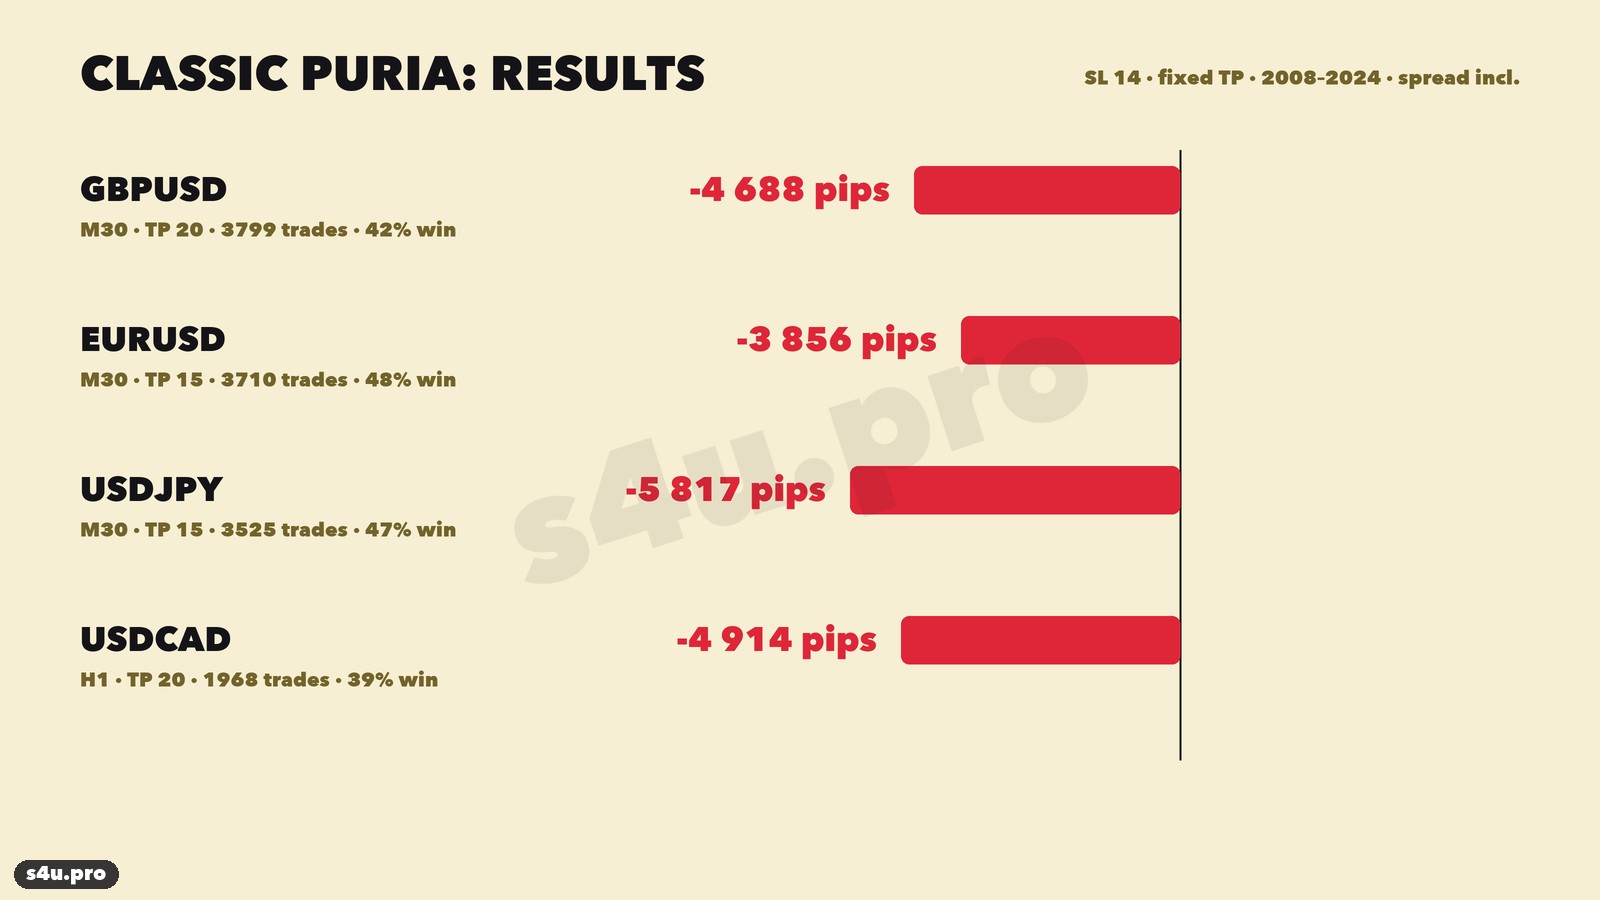
| Coppia | TF / take profit | Operazioni | Vincenti | Risultato, pip |
|---|---|---|---|---|
| GBPUSD | M30 / 20 | 3,799 | 42% | −4,688 |
| EURUSD | M30 / 15 | 3,710 | 48% | −3,856 |
| USDJPY | M30 / 15 | 3,525 | 47% | −5,817 |
| USDCAD | H1 / 20 | 1,968 | 39% | −4,914 |
| Totale | 13,002 | −19,276 |
Nessuna coppia ha chiuso in utile. Le curve di equity scendono quasi in linea retta — non sono «anni sfortunati», ma una perdita costante su tutto lo storico.
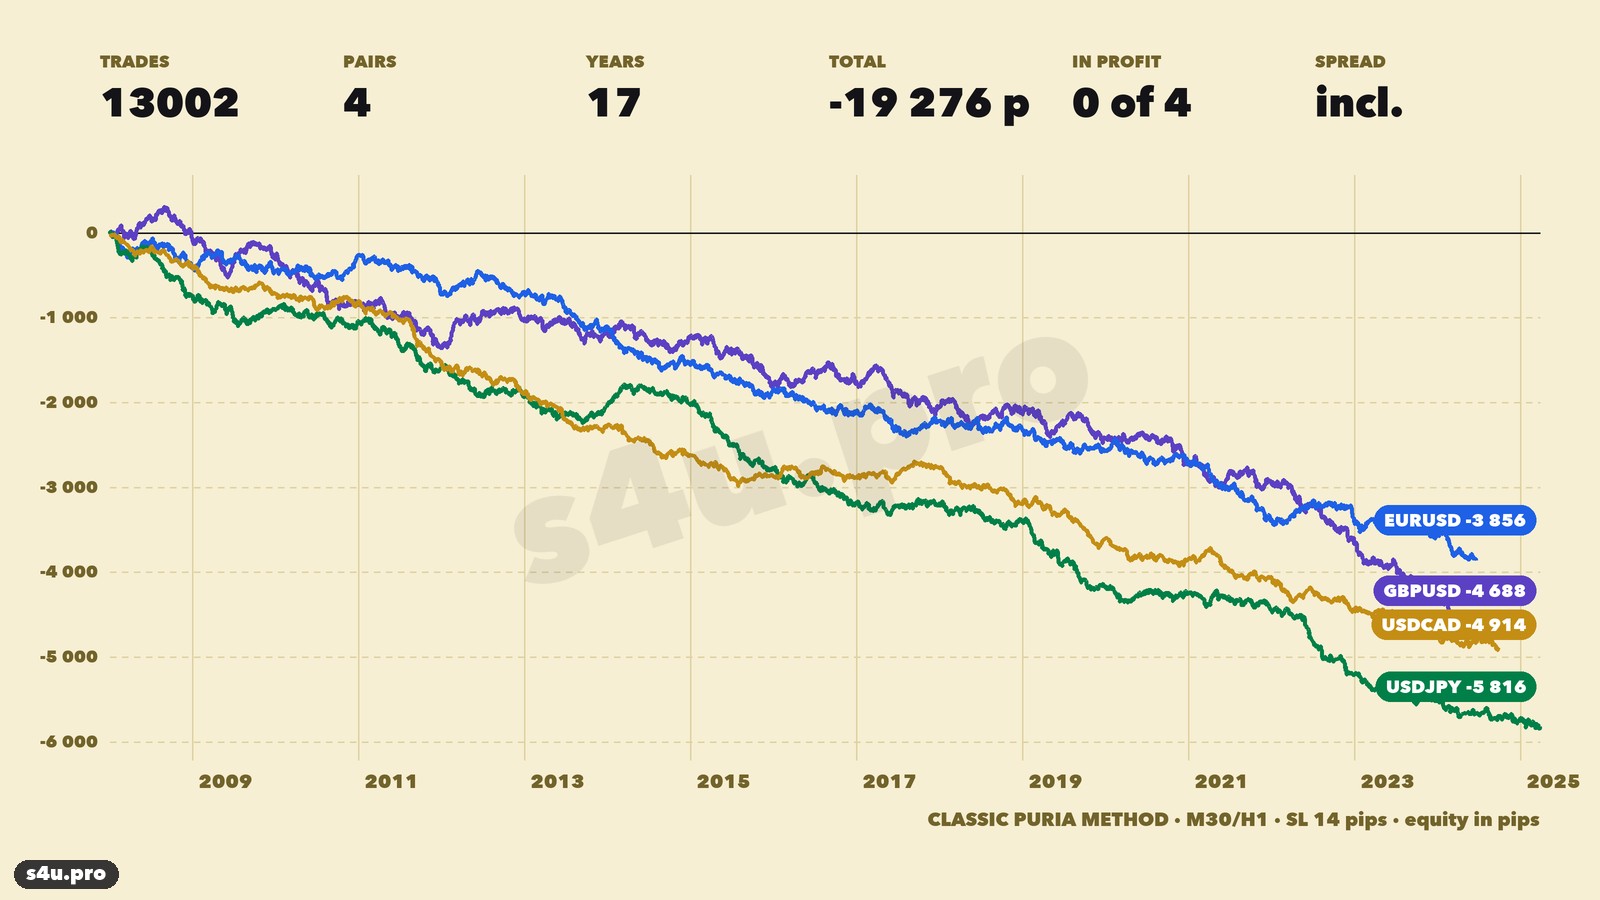
Anche la promessa «lo stop capita molto di rado» non si è confermata: il 52–61% delle operazioni si è chiuso allo stop. Uno stop di 14 pip su M30 è più piccolo dell’escursione media di una singola candela di GBPUSD — il normale rumore lo colpisce.
Perché non funziona: lo spread si mangia tutto
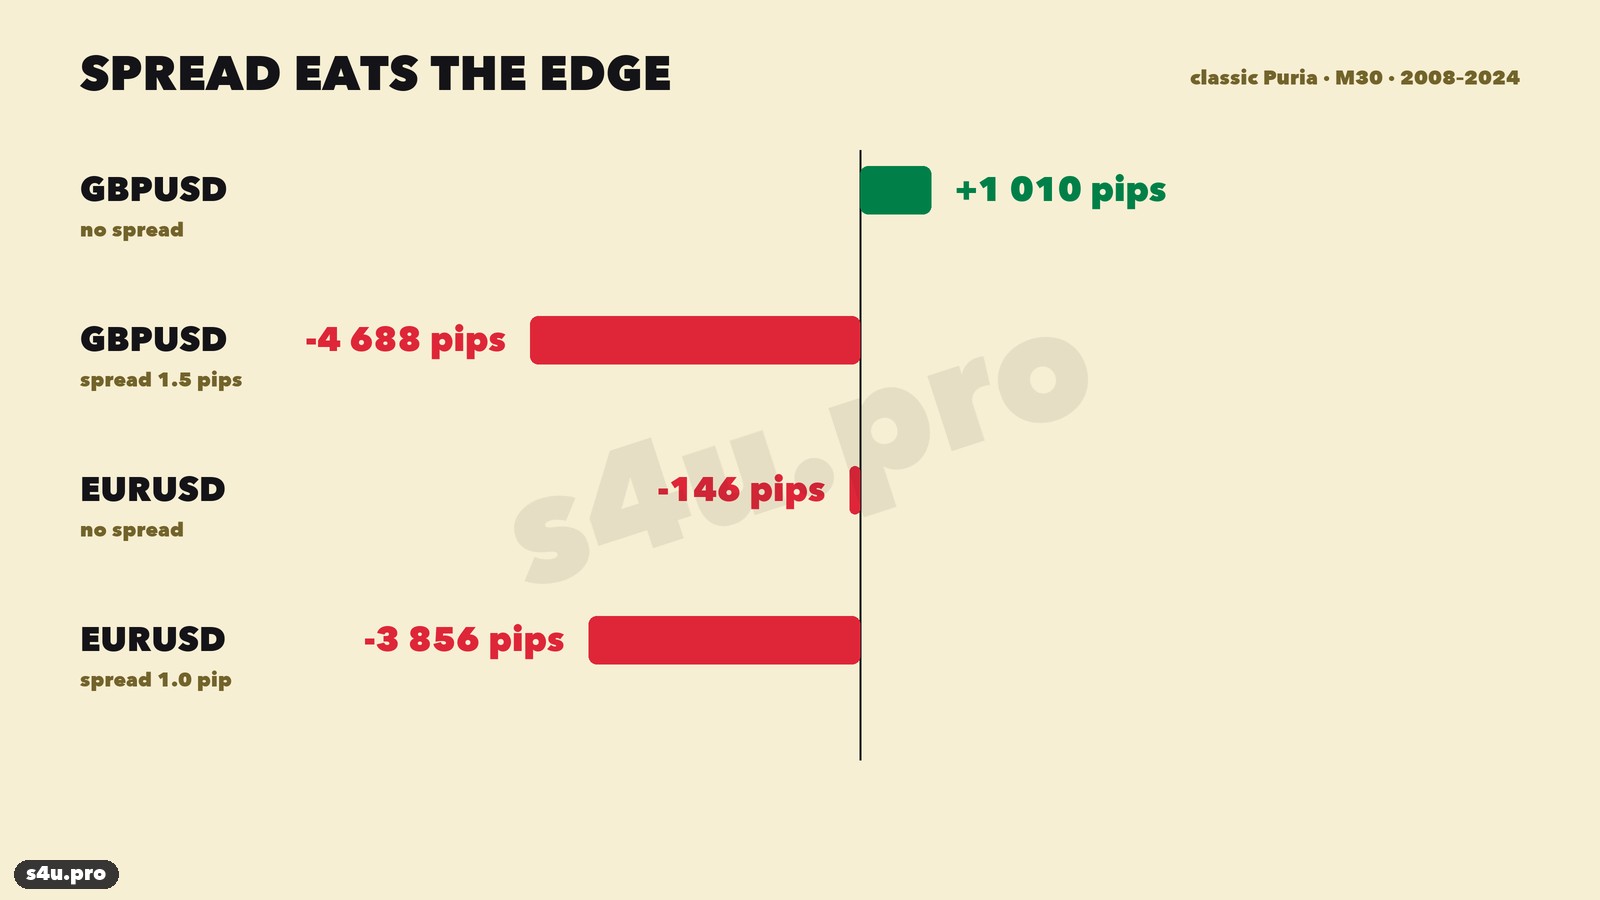
Abbiamo ripetuto lo stesso test senza spread. Allora GBPUSD dà +1,010 pip, EURUSD circa zero (−146). Quindi il segnale in sé non dà quasi nessun vantaggio, e con un take profit di 15–20 pip uno spread di 1–1.5 pip si porta via il 7–10% di ogni operazione vincente e aggiunge altrettanto a ogni perdita. Su migliaia di operazioni lo zero diventa una grossa perdita.
E il vecchio test a +84%?
Nel test manuale del 2018–2019 GBPUSD M30 mostrava +84% in un anno, e le operazioni perdenti lì «si chiudevano in pareggio». Abbiamo preso lo stesso periodo (agosto 2018 – giugno 2019) e testato due varianti: rigorosamente secondo le regole e con lo stop spostato a breakeven dopo +10 pip. Entrambe hanno dato circa −100 pip dopo lo spread. Il breakeven non aiuta neanche su tutto lo storico: −4,234 pip su GBPUSD, −3,998 su EURUSD, −6,036 su USDJPY.
Un test manuale comporta sempre il rischio di errori: si saltano operazioni, l’ingresso viene «aggiustato», lo spread viene ignorato. Per questo ora testiamo le strategie solo con programmi e mostriamo ogni operazione.
Puria 2.0: la versione migliorata sull’oro
Il segnale in sé — l’incrocio della EMA 5 con due LWMA e la conferma del MACD — è per natura un segnale di trend. Un take profit fisso e piccolo costringe a uscire prima che il trend abbia il tempo di muoversi. Abbiamo mantenuto gli indicatori dell’autore e cambiato cinque cose. Le prime tre le avevamo trovate prima, sulle coppie di valute; la quarta e la quinta capendo perché la prima versione migliorata aveva smesso di funzionare sullo yen.
- Timeframe H1 invece di M30. Meno incroci falsi, e lo spread diventa una parte più piccola del movimento.
- Filtro di trend H4. Compriamo solo se l’ultima candela H4 chiusa ha chiuso sopra la EMA 50 su H4. Vendiamo solo se ha chiuso sotto.
- Stop e target in base alla volatilità. Stop Loss = 1.5 × ATR(14) su H1, Take Profit = 2 stop (2R). Un’operazione alla volta.
- LWMA «speculari». Per le vendite le LWMA 85 e 75 rosse sono calcolate su Low, come nell’originale. Per gli acquisti le stesse LWMA, ma su High.
- Filtro di trend settimanale. Compriamo solo se l’ultima settimana chiusa ha chiuso sopra la EMA 20 sul grafico settimanale. Vendiamo solo se ha chiuso sotto.
Scarica il template Puria 2.0 per MetaTrader 4 — puria_2_0.tpl (XAUUSD H1).
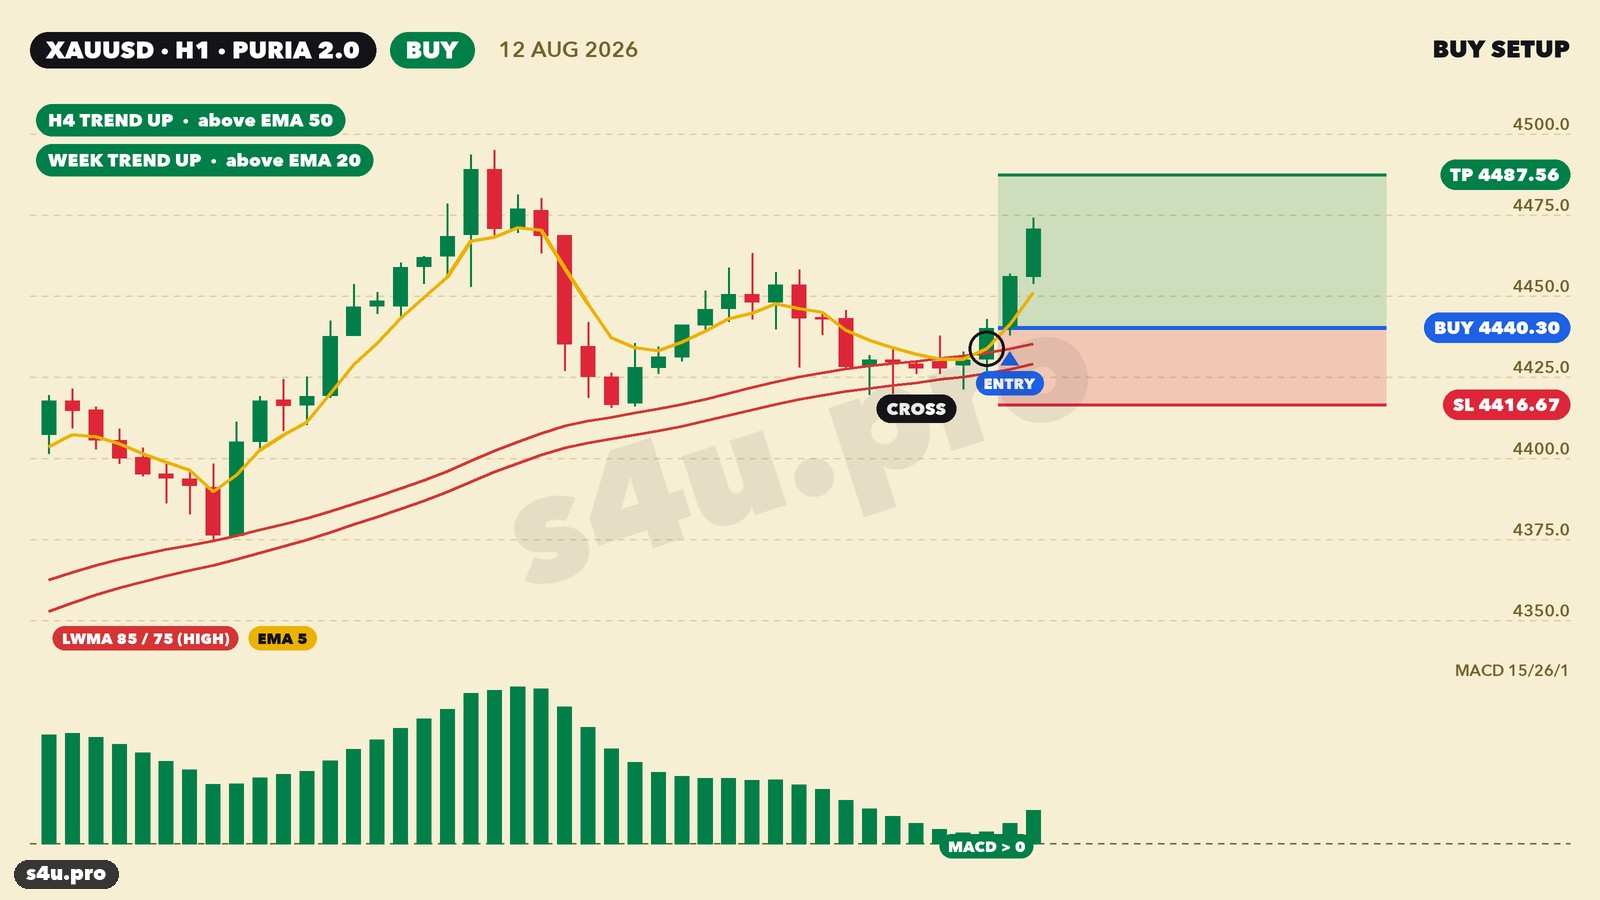
LWMA 85 e 75 rosse su Low per le vendite, verdi su High per gli acquisti, EMA 5 blu, MACD 15/26/1 e ATR 14 per lo stop. La EMA 50 arancione è visibile solo su H4 e la EMA 20 solo sul grafico settimanale: cambia timeframe per verificare il trend.
Perché LWMA «speculari»
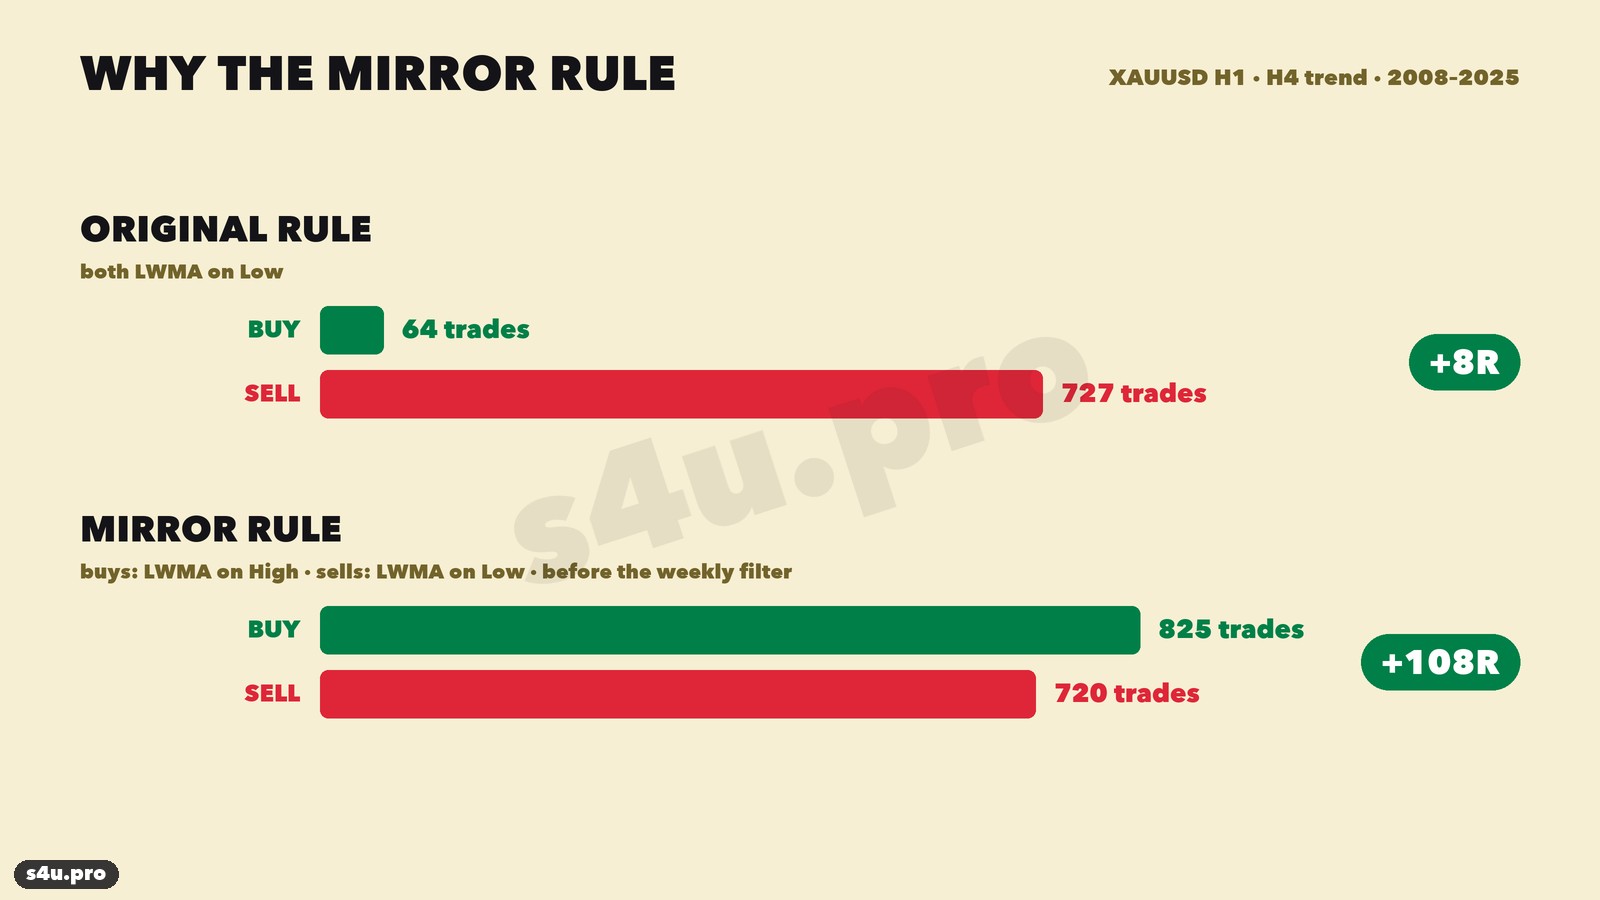
Nell’originale entrambe le linee rosse sono calcolate sui minimi delle candele (Low). La chiusura è quasi sempre sopra il minimo, quindi la EMA 5 incrocia queste linee verso l’alto troppo presto — quando il MACD è per lo più ancora sotto lo zero. Con la regola «MACD sulla stessa candela» non ci sono quasi acquisti: sull’oro nel 2008–2025 si hanno 64 acquisti contro 727 vendite. Una strategia che quasi solo vende è condannata in un mercato al rialzo.
Abbiamo semplicemente reso la regola simmetrica: per comprare, la EMA 5 deve incrociare LWMA calcolate sui massimi (High), così come per vendere incrocia LWMA sui minimi. Acquisti e vendite diventano più o meno pari (825 e 720) e il risultato sull’oro nel 2008–2025 sale da +8R a +108R — ancora prima del filtro settimanale.
Il filtro settimanale elimina le operazioni contro il grande trend: le operazioni sono meno (994 invece di 1,600 nel 2008–2026), il drawdown scende da −43R a −34R e il profit factor sale da 1.11 a 1.17.
Come ci siamo assicurati che non sia sovra-ottimizzazione
Adattare i parametri allo storico è facile: prova cento varianti e una di sicuro «guadagnerà». Per questo abbiamo testato in modo che gli ultimi anni non influenzassero la scelta delle regole.
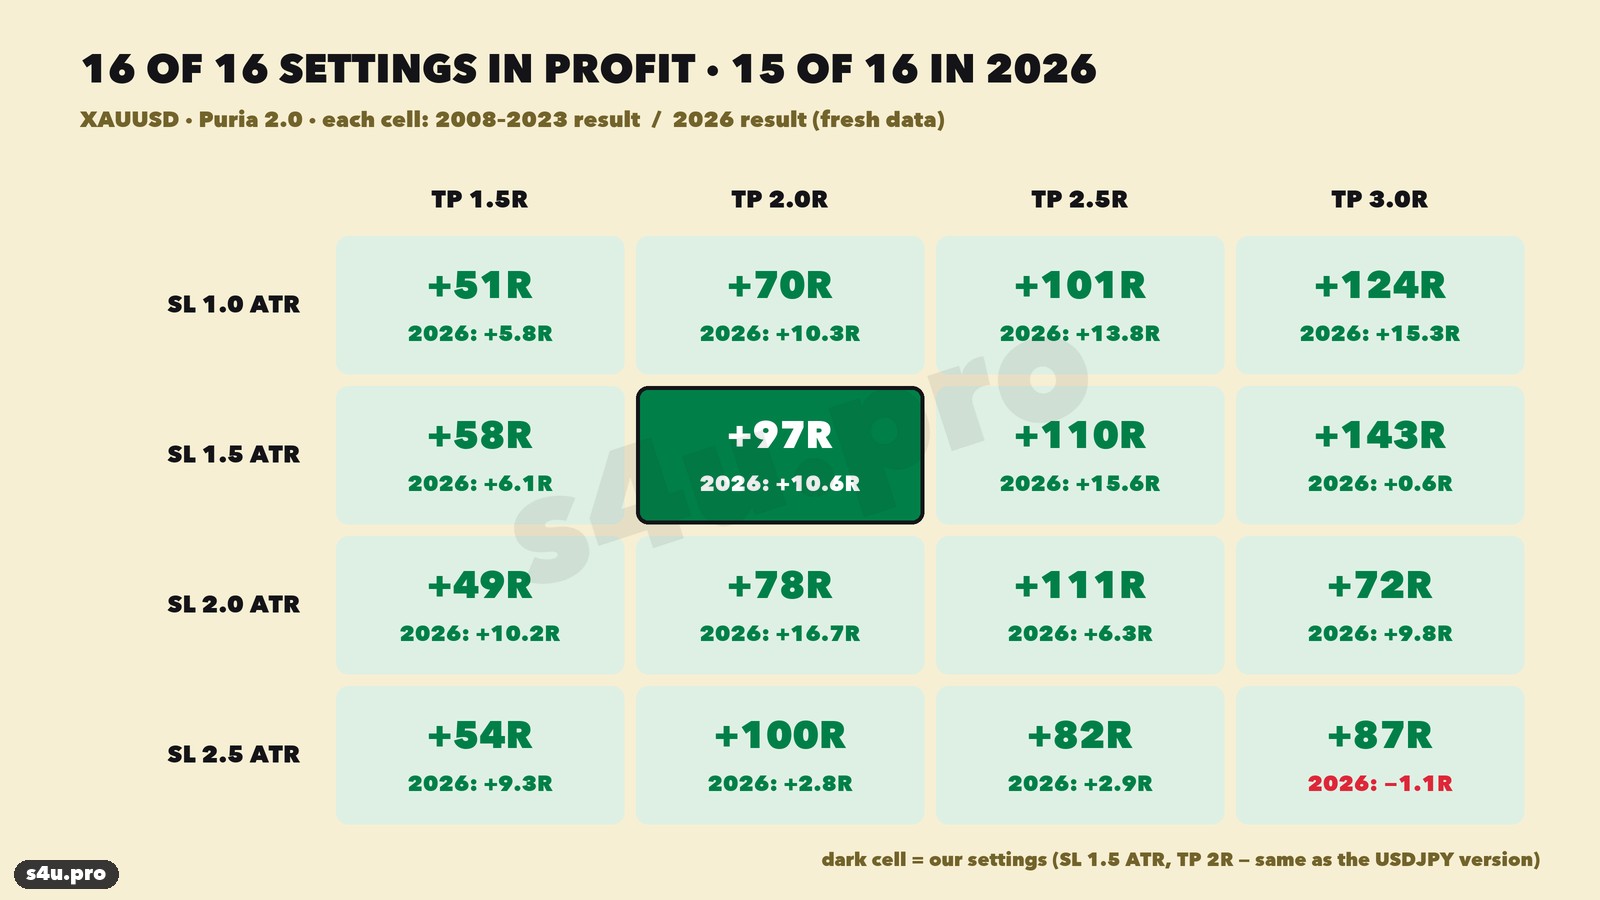
- Le regole sono state scelte sul 2008–2023. Lo stop di 1.5 ATR e il take profit 2R sono gli stessi della prima versione migliorata per USDJPY; non li abbiamo adattati all’oro.
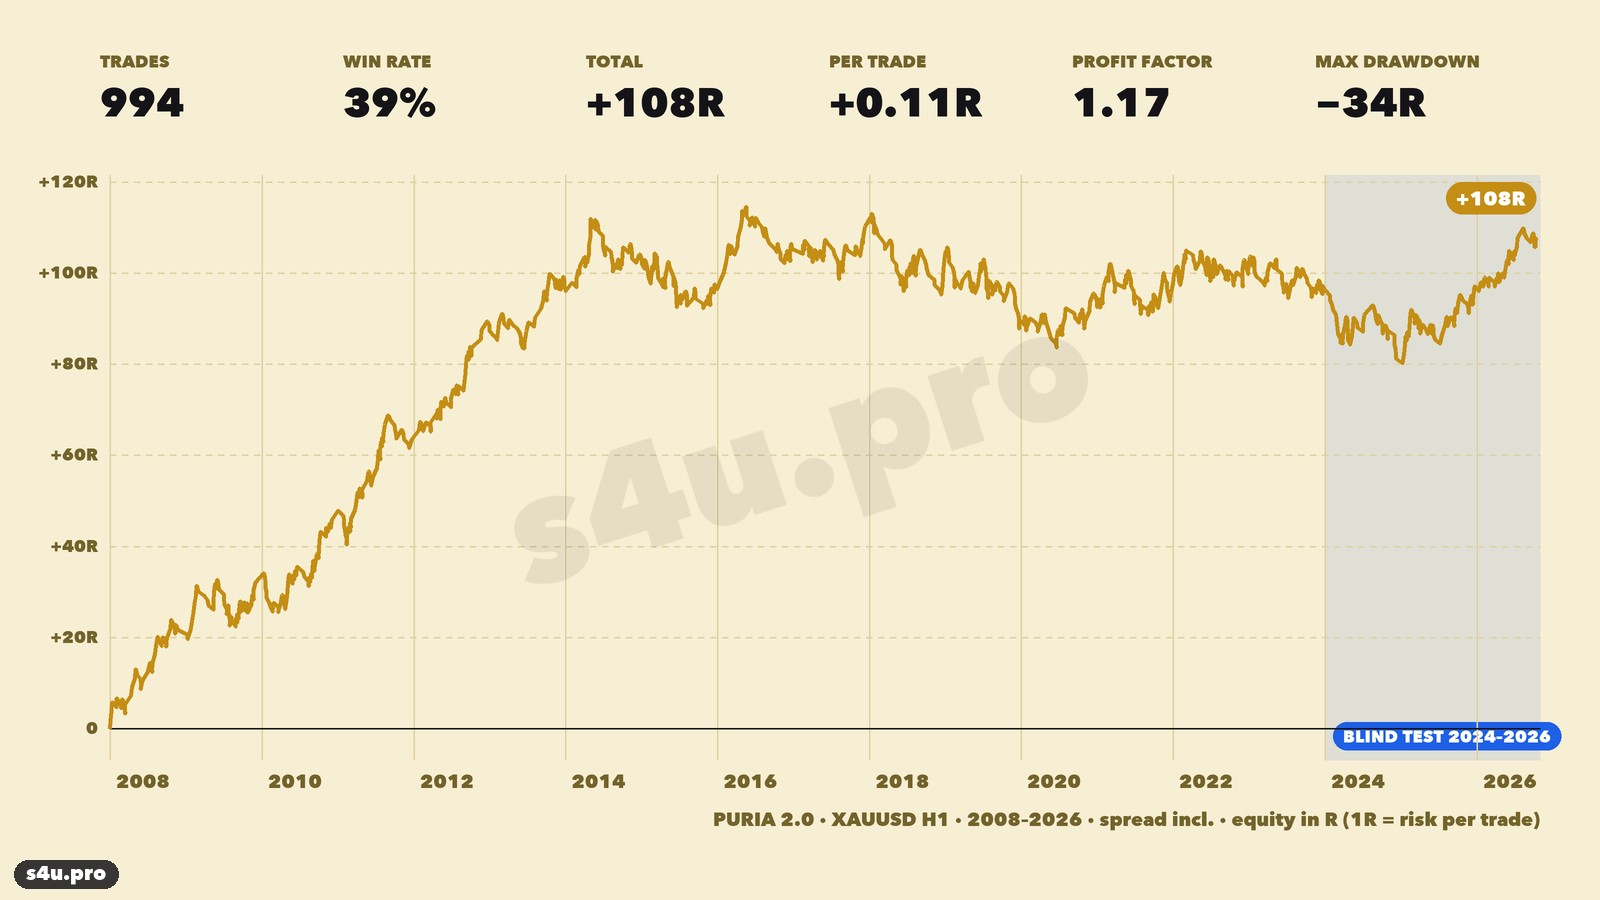
- Il 2024–2026 è un test «alla cieca». 2024–2025 sullo storico Alpari, 2026 (gennaio–ottobre) su quotazioni recenti che non erano nello storico principale.
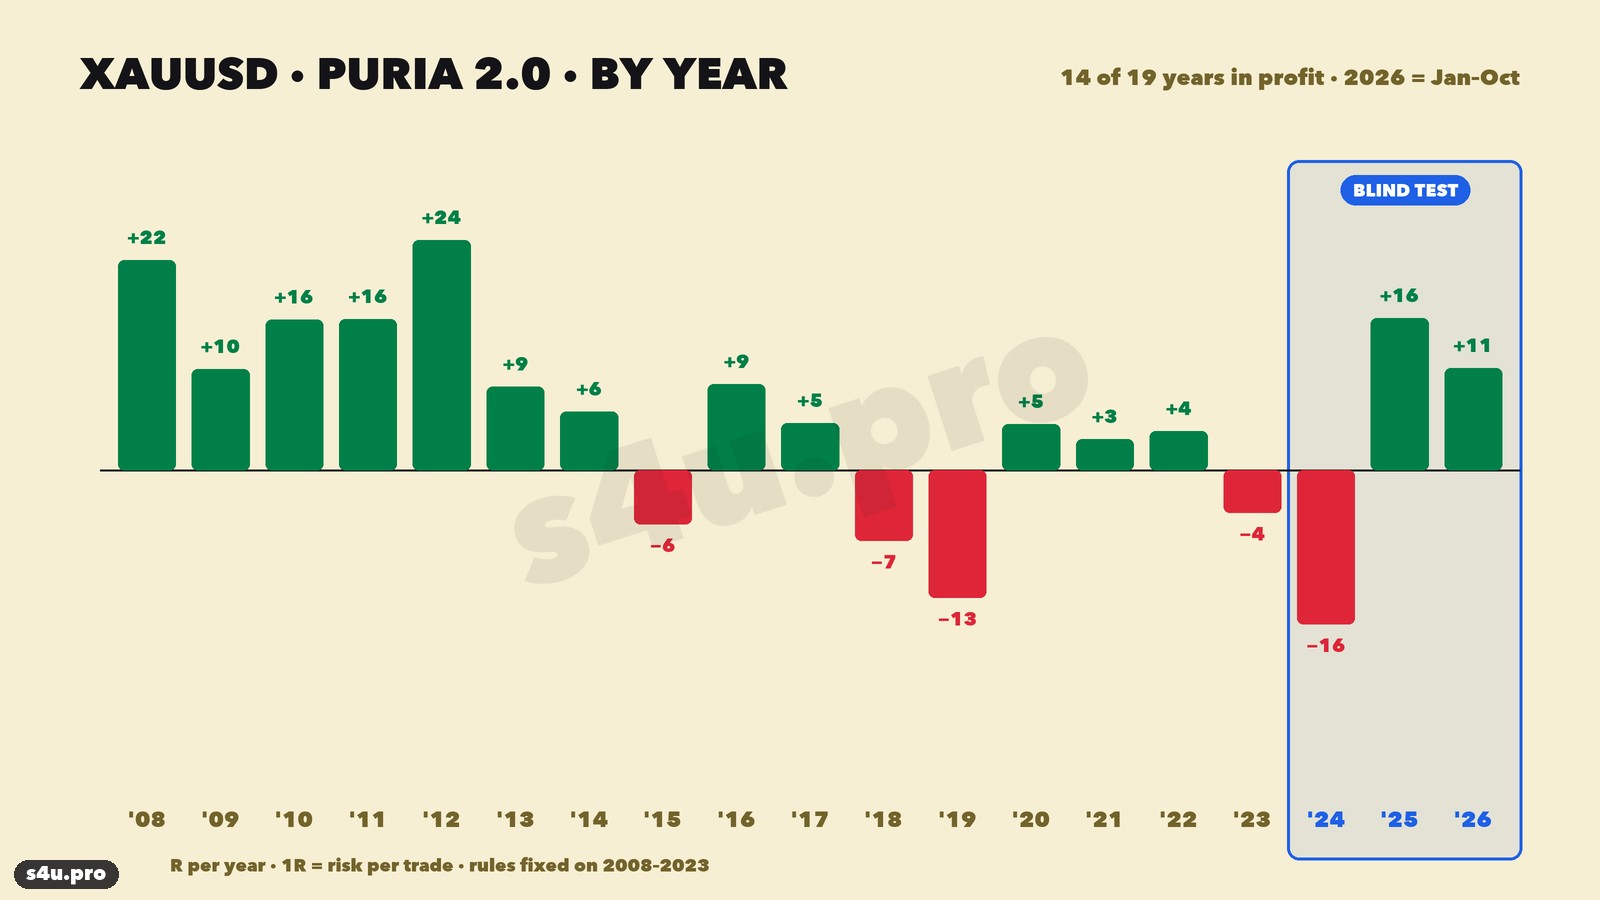
- Risultato del test alla cieca: 2024 −16R, 2025 +15.8R, 2026 +10.6R (40 operazioni, 17 take profit).
- Anche le impostazioni vicine funzionano. Abbiamo testato 16 combinazioni di stop (1–2.5 ATR) e take profit (1.5–3R). Tutte e 16 sono positive nel 2008–2023 e 15 su 16 sono positive nel 2026. Il risultato non si regge su un unico numero «fortunato».
Statistiche: 994 operazioni sull’oro nel 2008–2026
Numeri principali
| XAUUSD H1, Puria 2.0 | 2008–2026 | 2008–2023 (scelta delle regole) | 2024–2025 (test alla cieca) | 2026 (test alla cieca) |
|---|---|---|---|---|
| Operazioni | 994 | 846 | 108 | 40 |
| Vincenti | 39% | 39% | 34% | 43% |
| Risultato | +107.7R | +97.3R | −0.2R | +10.6R |
| Profit factor | 1.17 | 1.18 | 1.00 | 1.46 |
| Drawdown max | −34R | −31R | −17R | −4R |
R è il rischio di un’operazione. +107.7R significa: rischiando l’1% del conto su ogni operazione, il risultato è di circa +108% in 19 anni senza reinvestimento, circa il 5.7% l’anno. In media +0.11R per operazione dopo lo spread. Circa 50 operazioni l’anno — meno di una alla settimana.
Risultati per anno
14 anni su 19 sono positivi. L’anno migliore è il 2012 (+23.8R), il peggiore il 2024 (−16R): l’oro è salito tutto l’anno con un trend forte e ritracciamenti brevi e bruschi, e la strategia ha preso stop a lungo — anche 12 di fila. Il 2025 e il 2026 hanno coperto questa perdita.
Acquisti e vendite
Gli acquisti hanno dato +96.2R (609 operazioni), le vendite +11.5R (385 operazioni). L’oro è salito a lungo e la maggior parte del guadagno è arrivata dalle operazioni a favore del rialzo. Anche le vendite però sono positive, e nel 2026 hanno reso più degli acquisti: +8.7R contro +1.9R. Non consigliamo di disattivare le vendite — sarebbe adattarsi al passato.
Il 2026 sull’oro
| 2026 (gennaio–ottobre), XAUUSD H1 | Valore |
|---|---|
| Operazioni | 40 (16 acquisti, 24 vendite) |
| A take profit | 17 (43%) |
| Acquisti | +1.9R |
| Vendite | +8.7R |
| Risultato | +10.6R, drawdown −4R, non più di 3 stop di fila |
Il guadagno è stato costruito in diversi mesi, non con un’unica operazione fortunata. Una precisazione: lo storico Alpari finisce a dicembre 2025, quindi il 2026 è stato calcolato sulle quotazioni del future sull’oro (Yahoo Finance, ora UTC). Il prezzo del future differisce un po’ dallo spot del broker, e le candele H4 e settimanali sono tagliate in UTC — alcune operazioni presso il tuo broker potrebbero non coincidere.
Quanto vale in denaro
L’oro è diventato molto più caro, quindi lo stop in dollari è cresciuto: nel 2008 1.5 ATR su H1 valevano circa $6, nel 2025 circa $16, nel 2026 circa $35 per oncia. Confrontare gli anni in dollari non ha senso, per questo contiamo in R e in percentuale di rischio. Con un rischio dell’1% per operazione: 2008–2026 circa +108%, 2026 (10 mesi) circa +10.6%.
Esempi di operazioni Puria 2.0 passo dopo passo
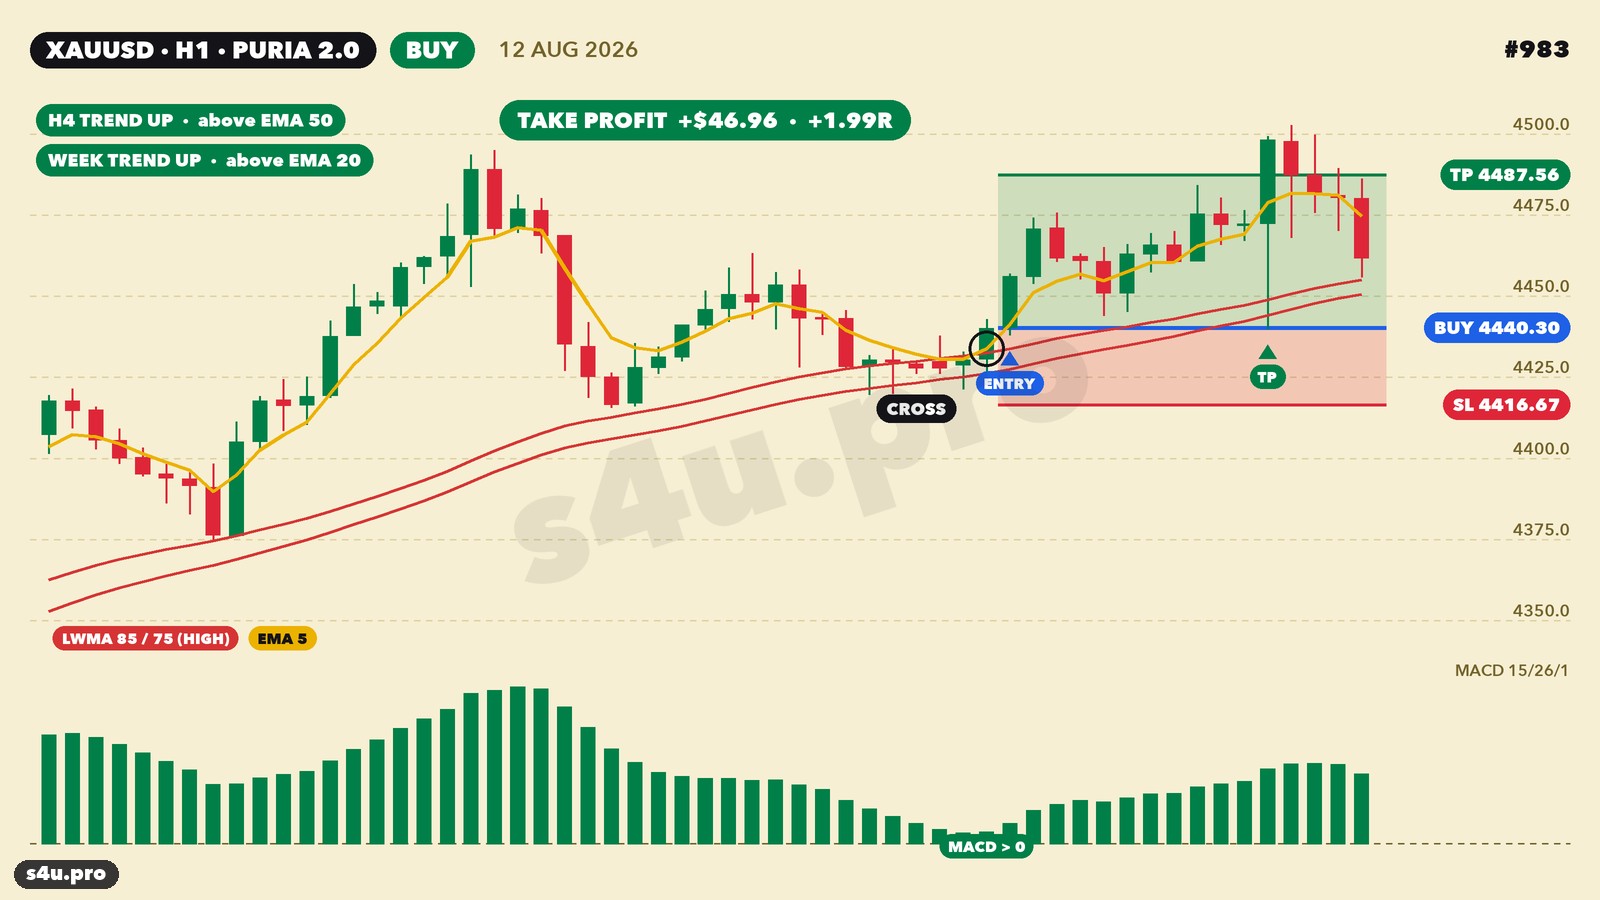
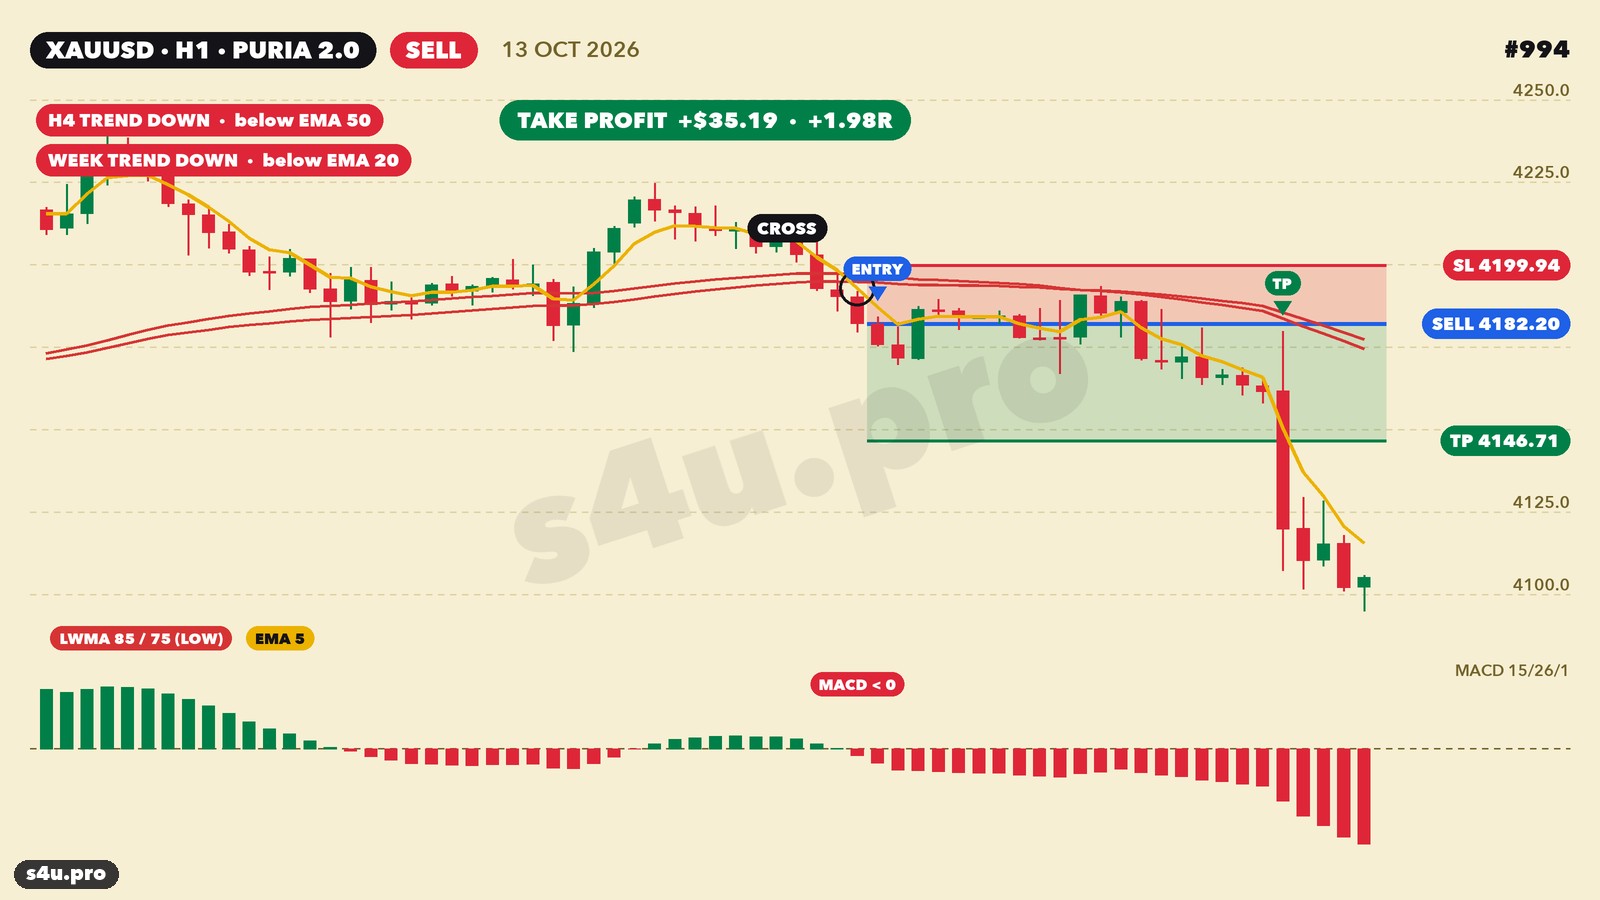
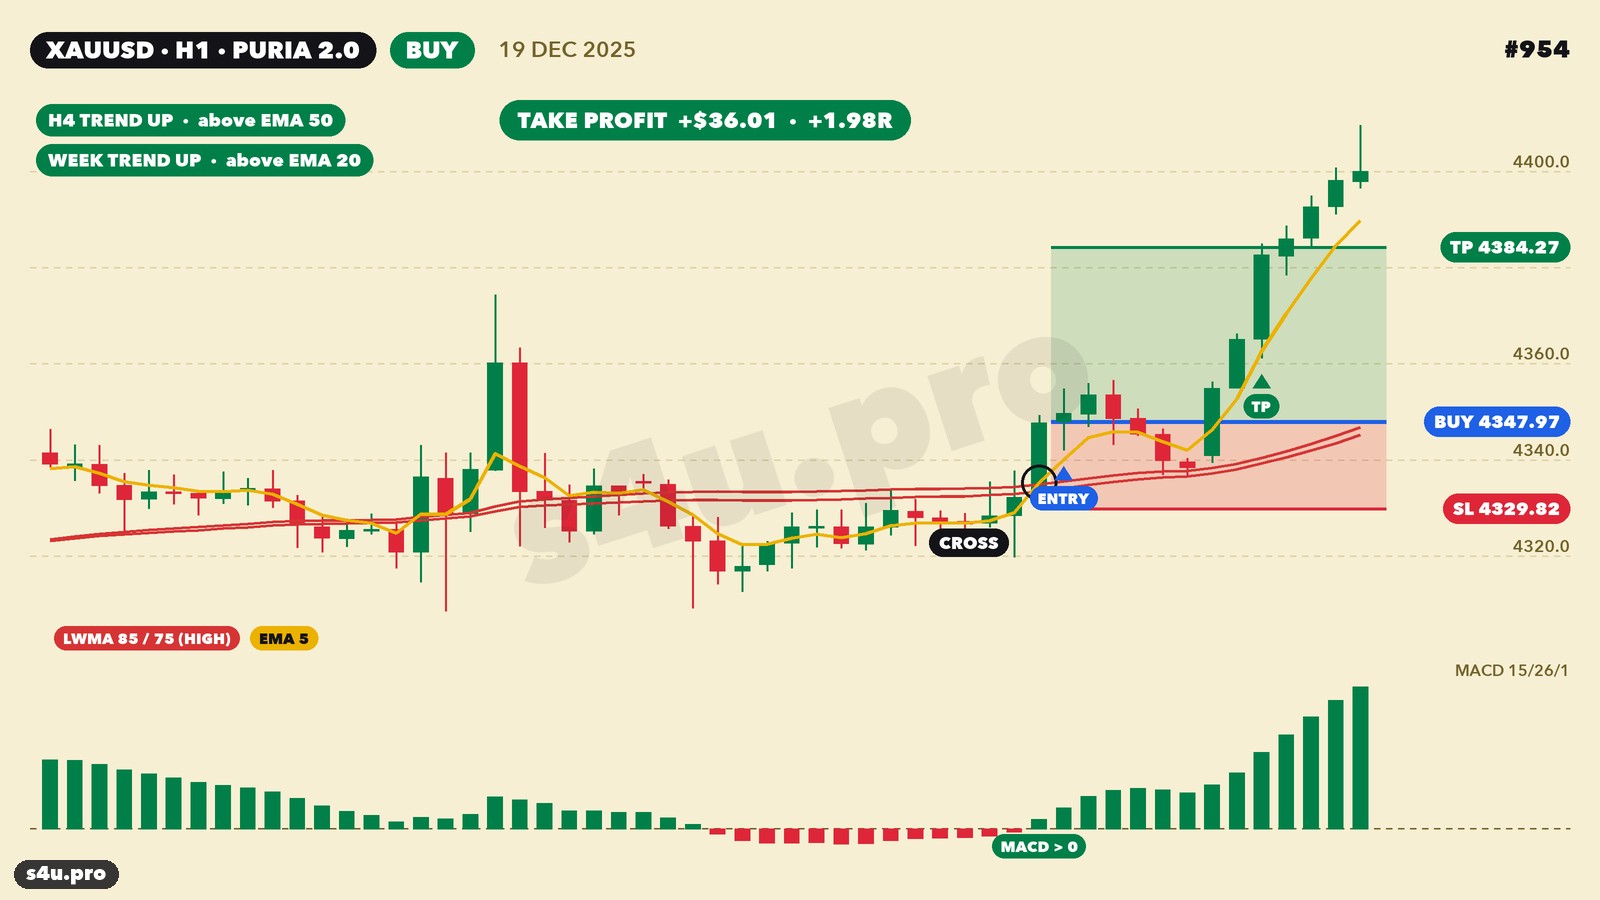
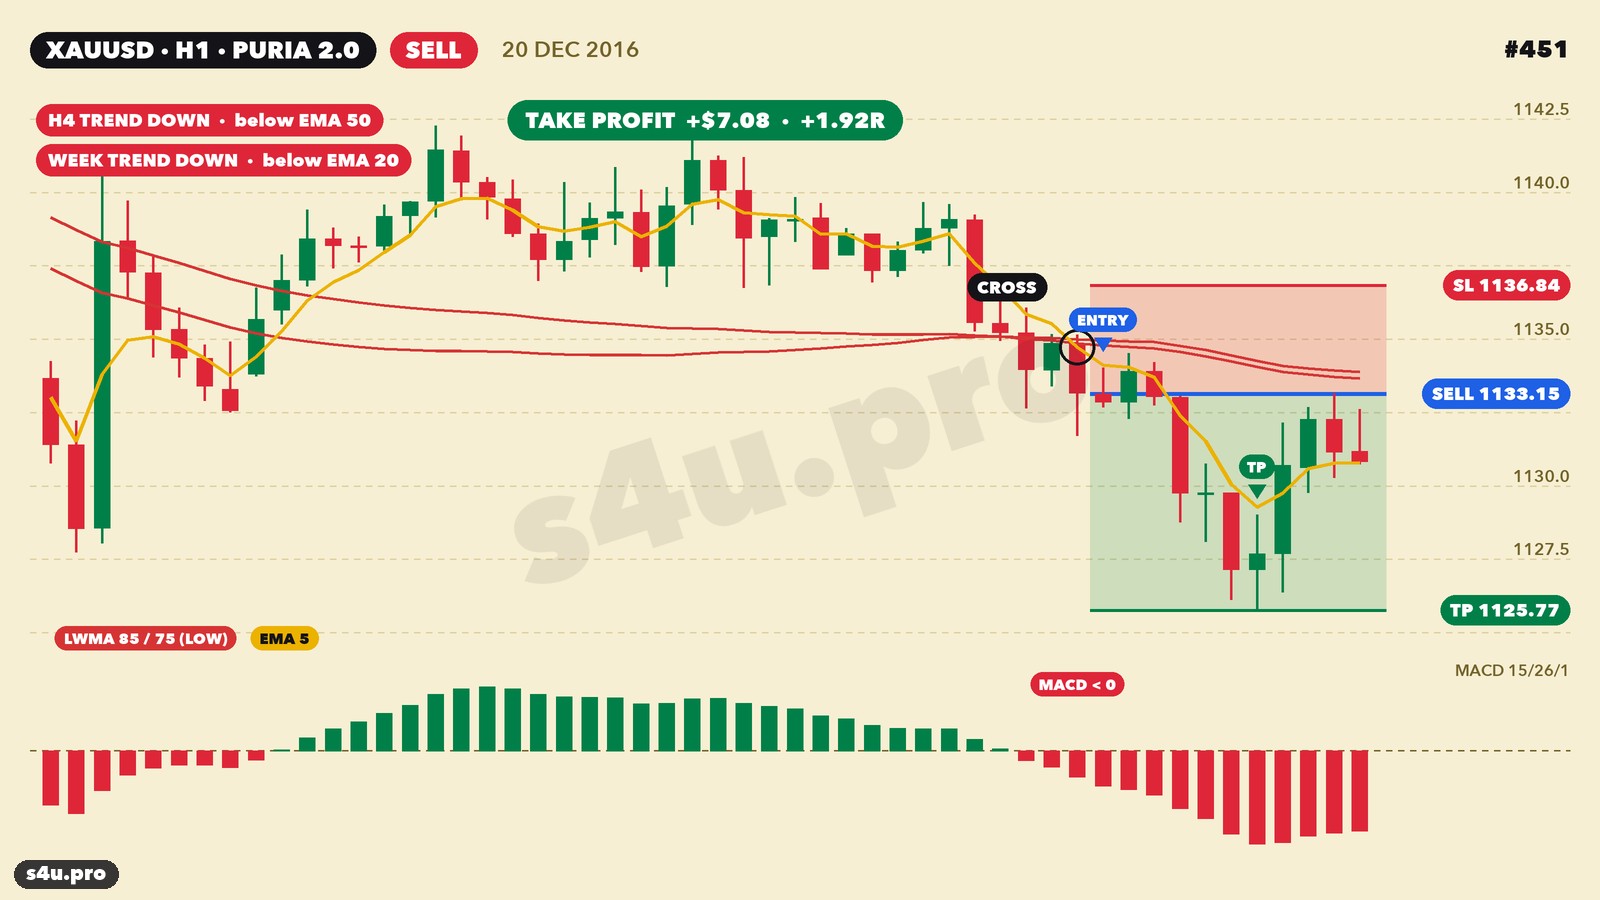
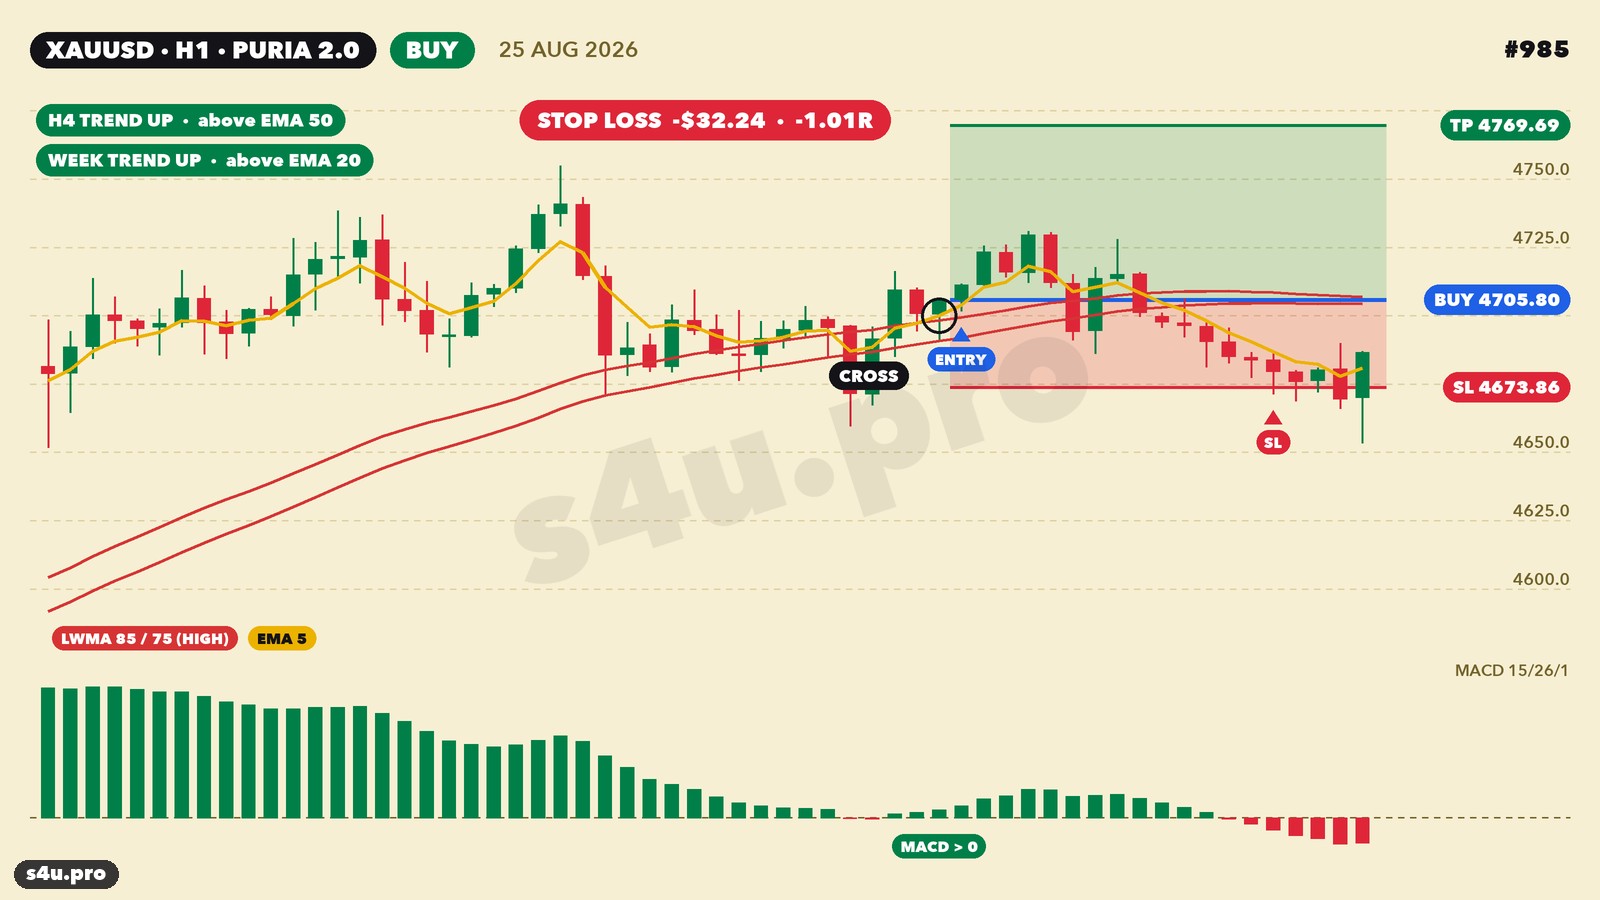
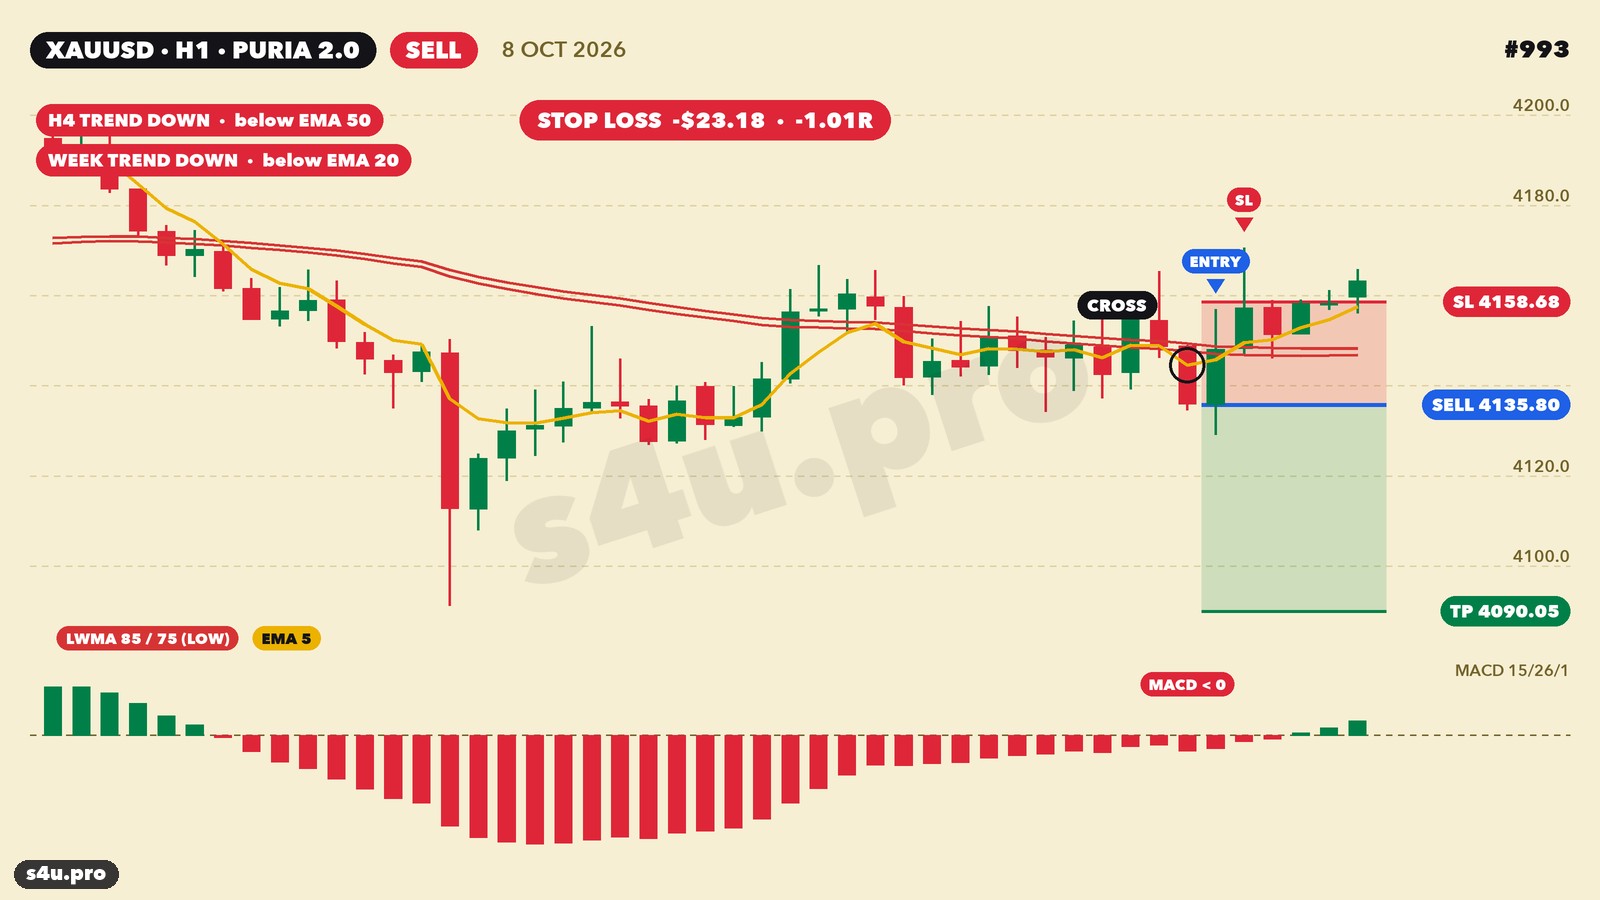
Su ogni grafico: le linee rosse sono le LWMA 85 e 75 (su High per gli acquisti, su Low per le vendite), quella gialla è la EMA 5, il cerchio indica l’incrocio, in basso c’è il MACD. In alto a sinistra la direzione del trend H4 e settimanale. La linea blu è l’ingresso, la rossa lo stop, la verde il take profit.
Acquisto: agosto 2026 — +$47 per oncia
Settimana e H4 puntano in alto. La EMA 5 ha incrociato entrambe le LWMA su High dal basso, MACD sopra lo zero. Stop $24, take profit $47. Il prezzo è salito subito dopo l’ingresso e ha chiuso al take profit.
Vendita: ottobre 2026 — +$35
Settimana e H4 si sono girati al ribasso. La EMA 5 ha incrociato le LWMA su Low dall’alto, MACD sotto lo zero — una vendita a favore del trend, take profit 2R.
Acquisto: dicembre 2025 — +$36
Vendita: dicembre 2016 — +$7
Una vecchia operazione per confronto: nel 2016 l’oro costava circa $1,150 e lo stop era di soli $3.7. Le regole sono le stesse — cambia solo la dimensione in dollari.
Ed ecco come appaiono le perdite
Agosto 2026, acquisto: l’incrocio c’è stato, ma il rialzo non è proseguito — il prezzo si è girato e ha preso lo stop.
Ottobre 2026, vendita: ingresso a favore del trend ribassista, ma il prezzo è schizzato sopra lo stop.
Sei operazioni su dieci si chiudono allo stop — è normale per una strategia con take profit 2R. Il guadagno arriva da quel 39% in cui il take profit è il doppio dello stop.
Galleria: tutte le operazioni sull’oro 2024–2026
Ecco tutte le 148 operazioni Puria 2.0 sull’oro del periodo del test alla cieca — senza selezione, vincenti e perdenti. 2024–2025 sono quotazioni Alpari, il 2026 quotazioni del future GC. Filtra per risultato, direzione e anno, e clicca su un’immagine per aprire il grafico.
Tabella delle operazioni 2024–2026
| # | Mercato | Apertura | Tipo | Entrata | Stop | Target | Uscita | Risultato | $ per oncia | R | Grafico |
|---|---|---|---|---|---|---|---|---|---|---|---|
| 847 | XAUUSD | 02.01.24 12:00 | BUY | 2077.04 | 2070.81 | 2089.50 | 2070.81 | SL | -6.53 | -1.05R | |
| 848 | XAUUSD | 23.01.24 08:00 | BUY | 2030.62 | 2025.07 | 2041.72 | 2025.07 | SL | -5.85 | -1.05R | |
| 849 | XAUUSD | 24.01.24 01:00 | BUY | 2029.18 | 2023.08 | 2041.39 | 2023.08 | SL | -6.40 | -1.05R | |
| 850 | XAUUSD | 01.02.24 18:00 | BUY | 2051.77 | 2042.63 | 2070.05 | 2042.63 | SL | -9.44 | -1.03R | |
| 851 | XAUUSD | 06.02.24 21:00 | BUY | 2036.37 | 2029.73 | 2049.65 | 2029.73 | SL | -6.94 | -1.04R | |
| 852 | XAUUSD | 22.02.24 05:00 | BUY | 2027.59 | 2023.22 | 2036.33 | 2023.22 | SL | -4.67 | -1.07R | |
| 853 | XAUUSD | 23.02.24 19:00 | BUY | 2038.23 | 2031.90 | 2050.90 | 2031.90 | SL | -6.63 | -1.05R | |
| 854 | XAUUSD | 27.02.24 04:00 | BUY | 2033.51 | 2029.11 | 2042.31 | 2029.11 | SL | -4.70 | -1.07R | |
| 855 | XAUUSD | 29.02.24 01:00 | BUY | 2035.14 | 2030.58 | 2044.26 | 2030.58 | SL | -4.86 | -1.07R | |
| 856 | XAUUSD | 29.02.24 16:00 | BUY | 2047.43 | 2041.70 | 2058.88 | 2041.70 | SL | -6.03 | -1.05R | |
| 857 | XAUUSD | 13.03.24 21:00 | BUY | 2174.75 | 2167.29 | 2189.67 | 2167.29 | SL | -7.76 | -1.04R | |
| 858 | XAUUSD | 15.03.24 12:00 | BUY | 2171.65 | 2165.97 | 2183.01 | 2165.97 | SL | -5.98 | -1.05R | |
| 859 | XAUUSD | 20.03.24 21:00 | BUY | 2181.82 | 2173.45 | 2198.55 | 2198.55 | TP | +16.43 | +1.96R | |
| 860 | XAUUSD | 22.03.24 03:00 | BUY | 2184.91 | 2175.64 | 2203.46 | 2175.64 | SL | -9.57 | -1.03R | |
| 861 | XAUUSD | 26.03.24 12:00 | BUY | 2190.84 | 2183.25 | 2206.02 | 2183.25 | SL | -7.89 | -1.04R | |
| 862 | XAUUSD | 27.03.24 10:00 | BUY | 2180.40 | 2173.50 | 2194.20 | 2194.20 | TP | +13.50 | +1.96R | |
| 863 | XAUUSD | 05.04.24 17:00 | BUY | 2299.70 | 2287.26 | 2324.58 | 2324.58 | TP | +24.58 | +1.98R | |
| 864 | XAUUSD | 11.04.24 21:00 | BUY | 2356.20 | 2343.31 | 2381.98 | 2381.98 | TP | +25.48 | +1.98R | |
| 865 | XAUUSD | 15.04.24 23:00 | BUY | 2386.08 | 2366.60 | 2425.05 | 2366.60 | SL | -19.78 | -1.01R | |
| 866 | XAUUSD | 16.04.24 19:00 | BUY | 2385.85 | 2369.48 | 2418.58 | 2369.48 | SL | -16.67 | -1.02R | |
| 867 | XAUUSD | 18.04.24 20:00 | BUY | 2387.79 | 2375.75 | 2411.87 | 2375.75 | SL | -12.34 | -1.02R | |
| 868 | XAUUSD | 19.04.24 05:00 | BUY | 2409.19 | 2395.56 | 2436.46 | 2395.56 | SL | -13.93 | -1.02R | |
| 869 | XAUUSD | 19.04.24 19:00 | BUY | 2394.75 | 2380.03 | 2424.18 | 2380.03 | SL | -15.02 | -1.02R | |
| 870 | XAUUSD | 29.04.24 20:00 | BUY | 2342.90 | 2332.10 | 2364.49 | 2332.10 | SL | -11.10 | -1.03R | |
| 871 | XAUUSD | 09.05.24 17:00 | BUY | 2324.11 | 2314.85 | 2342.64 | 2342.64 | TP | +18.23 | +1.97R | |
| 872 | XAUUSD | 14.05.24 21:00 | BUY | 2355.68 | 2346.42 | 2374.20 | 2374.20 | TP | +18.22 | +1.97R | |
| 873 | XAUUSD | 17.05.24 10:00 | BUY | 2385.81 | 2378.61 | 2400.21 | 2400.21 | TP | +14.10 | +1.96R | |
| 874 | XAUUSD | 31.05.24 16:00 | BUY | 2354.77 | 2346.49 | 2371.34 | 2346.49 | SL | -8.58 | -1.04R | |
| 875 | XAUUSD | 03.06.24 20:00 | BUY | 2349.09 | 2338.65 | 2369.98 | 2338.65 | SL | -10.74 | -1.03R | |
| 876 | XAUUSD | 02.07.24 11:00 | BUY | 2330.87 | 2324.01 | 2344.59 | 2324.01 | SL | -7.16 | -1.04R | |
| 877 | XAUUSD | 03.07.24 08:00 | BUY | 2334.48 | 2327.97 | 2347.50 | 2347.50 | TP | +12.72 | +1.95R | |
| 878 | XAUUSD | 10.07.24 11:00 | BUY | 2372.65 | 2365.99 | 2385.97 | 2385.97 | TP | +13.02 | +1.96R | |
| 879 | XAUUSD | 16.08.24 13:00 | BUY | 2463.34 | 2455.08 | 2479.85 | 2479.85 | TP | +16.21 | +1.96R | |
| 880 | XAUUSD | 23.08.24 19:00 | BUY | 2510.00 | 2499.98 | 2530.03 | 2499.98 | SL | -10.31 | -1.03R | |
| 881 | XAUUSD | 29.08.24 09:00 | BUY | 2518.77 | 2511.28 | 2533.76 | 2511.28 | SL | -7.79 | -1.04R | |
| 882 | XAUUSD | 30.08.24 12:00 | BUY | 2522.95 | 2514.95 | 2538.94 | 2514.95 | SL | -8.30 | -1.04R | |
| 883 | XAUUSD | 10.09.24 16:00 | BUY | 2514.03 | 2506.94 | 2528.22 | 2506.94 | SL | -7.39 | -1.04R | |
| 884 | XAUUSD | 12.09.24 08:00 | BUY | 2517.18 | 2510.76 | 2530.03 | 2530.03 | TP | +12.55 | +1.95R | |
| 885 | XAUUSD | 19.09.24 12:00 | BUY | 2584.93 | 2573.05 | 2608.68 | 2573.05 | SL | -12.18 | -1.02R | |
| 886 | XAUUSD | 01.10.24 17:00 | BUY | 2667.00 | 2657.23 | 2686.53 | 2657.23 | SL | -10.07 | -1.03R | |
| 887 | XAUUSD | 03.10.24 01:00 | BUY | 2657.97 | 2648.34 | 2677.23 | 2648.34 | SL | -9.93 | -1.03R | |
| 888 | XAUUSD | 04.10.24 05:00 | BUY | 2658.31 | 2650.34 | 2674.24 | 2650.34 | SL | -8.27 | -1.04R | |
| 889 | XAUUSD | 15.10.24 19:00 | BUY | 2664.70 | 2654.58 | 2684.94 | 2684.94 | TP | +19.93 | +1.97R | |
| 890 | XAUUSD | 24.10.24 16:00 | BUY | 2739.09 | 2731.07 | 2755.13 | 2731.07 | SL | -8.32 | -1.04R | |
| 891 | XAUUSD | 25.10.24 20:00 | BUY | 2739.19 | 2729.76 | 2758.05 | 2729.76 | SL | -9.73 | -1.03R | |
| 892 | XAUUSD | 28.10.24 09:00 | BUY | 2740.73 | 2731.36 | 2759.47 | 2731.36 | SL | -9.67 | -1.03R | |
| 893 | XAUUSD | 28.10.24 16:00 | BUY | 2740.85 | 2731.24 | 2760.08 | 2760.08 | TP | +18.93 | +1.97R | |
| 894 | XAUUSD | 27.11.24 16:00 | BUY | 2656.20 | 2645.27 | 2678.06 | 2645.27 | SL | -11.23 | -1.03R | |
| 895 | XAUUSD | 28.11.24 13:00 | BUY | 2647.59 | 2637.92 | 2666.92 | 2637.92 | SL | -9.97 | -1.03R | |
| 896 | XAUUSD | 29.11.24 05:00 | BUY | 2657.43 | 2647.71 | 2676.87 | 2647.71 | SL | -10.02 | -1.03R | |
| 897 | XAUUSD | 04.12.24 08:00 | BUY | 2649.79 | 2641.41 | 2666.56 | 2641.41 | SL | -8.68 | -1.04R | |
| 898 | XAUUSD | 04.12.24 18:00 | BUY | 2655.06 | 2644.79 | 2675.61 | 2644.79 | SL | -10.57 | -1.03R | |
| 899 | XAUUSD | 05.12.24 08:00 | BUY | 2653.05 | 2644.44 | 2670.27 | 2644.44 | SL | -8.91 | -1.03R | |
| 900 | XAUUSD | 07.01.25 15:00 | BUY | 2651.39 | 2643.03 | 2668.10 | 2643.03 | SL | -8.65 | -1.04R | |
| 901 | XAUUSD | 15.01.25 09:00 | BUY | 2681.07 | 2673.75 | 2695.71 | 2695.71 | TP | +14.34 | +1.96R | |
| 902 | XAUUSD | 21.01.25 04:00 | BUY | 2718.09 | 2707.81 | 2738.65 | 2738.65 | TP | +20.25 | +1.97R | |
| 903 | XAUUSD | 23.01.25 20:00 | BUY | 2757.75 | 2747.89 | 2777.47 | 2777.47 | TP | +19.42 | +1.97R | |
| 904 | XAUUSD | 28.01.25 21:00 | BUY | 2762.19 | 2754.44 | 2777.69 | 2754.44 | SL | -8.05 | -1.04R | |
| 905 | XAUUSD | 30.01.25 03:00 | BUY | 2762.06 | 2754.32 | 2777.53 | 2777.53 | TP | +15.17 | +1.96R | |
| 906 | XAUUSD | 07.02.25 05:00 | BUY | 2868.76 | 2858.87 | 2888.54 | 2858.87 | SL | -10.19 | -1.03R | |
| 907 | XAUUSD | 10.02.25 04:00 | BUY | 2871.97 | 2860.16 | 2895.59 | 2895.59 | TP | +23.32 | +1.98R | |
| 908 | XAUUSD | 13.02.25 02:00 | BUY | 2905.80 | 2893.52 | 2930.36 | 2930.36 | TP | +24.27 | +1.98R | |
| 909 | XAUUSD | 18.02.25 11:00 | BUY | 2912.41 | 2903.30 | 2930.63 | 2930.63 | TP | +17.92 | +1.97R | |
| 910 | XAUUSD | 24.02.25 11:00 | BUY | 2946.32 | 2934.27 | 2970.42 | 2934.27 | SL | -12.35 | -1.02R | |
| 911 | XAUUSD | 07.03.25 12:00 | BUY | 2921.55 | 2910.77 | 2943.11 | 2910.77 | SL | -11.08 | -1.03R | |
| 912 | XAUUSD | 07.03.25 17:00 | BUY | 2926.84 | 2913.77 | 2952.97 | 2913.77 | SL | -13.37 | -1.02R | |
| 913 | XAUUSD | 11.03.25 14:00 | BUY | 2913.56 | 2902.83 | 2935.01 | 2935.01 | TP | +21.15 | +1.97R | |
| 914 | XAUUSD | 20.03.25 21:00 | BUY | 3043.30 | 3032.08 | 3065.74 | 3032.08 | SL | -11.52 | -1.03R | |
| 915 | XAUUSD | 26.03.25 10:00 | BUY | 3030.46 | 3021.74 | 3047.90 | 3021.74 | SL | -9.02 | -1.03R | |
| 916 | XAUUSD | 26.03.25 14:00 | BUY | 3027.69 | 3018.29 | 3046.49 | 3018.29 | SL | -9.70 | -1.03R | |
| 917 | XAUUSD | 27.03.25 05:00 | BUY | 3031.61 | 3023.09 | 3048.64 | 3048.64 | TP | +16.73 | +1.97R | |
| 918 | XAUUSD | 02.04.25 05:00 | BUY | 3133.02 | 3118.90 | 3161.25 | 3118.90 | SL | -14.42 | -1.02R | |
| 919 | XAUUSD | 02.04.25 12:00 | BUY | 3131.39 | 3117.13 | 3159.91 | 3117.13 | SL | -14.56 | -1.02R | |
| 920 | XAUUSD | 03.04.25 02:00 | BUY | 3145.83 | 3126.97 | 3183.55 | 3126.97 | SL | -19.16 | -1.02R | |
| 921 | XAUUSD | 15.04.25 06:00 | BUY | 3224.20 | 3206.81 | 3258.97 | 3258.97 | TP | +34.47 | +1.98R | |
| 922 | XAUUSD | 28.04.25 20:00 | BUY | 3336.78 | 3311.36 | 3387.61 | 3311.36 | SL | -25.72 | -1.01R | |
| 923 | XAUUSD | 08.05.25 05:00 | BUY | 3408.69 | 3385.18 | 3455.71 | 3385.18 | SL | -23.81 | -1.01R | |
| 924 | XAUUSD | 23.05.25 09:00 | BUY | 3323.99 | 3304.90 | 3362.18 | 3362.18 | TP | +37.89 | +1.98R | |
| 925 | XAUUSD | 26.05.25 19:00 | BUY | 3337.81 | 3324.10 | 3365.22 | 3324.10 | SL | -14.01 | -1.02R | |
| 926 | XAUUSD | 29.05.25 19:00 | BUY | 3321.48 | 3302.09 | 3360.27 | 3302.09 | SL | -19.69 | -1.01R | |
| 927 | XAUUSD | 02.06.25 04:00 | BUY | 3311.20 | 3293.51 | 3346.58 | 3346.58 | TP | +35.08 | +1.98R | |
| 928 | XAUUSD | 04.06.25 12:00 | BUY | 3363.03 | 3347.75 | 3393.60 | 3347.75 | SL | -15.58 | -1.02R | |
| 929 | XAUUSD | 04.06.25 18:00 | BUY | 3377.50 | 3358.93 | 3414.65 | 3358.93 | SL | -18.87 | -1.02R | |
| 930 | XAUUSD | 10.06.25 17:00 | BUY | 3343.79 | 3329.22 | 3372.94 | 3329.22 | SL | -14.87 | -1.02R | |
| 931 | XAUUSD | 08.07.25 02:00 | BUY | 3339.88 | 3327.68 | 3364.28 | 3327.68 | SL | -12.50 | -1.02R | |
| 932 | XAUUSD | 18.07.25 12:00 | BUY | 3347.63 | 3336.98 | 3368.93 | 3368.93 | TP | +21.00 | +1.97R | |
| 933 | XAUUSD | 01.08.25 16:00 | BUY | 3341.11 | 3325.18 | 3372.96 | 3372.96 | TP | +31.55 | +1.98R | |
| 934 | XAUUSD | 07.08.25 06:00 | BUY | 3379.43 | 3368.56 | 3401.17 | 3401.17 | TP | +21.44 | +1.97R | |
| 935 | XAUUSD | 08.08.25 22:00 | BUY | 3395.62 | 3376.21 | 3434.44 | 3376.21 | SL | -19.71 | -1.01R | |
| 936 | XAUUSD | 14.08.25 04:00 | BUY | 3369.29 | 3358.36 | 3391.14 | 3358.36 | SL | -11.22 | -1.03R | |
| 937 | XAUUSD | 27.08.25 18:00 | BUY | 3386.32 | 3376.39 | 3406.18 | 3406.18 | TP | +19.56 | +1.97R | |
| 938 | XAUUSD | 10.09.25 06:00 | BUY | 3636.04 | 3619.56 | 3669.00 | 3619.56 | SL | -16.78 | -1.02R | |
| 939 | XAUUSD | 12.09.25 07:00 | BUY | 3652.85 | 3640.32 | 3677.92 | 3640.32 | SL | -12.83 | -1.02R | |
| 940 | XAUUSD | 15.09.25 17:00 | BUY | 3657.24 | 3644.80 | 3682.12 | 3682.12 | TP | +24.58 | +1.98R | |
| 941 | XAUUSD | 19.09.25 21:00 | BUY | 3678.80 | 3663.90 | 3708.61 | 3708.61 | TP | +29.51 | +1.98R | |
| 942 | XAUUSD | 26.09.25 18:00 | BUY | 3778.77 | 3761.37 | 3813.57 | 3761.37 | SL | -17.70 | -1.02R | |
| 943 | XAUUSD | 03.10.25 17:00 | BUY | 3883.31 | 3865.80 | 3918.33 | 3918.33 | TP | +34.72 | +1.98R | |
| 944 | XAUUSD | 13.10.25 02:00 | BUY | 4042.09 | 4010.44 | 4105.40 | 4105.40 | TP | +63.01 | +1.99R | |
| 945 | XAUUSD | 20.10.25 17:00 | BUY | 4300.48 | 4259.23 | 4382.98 | 4259.23 | SL | -41.55 | -1.01R | |
| 946 | XAUUSD | 14.11.25 05:00 | BUY | 4206.96 | 4177.19 | 4266.50 | 4177.19 | SL | -30.07 | -1.01R | |
| 947 | XAUUSD | 19.11.25 08:00 | BUY | 4095.39 | 4068.87 | 4148.43 | 4068.87 | SL | -26.82 | -1.01R | |
| 948 | XAUUSD | 21.11.25 21:00 | BUY | 4082.81 | 4050.02 | 4148.39 | 4050.02 | SL | -33.09 | -1.01R | |
| 949 | XAUUSD | 27.11.25 10:00 | BUY | 4160.02 | 4142.84 | 4194.39 | 4194.39 | TP | +34.07 | +1.98R | |
| 950 | XAUUSD | 05.12.25 08:00 | BUY | 4220.71 | 4204.54 | 4253.04 | 4253.04 | TP | +32.03 | +1.98R | |
| 951 | XAUUSD | 09.12.25 22:00 | BUY | 4212.13 | 4194.02 | 4248.36 | 4194.02 | SL | -18.41 | -1.02R | |
| 952 | XAUUSD | 10.12.25 23:00 | BUY | 4229.66 | 4210.08 | 4268.82 | 4210.08 | SL | -19.88 | -1.01R | |
| 953 | XAUUSD | 17.12.25 04:00 | BUY | 4326.52 | 4305.57 | 4368.42 | 4368.42 | TP | +41.60 | +1.99R | |
| 954 | XAUUSD | 19.12.25 18:00 | BUY | 4347.97 | 4329.82 | 4384.27 | 4384.27 | TP | +36.01 | +1.98R | |
| 955 | XAUUSD | 08.01.26 23:00 | BUY | 4489.30 | 4465.23 | 4537.45 | 4465.23 | SL | -24.37 | -1.01R | |
| 956 | XAUUSD | 20.01.26 06:00 | BUY | 4720.70 | 4682.37 | 4797.35 | 4797.35 | TP | +76.35 | +1.99R | |
| 957 | XAUUSD | 29.01.26 23:00 | BUY | 5410.00 | 5290.67 | 5648.66 | 5290.67 | SL | -119.63 | -1.00R | |
| 958 | XAUUSD | 06.02.26 16:00 | BUY | 4967.80 | 4888.65 | 5126.09 | 5126.09 | TP | +157.99 | +2.00R | |
| 959 | XAUUSD | 18.02.26 16:00 | BUY | 5018.90 | 4982.33 | 5092.04 | 4982.33 | SL | -36.87 | -1.01R | |
| 960 | XAUUSD | 25.02.26 04:00 | BUY | 5200.10 | 5160.52 | 5279.26 | 5160.52 | SL | -39.88 | -1.01R | |
| 961 | XAUUSD | 27.02.26 14:00 | BUY | 5240.80 | 5210.59 | 5301.22 | 5301.22 | TP | +60.12 | +1.99R | |
| 962 | XAUUSD | 24.03.26 13:00 | SELL | 4379.00 | 4468.94 | 4199.12 | 4468.94 | SL | -90.24 | -1.00R | |
| 963 | XAUUSD | 26.03.26 09:00 | SELL | 4425.40 | 4482.01 | 4312.17 | 4482.01 | SL | -56.91 | -1.00R | |
| 964 | XAUUSD | 07.04.26 22:00 | BUY | 4747.20 | 4700.66 | 4840.28 | 4840.28 | TP | +92.78 | +1.99R | |
| 965 | XAUUSD | 09.04.26 14:00 | BUY | 4790.00 | 4752.02 | 4865.95 | 4752.02 | SL | -38.28 | -1.01R | |
| 966 | XAUUSD | 14.04.26 01:00 | BUY | 4792.70 | 4761.50 | 4855.09 | 4855.09 | TP | +62.09 | +1.99R | |
| 967 | XAUUSD | 16.04.26 00:00 | BUY | 4845.40 | 4818.59 | 4899.02 | 4818.59 | SL | -27.11 | -1.01R | |
| 968 | XAUUSD | 17.04.26 14:00 | BUY | 4903.30 | 4870.86 | 4968.18 | 4870.86 | SL | -32.74 | -1.01R | |
| 969 | XAUUSD | 04.05.26 09:00 | SELL | 4587.90 | 4615.70 | 4532.30 | 4532.30 | TP | +55.30 | +1.99R | |
| 970 | XAUUSD | 11.05.26 16:00 | BUY | 4742.00 | 4708.03 | 4809.93 | 4708.03 | SL | -34.27 | -1.01R | |
| 971 | XAUUSD | 19.05.26 03:00 | SELL | 4549.90 | 4581.76 | 4486.17 | 4486.17 | TP | +63.43 | +1.99R | |
| 972 | XAUUSD | 26.05.26 17:00 | SELL | 4504.90 | 4531.91 | 4450.88 | 4450.88 | TP | +53.72 | +1.99R | |
| 973 | XAUUSD | 01.06.26 14:00 | SELL | 4479.10 | 4509.37 | 4418.56 | 4509.37 | SL | -30.57 | -1.01R | |
| 974 | XAUUSD | 02.06.26 18:00 | SELL | 4514.30 | 4538.09 | 4466.71 | 4466.71 | TP | +47.29 | +1.99R | |
| 975 | XAUUSD | 05.06.26 02:00 | SELL | 4473.40 | 4499.05 | 4422.11 | 4499.05 | SL | -25.95 | -1.01R | |
| 976 | XAUUSD | 05.06.26 13:00 | SELL | 4432.00 | 4460.88 | 4374.24 | 4374.24 | TP | +57.46 | +1.99R | |
| 977 | XAUUSD | 17.06.26 20:00 | SELL | 4254.20 | 4294.72 | 4173.16 | 4294.72 | SL | -40.82 | -1.01R | |
| 978 | XAUUSD | 26.06.26 03:00 | SELL | 4005.90 | 4039.67 | 3938.37 | 4039.67 | SL | -34.07 | -1.01R | |
| 979 | XAUUSD | 29.06.26 18:00 | SELL | 4035.70 | 4063.79 | 3979.52 | 3979.52 | TP | +55.88 | +1.99R | |
| 980 | XAUUSD | 30.06.26 23:00 | SELL | 4026.50 | 4053.33 | 3972.85 | 4053.33 | SL | -27.13 | -1.01R | |
| 981 | XAUUSD | 12.07.26 23:00 | SELL | 4084.00 | 4108.10 | 4035.81 | 4035.81 | TP | +47.89 | +1.99R | |
| 982 | XAUUSD | 16.07.26 06:00 | SELL | 4032.40 | 4055.87 | 3985.46 | 3985.46 | TP | +46.64 | +1.99R | |
| 983 | XAUUSD | 12.08.26 01:00 | BUY | 4440.30 | 4416.67 | 4487.56 | 4487.56 | TP | +46.96 | +1.99R | |
| 984 | XAUUSD | 17.08.26 01:00 | BUY | 4457.10 | 4432.85 | 4505.59 | 4432.85 | SL | -24.55 | -1.01R | |
| 985 | XAUUSD | 25.08.26 18:00 | BUY | 4705.80 | 4673.86 | 4769.69 | 4673.86 | SL | -32.24 | -1.01R | |
| 986 | XAUUSD | 16.09.26 22:00 | SELL | 4301.40 | 4340.43 | 4223.33 | 4340.43 | SL | -39.33 | -1.01R | |
| 987 | XAUUSD | 28.09.26 00:00 | SELL | 4294.20 | 4319.01 | 4244.58 | 4244.58 | TP | +49.32 | +1.99R | |
| 988 | XAUUSD | 30.09.26 19:00 | SELL | 4182.80 | 4206.47 | 4135.46 | 4206.47 | SL | -23.97 | -1.01R | |
| 989 | XAUUSD | 02.10.26 16:00 | SELL | 4156.20 | 4190.94 | 4086.71 | 4190.94 | SL | -35.04 | -1.01R | |
| 990 | XAUUSD | 05.10.26 14:00 | SELL | 4163.00 | 4188.59 | 4111.82 | 4188.59 | SL | -25.89 | -1.01R | |
| 991 | XAUUSD | 07.10.26 06:00 | SELL | 4154.80 | 4173.34 | 4117.71 | 4117.71 | TP | +36.79 | +1.98R | |
| 992 | XAUUSD | 08.10.26 06:00 | SELL | 4141.90 | 4163.60 | 4098.49 | 4163.60 | SL | -22.00 | -1.01R | |
| 993 | XAUUSD | 08.10.26 16:00 | SELL | 4135.80 | 4158.68 | 4090.05 | 4158.68 | SL | -23.18 | -1.01R | |
| 994 | XAUUSD | 13.10.26 16:00 | SELL | 4182.20 | 4199.94 | 4146.71 | 4146.71 | TP | +35.19 | +1.98R | |
| Totale: 148 | +148.06 | +10.5R | |||||||||
- Clicca su «Scarica il diario Excel con il bot» e in Telegram tocca “Start”.
- Hai già usato il bot e il pulsante “Start” non c’è? Invia semplicemente al bot il messaggio /start.
- Se non segui ancora @strategy4you, il bot ti chiederà di iscriverti: iscriviti e tocca “✅ I’ve subscribed”. Se sei già iscritto, il bot passa subito al passo successivo.
- Il bot invia il pulsante “Get the EA for free”: toccalo per aprire la pagina bonus.
- Nella pagina trova il blocco “📊 Strategy trade journals” e clicca su “Download Excel”.
Come calcolare il lotto sull’oro
Lo stop in Puria 2.0 è diverso ogni volta, quindi il lotto va ricalcolato per ogni operazione. Su XAUUSD 1 lotto = 100 once: un movimento di $1 dà $100 con 1 lotto o $1 con 0.01 lotti. Formula: lotto = (conto × rischio %) / (stop in dollari × 100).
Esempio: conto di $5,000, rischio dell’1% = $50, stop di $35. Lotto = 50 / (35 × 100) ≈ 0.014 → 0.01. Con uno stop di $35 e un lotto minimo di 0.01, un rischio dell’1% è possibile solo da un conto di $3,500. Con un conto più piccolo il rischio per operazione sarà superiore all’1% — tienilo presente.
Risultati su USDJPY: perché lo yen è alla fine dell’articolo
La prima versione migliorata l’abbiamo trovata proprio sullo yen, e fino al 2025 sembrava migliore di qualsiasi altra coppia. Non togliamo questi risultati — mostrano onestamente come una strategia possa smettere di funzionare. Ma li abbiamo messi in fondo perché il 2026 sullo yen è stato negativo, e la causa principale sono gli interventi e i movimenti bruschi dello yen.
Prima versione migliorata (H1 + trend H4 + stop 1.5 ATR + take profit 2R)
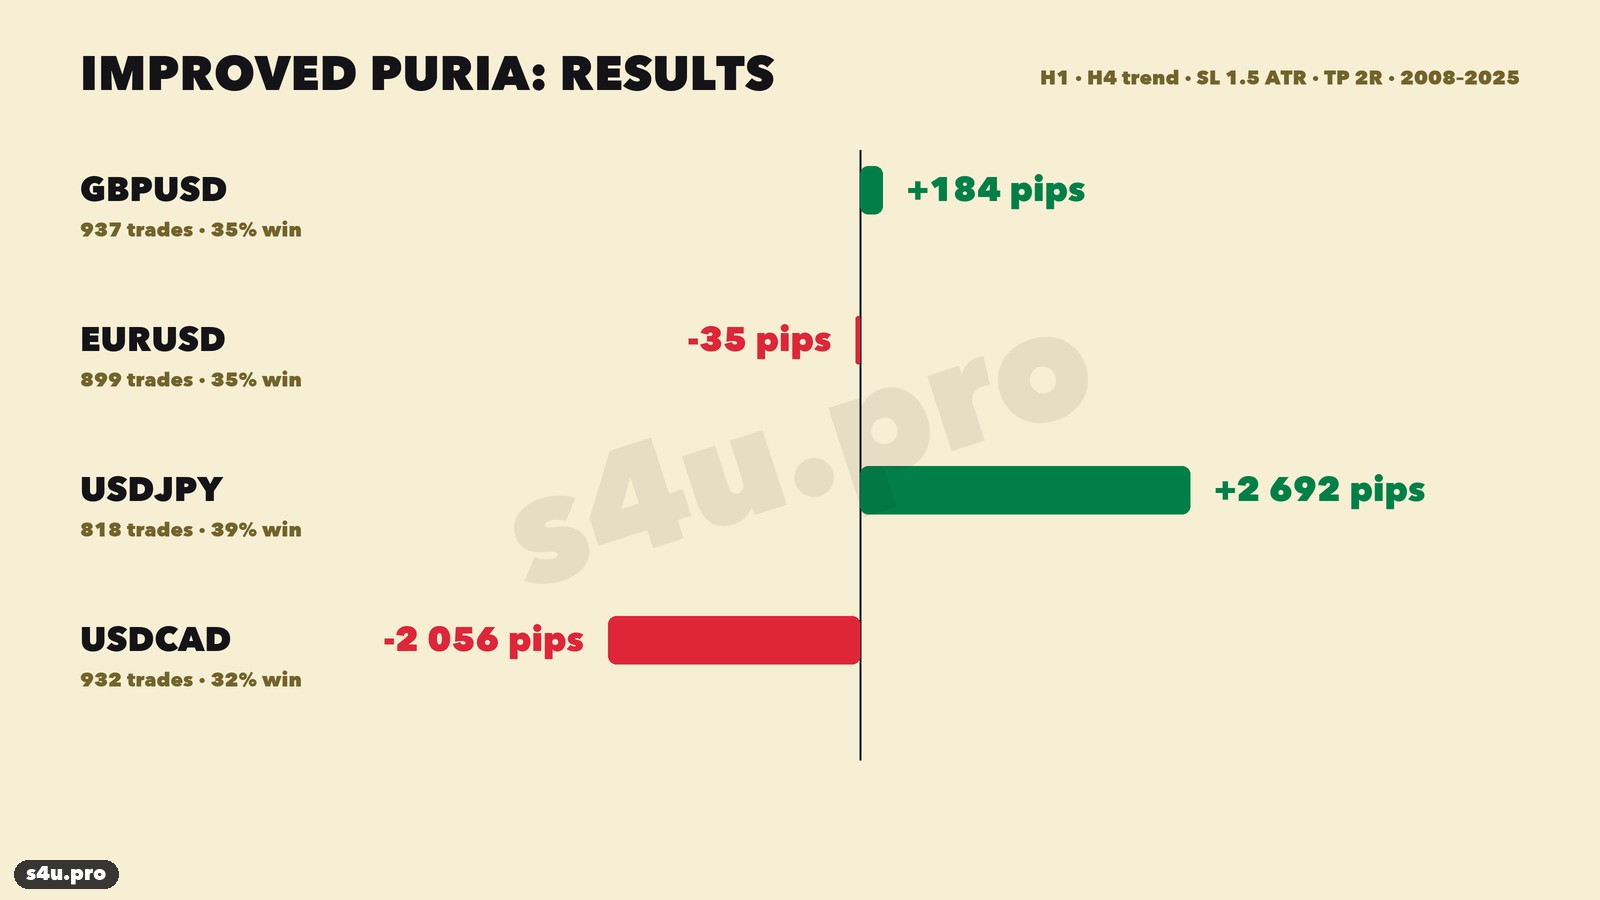
È Puria 2.0 senza gli ultimi due passi: LWMA su Low per entrambi i lati, nessun filtro settimanale. Test sul 2008–2025, spread dedotto.
| Coppia | Classico, pip | Migliorata: operazioni | Vincenti | Migliorata, pip |
|---|---|---|---|---|
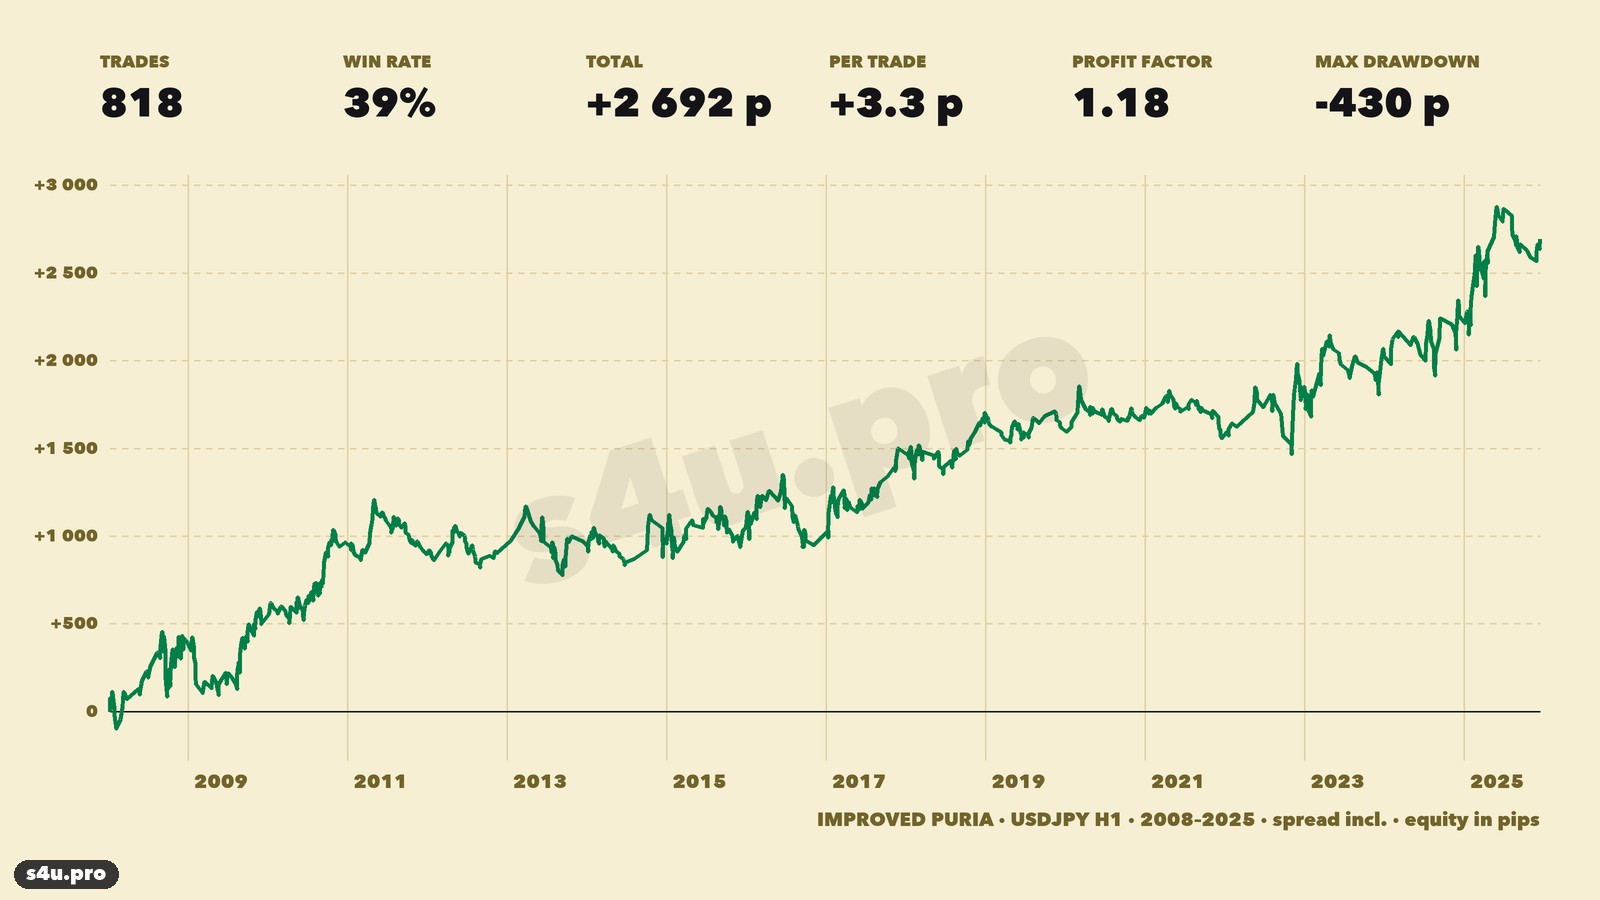
| USDJPY | −5,817 | 818 | 39% | +2,692 |
| GBPUSD | −4,688 | 937 | 35% | +184 |
| EURUSD | −3,856 | 899 | 35% | −35 |
| USDCAD | −4,914 | 932 | 32% | −2,056 |
Su USDJPY: +2,692 pip su 818 operazioni nel 2008–2025, profit factor 1.18, drawdown −430 pip, 14 anni positivi su 18. Le regole sono state scelte sul 2008–2017, e anche il 2018–2025 è stato positivo (+1,207 pip). Quasi tutto il guadagno è venuto dalle vendite (+2,860), gli acquisti hanno dato −168: con le LWMA su Low c’erano solo 55 acquisti contro 763 vendite.
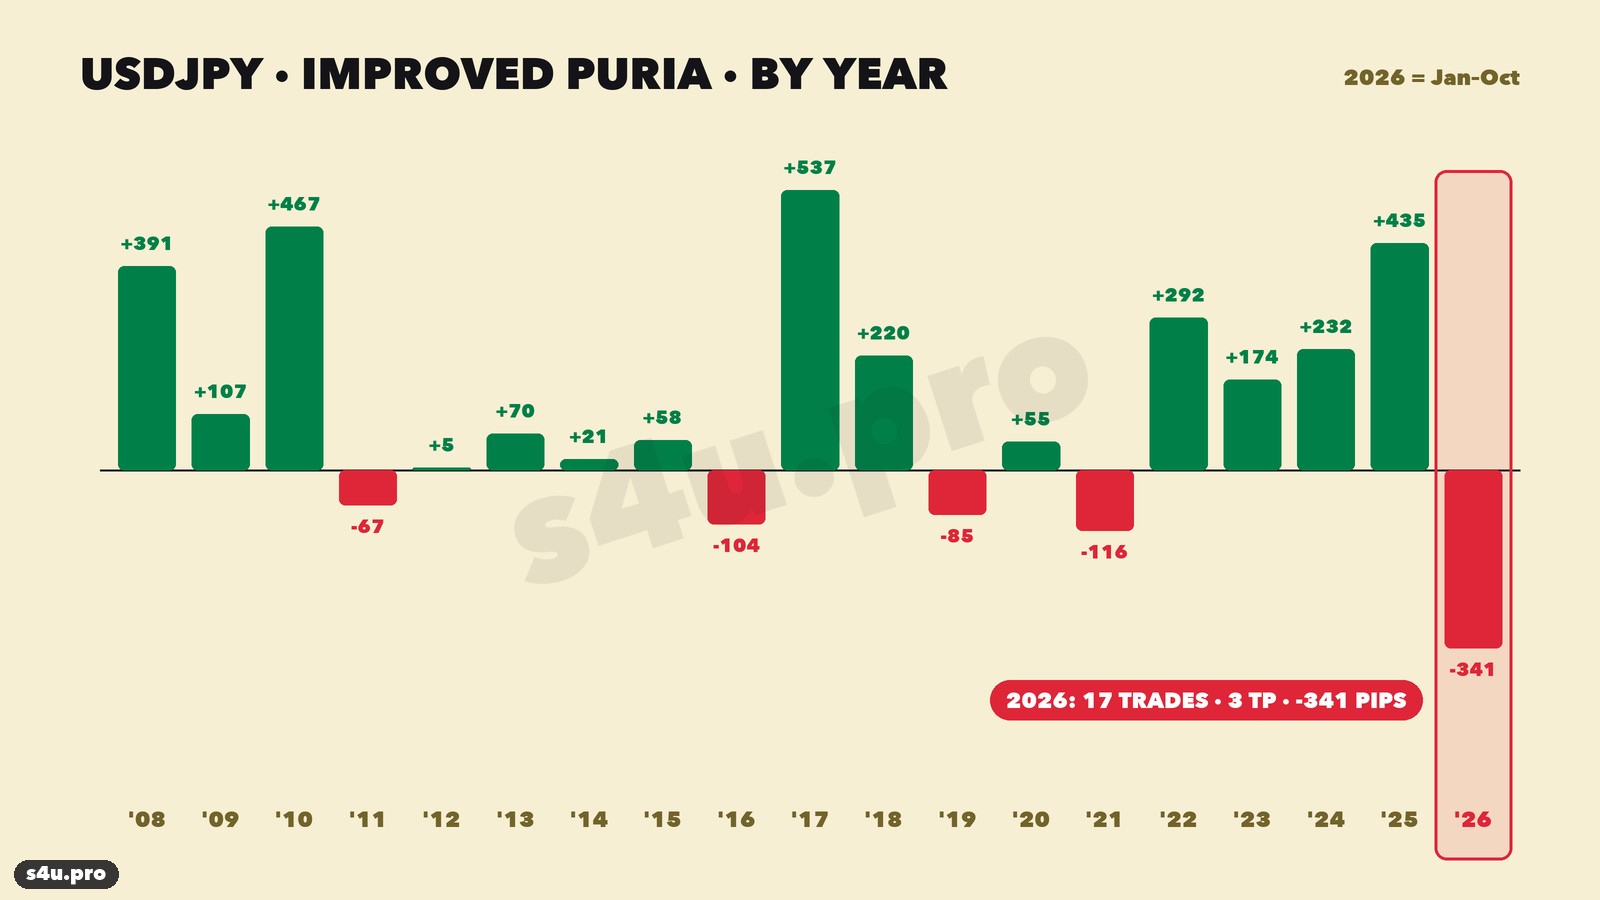
2026: −341 pip
Sulle quotazioni recenti di USDJPY H1 di gennaio–ottobre 2026 le stesse regole hanno dato 17 operazioni, 3 take profit e −341 pip. 16 operazioni su 17 erano vendite, in totale −303 pip.
Cosa è successo: nel 2026 lo yen ha continuato a indebolirsi, USDJPY è rimasto intorno a 155–162, e i crolli bruschi del cambio — anche in occasione degli interventi valutari — giravano il trend H4 al ribasso. Il filtro vedeva un «trend ribassista», la strategia vendeva e il mercato tornava presto su colpendo lo stop. Conclusione: vendere USDJPY su questo segnale oggi non è operabile.
Puria 2.0 su USDJPY: gli acquisti funzionano
Con le regole di Puria 2.0 (LWMA speculari + trend settimanale) anche lo yen è positivo sullo storico lungo: +79.9R su 1,030 operazioni nel 2008–2026, 11 anni positivi su 19. Nel 2008–2025 gli acquisti hanno dato +43.8R e le vendite +41.7R. Nel test alla cieca 2024–2025: +18R.
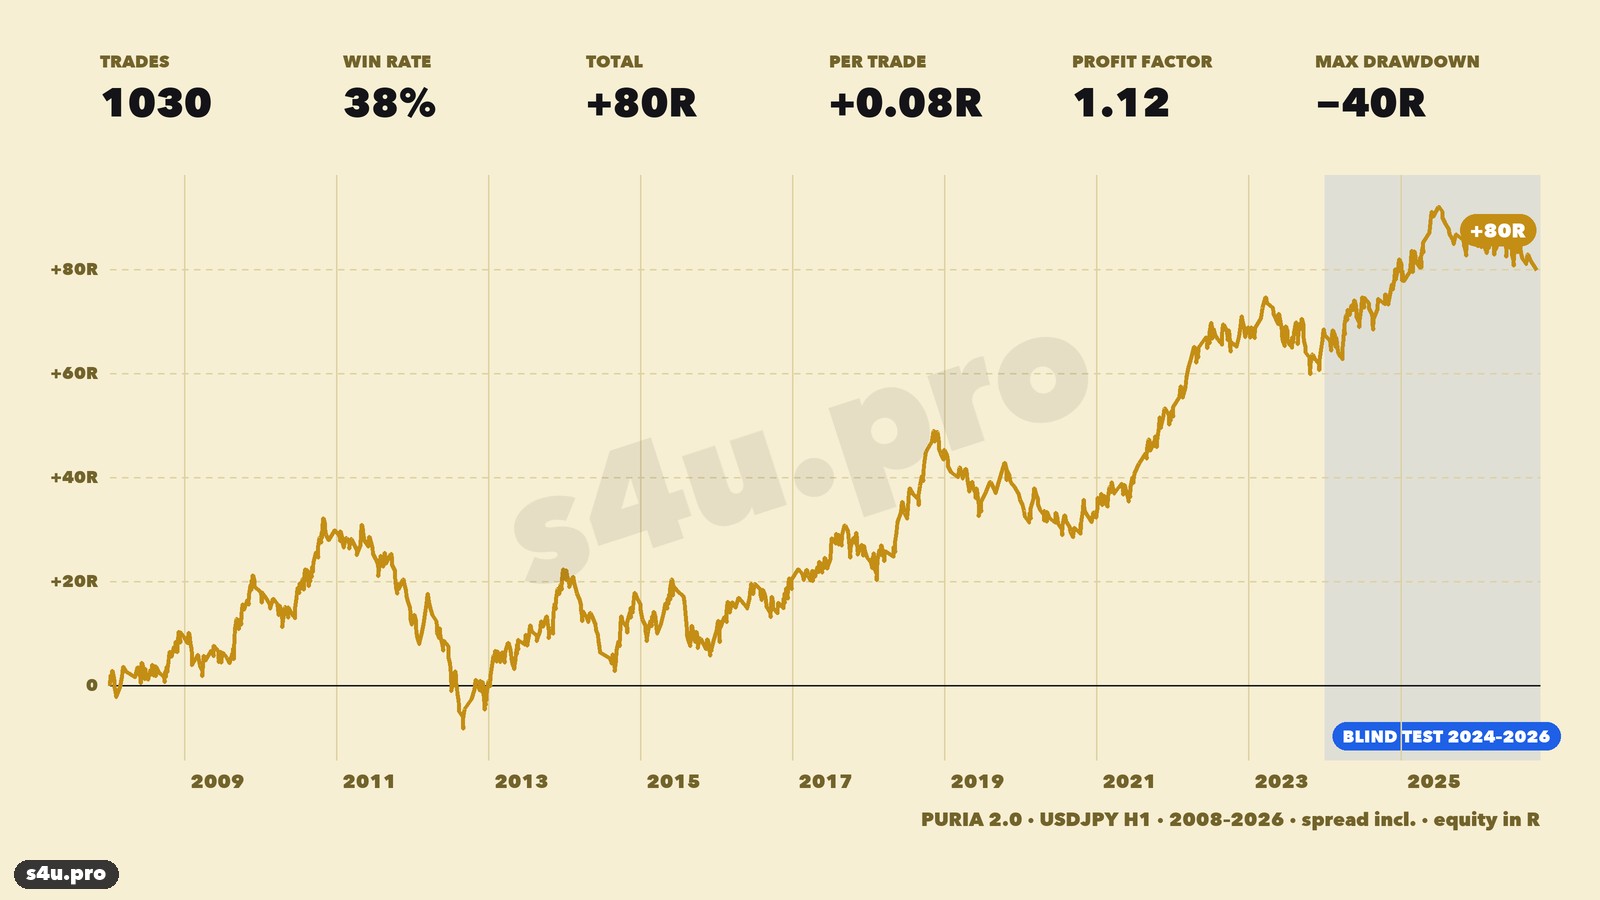
Ma anche qui il 2026 è negativo: −5.6R su 51 operazioni. Divisa per direzione, la situazione è molto chiara:
| USDJPY, 2026 | Operazioni | Take profit | Risultato |
|---|---|---|---|
| Prima versione migliorata | 17 (16 vendite) | 3 | −341 pip |
| Puria 2.0 — acquisti | 43 | 16 | +50 pip (+2.7R) |
| Puria 2.0 — vendite | 8 | 0 | −325 pip (−8.3R) |
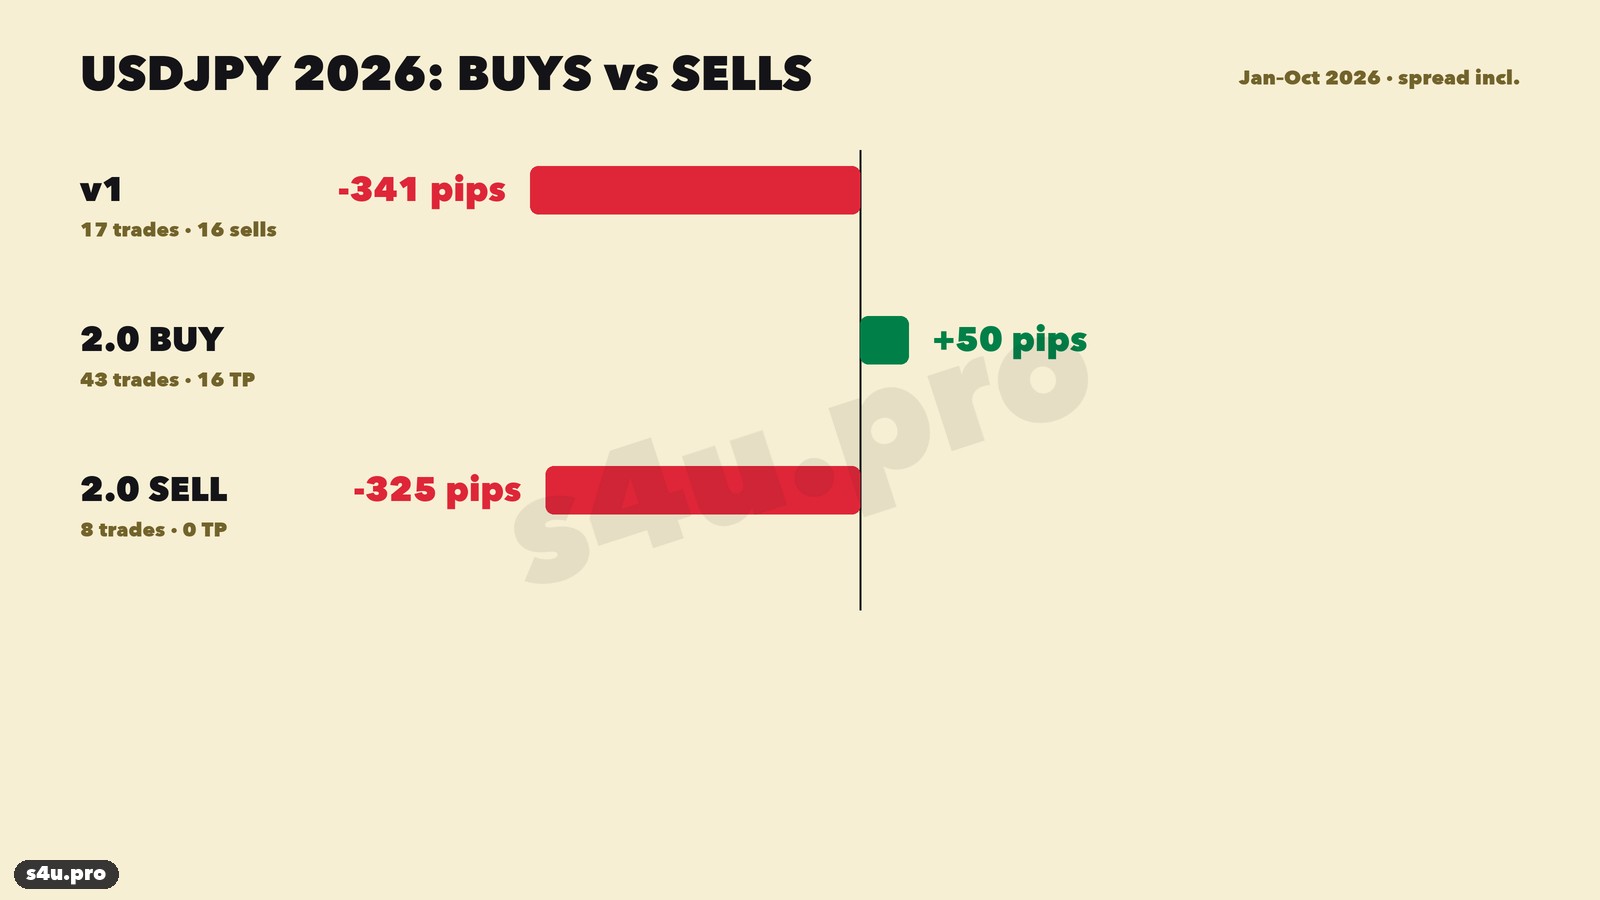
Tutta la perdita del 2026 sullo yen viene dalle vendite contro uno yen in indebolimento. Tutte e 8 le vendite si sono chiuse allo stop. Gli acquisti a favore del trend sono rimasti positivi, anche se di poco.
Conviene operare USDJPY con il Metodo Puria?
- Vendite — no. Finché sono possibili interventi e inversioni brusche dello yen, le vendite su questo segnale vengono stoppate di continuo.
- Acquisti Puria 2.0 — si possono considerare come complemento all’oro, ma con un rischio minore e prima in demo: il loro utile nel 2026 è piccolo.
- La prima versione migliorata sullo yen (LWMA su Low, quasi solo vendite) — da non operare.
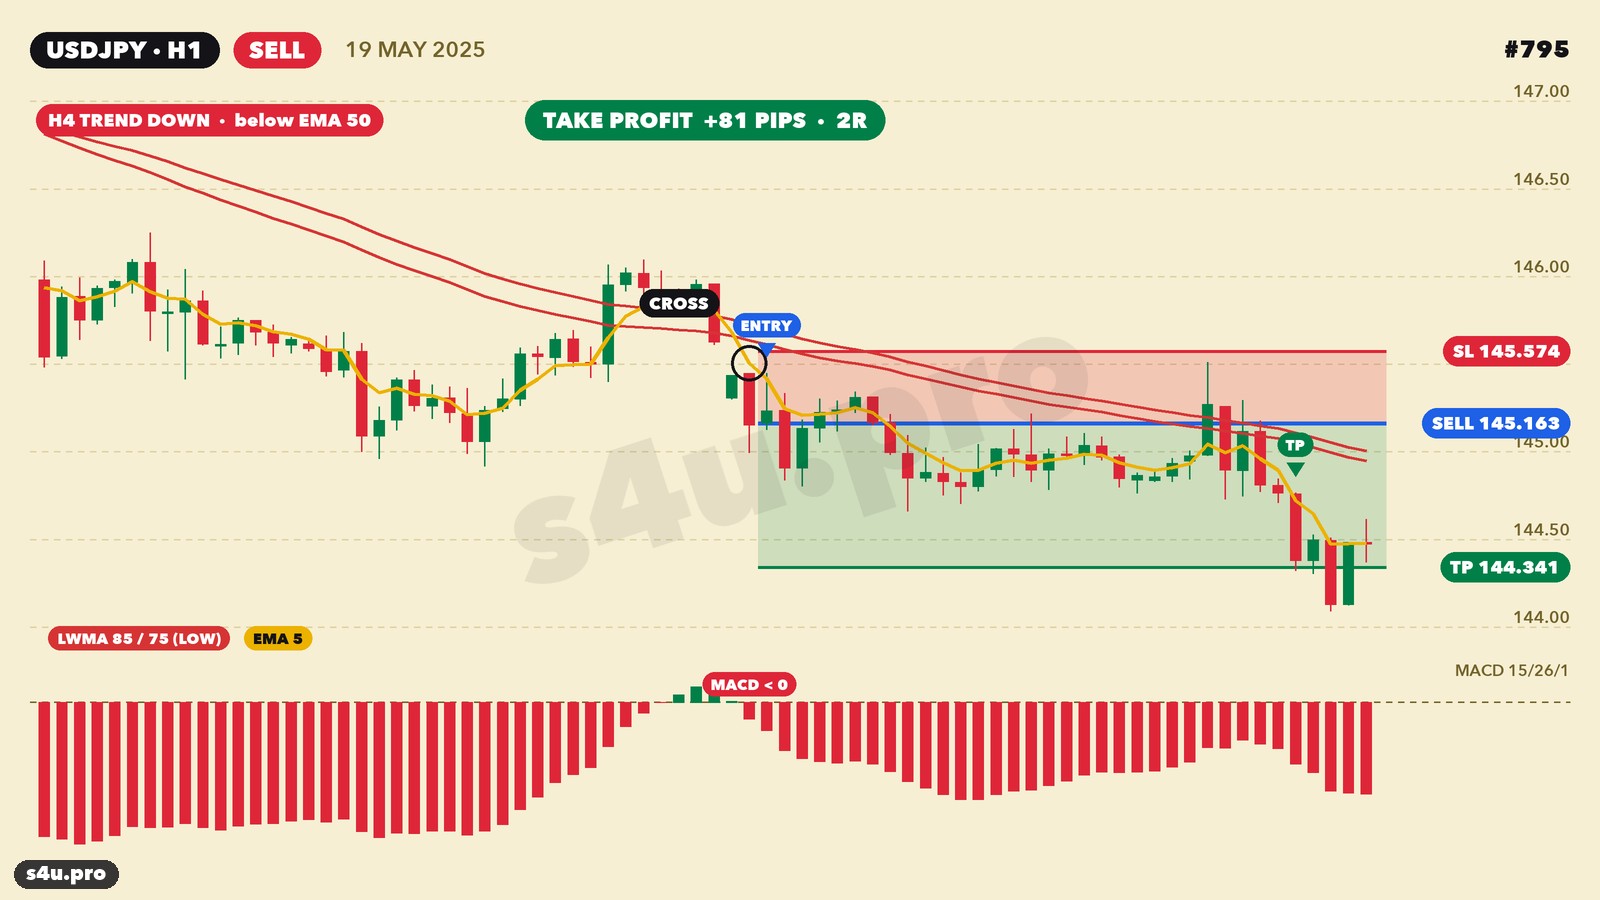
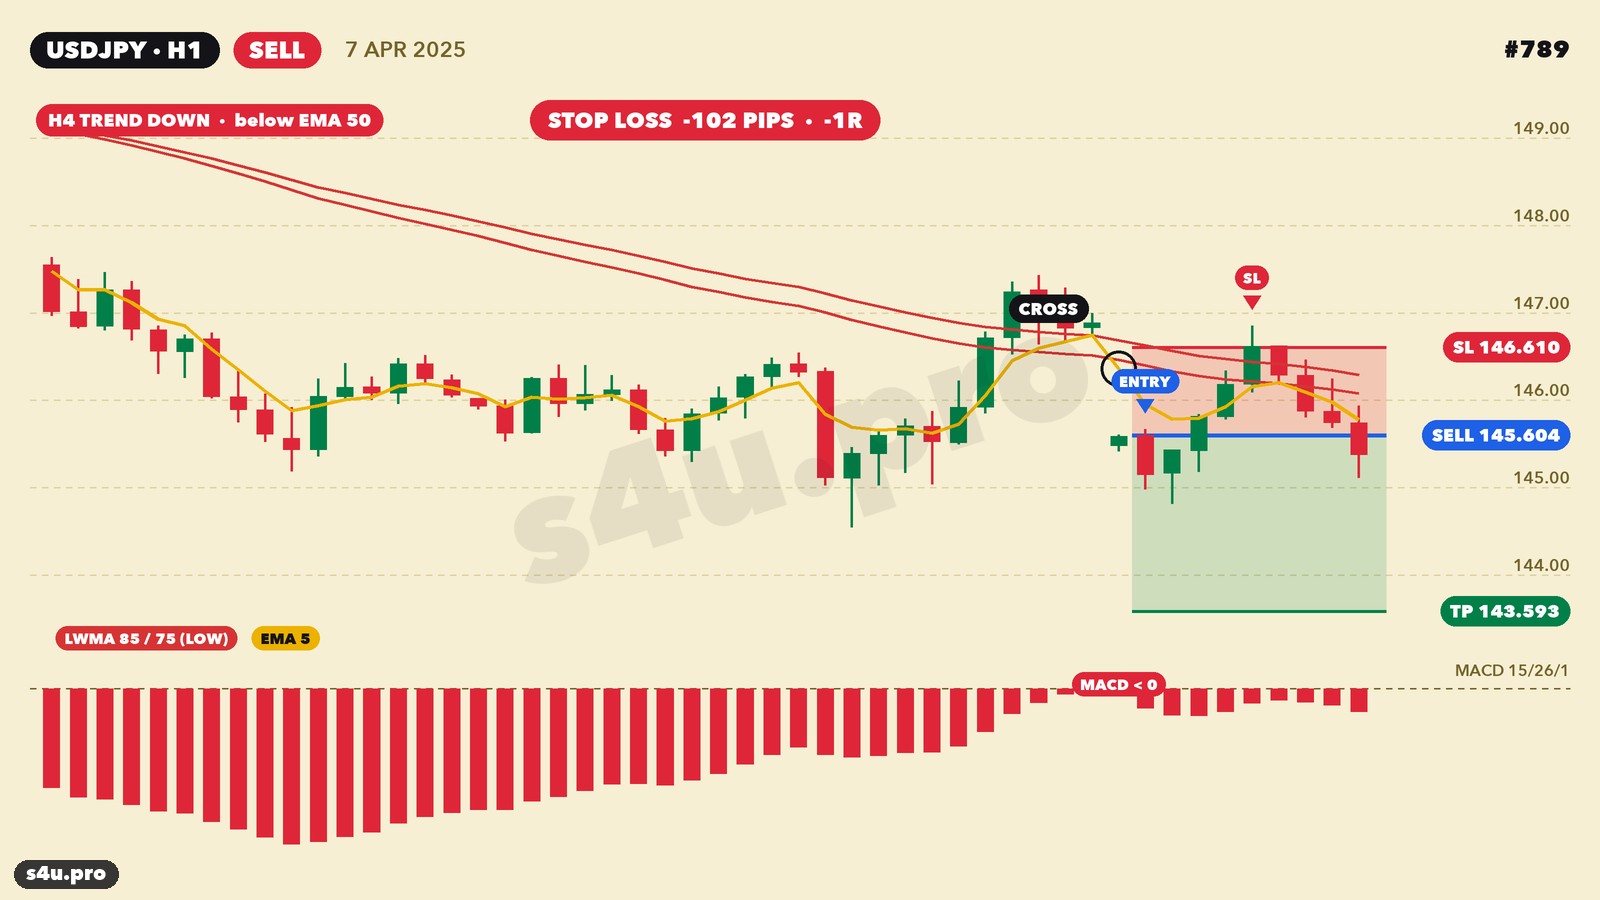
Un esempio di vendita vincente con la prima versione — maggio 2025, +81 pip — e di una perdente — aprile 2025, stop di 101 pip durante il panico dei mercati:
Galleria: tutte le operazioni USDJPY 2018–2025 (prima versione migliorata)
Ecco tutte le 336 operazioni della prima versione migliorata sullo yen nel 2018–2025 — il periodo di test «alla cieca» di quella versione, senza selezione. Filtra per risultato, direzione e anno, e clicca su un’immagine per aprire il grafico. Le 17 operazioni del 2026 sono state calcolate su altre quotazioni (Yahoo) e non sono nella galleria — il loro risultato è nella tabella sopra.
Tabella delle operazioni USDJPY 2018–2025
| # | Mercato | Apertura | Tipo | Entrata | Stop | Target | Uscita | Risultato | Pip | R | Grafico |
|---|---|---|---|---|---|---|---|---|---|---|---|
| 483 | USDJPY | 09.01.18 04:00 | SELL | 112.655 | 112.841 | 112.283 | 112.841 | SL | -20 | -1.06R | 📈 |
| 484 | USDJPY | 16.01.18 11:00 | SELL | 110.646 | 110.873 | 110.193 | 110.873 | SL | -24 | -1.05R | 📈 |
| 485 | USDJPY | 16.01.18 18:00 | SELL | 110.674 | 110.901 | 110.220 | 110.220 | TP | +44 | +1.95R | 📈 |
| 486 | USDJPY | 19.01.18 09:00 | SELL | 110.779 | 111.028 | 110.280 | 111.028 | SL | -26 | -1.05R | 📈 |
| 487 | USDJPY | 23.01.18 13:00 | SELL | 110.638 | 110.905 | 110.103 | 110.103 | TP | +52 | +1.96R | 📈 |
| 488 | USDJPY | 26.01.18 11:00 | SELL | 108.932 | 109.276 | 108.243 | 109.276 | SL | -36 | -1.03R | 📈 |
| 489 | USDJPY | 26.01.18 17:00 | SELL | 108.699 | 109.126 | 107.845 | 109.126 | SL | -44 | -1.03R | 📈 |
| 490 | USDJPY | 30.01.18 08:00 | SELL | 108.680 | 108.969 | 108.102 | 108.969 | SL | -30 | -1.04R | 📈 |
| 491 | USDJPY | 07.02.18 08:00 | SELL | 109.160 | 109.502 | 108.476 | 109.502 | SL | -35 | -1.03R | 📈 |
| 492 | USDJPY | 08.02.18 20:00 | SELL | 108.670 | 109.042 | 107.925 | 109.042 | SL | -38 | -1.03R | 📈 |
| 493 | USDJPY | 09.02.18 14:00 | SELL | 109.043 | 109.383 | 108.363 | 108.363 | TP | +67 | +1.97R | 📈 |
| 494 | USDJPY | 13.02.18 06:00 | SELL | 108.575 | 108.794 | 108.137 | 108.137 | TP | +43 | +1.95R | 📈 |
| 495 | USDJPY | 22.02.18 15:00 | SELL | 107.036 | 107.321 | 106.467 | 106.467 | TP | +56 | +1.96R | 📈 |
| 496 | USDJPY | 28.02.18 18:00 | SELL | 106.711 | 106.983 | 106.167 | 106.983 | SL | -28 | -1.04R | 📈 |
| 497 | USDJPY | 01.03.18 21:00 | SELL | 106.487 | 106.757 | 105.948 | 105.948 | TP | +53 | +1.96R | 📈 |
| 498 | USDJPY | 07.03.18 02:00 | SELL | 105.575 | 105.883 | 104.960 | 105.883 | SL | -32 | -1.04R | 📈 |
| 499 | USDJPY | 14.03.18 00:00 | SELL | 106.454 | 106.718 | 105.926 | 106.718 | SL | -28 | -1.04R | 📈 |
| 500 | USDJPY | 16.03.18 04:00 | SELL | 105.992 | 106.245 | 105.485 | 106.245 | SL | -27 | -1.05R | 📈 |
| 501 | USDJPY | 21.03.18 22:00 | SELL | 105.907 | 106.164 | 105.394 | 105.394 | TP | +50 | +1.95R | 📈 |
| 502 | USDJPY | 07.05.18 12:00 | BUY | 109.290 | 109.095 | 109.681 | 109.095 | SL | -21 | -1.06R | 📈 |
| 503 | USDJPY | 07.05.18 23:00 | SELL | 109.039 | 109.223 | 108.670 | 109.223 | SL | -20 | -1.06R | 📈 |
| 504 | USDJPY | 28.05.18 15:00 | SELL | 109.343 | 109.557 | 108.914 | 108.914 | TP | +42 | +1.94R | 📈 |
| 505 | USDJPY | 31.05.18 05:00 | SELL | 108.571 | 108.817 | 108.078 | 108.817 | SL | -26 | -1.05R | 📈 |
| 506 | USDJPY | 31.05.18 10:00 | SELL | 108.619 | 108.865 | 108.128 | 108.865 | SL | -26 | -1.05R | 📈 |
| 507 | USDJPY | 31.05.18 18:00 | SELL | 108.623 | 108.908 | 108.053 | 108.908 | SL | -30 | -1.04R | 📈 |
| 508 | USDJPY | 20.06.18 09:00 | BUY | 110.210 | 110.006 | 110.617 | 110.006 | SL | -22 | -1.06R | 📈 |
| 509 | USDJPY | 21.06.18 20:00 | SELL | 109.950 | 110.191 | 109.469 | 110.191 | SL | -25 | -1.05R | 📈 |
| 510 | USDJPY | 22.06.18 18:00 | SELL | 109.892 | 110.100 | 109.476 | 109.476 | TP | +40 | +1.94R | 📈 |
| 511 | USDJPY | 25.07.18 14:00 | SELL | 111.097 | 111.278 | 110.735 | 110.735 | TP | +35 | +1.93R | 📈 |
| 512 | USDJPY | 27.07.18 20:00 | SELL | 110.839 | 111.025 | 110.467 | 111.025 | SL | -20 | -1.06R | 📈 |
| 513 | USDJPY | 31.07.18 07:00 | SELL | 110.873 | 111.054 | 110.511 | 111.054 | SL | -19 | -1.07R | 📈 |
| 514 | USDJPY | 03.08.18 16:00 | SELL | 111.449 | 111.620 | 111.106 | 111.106 | TP | +33 | +1.93R | 📈 |
| 515 | USDJPY | 07.08.18 03:00 | SELL | 111.328 | 111.445 | 111.094 | 111.094 | TP | +22 | +1.90R | 📈 |
| 516 | USDJPY | 08.08.18 10:00 | SELL | 111.102 | 111.230 | 110.846 | 110.846 | TP | +24 | +1.91R | 📈 |
| 517 | USDJPY | 09.08.18 17:00 | SELL | 110.964 | 111.120 | 110.653 | 111.120 | SL | -17 | -1.08R | 📈 |
| 518 | USDJPY | 10.08.18 05:00 | SELL | 110.935 | 111.102 | 110.600 | 111.102 | SL | -18 | -1.07R | 📈 |
| 519 | USDJPY | 10.08.18 17:00 | SELL | 110.768 | 111.034 | 110.236 | 110.236 | TP | +52 | +1.96R | 📈 |
| 520 | USDJPY | 15.08.18 18:00 | SELL | 110.435 | 110.666 | 109.972 | 110.666 | SL | -24 | -1.05R | 📈 |
| 521 | USDJPY | 16.08.18 16:00 | SELL | 110.642 | 110.859 | 110.209 | 110.859 | SL | -23 | -1.05R | 📈 |
| 522 | USDJPY | 17.08.18 11:00 | SELL | 110.702 | 110.865 | 110.377 | 110.377 | TP | +31 | +1.93R | 📈 |
| 523 | USDJPY | 20.08.18 16:00 | SELL | 110.431 | 110.587 | 110.118 | 110.118 | TP | +30 | +1.92R | 📈 |
| 524 | USDJPY | 22.08.18 02:00 | SELL | 110.074 | 110.278 | 109.665 | 110.278 | SL | -22 | -1.06R | 📈 |
| 525 | USDJPY | 03.09.18 04:00 | SELL | 110.988 | 111.176 | 110.613 | 111.176 | SL | -20 | -1.06R | 📈 |
| 526 | USDJPY | 10.10.18 17:00 | SELL | 112.911 | 113.103 | 112.527 | 112.527 | TP | +37 | +1.94R | 📈 |
| 527 | USDJPY | 12.10.18 12:00 | SELL | 112.253 | 112.496 | 111.767 | 111.767 | TP | +47 | +1.95R | 📈 |
| 528 | USDJPY | 18.10.18 21:00 | SELL | 112.043 | 112.257 | 111.615 | 112.257 | SL | -23 | -1.06R | 📈 |
| 529 | USDJPY | 26.10.18 08:00 | SELL | 112.213 | 112.427 | 111.785 | 111.785 | TP | +42 | +1.94R | 📈 |
| 530 | USDJPY | 16.11.18 04:00 | SELL | 113.447 | 113.656 | 113.030 | 113.030 | TP | +41 | +1.94R | 📈 |
| 531 | USDJPY | 23.11.18 11:00 | SELL | 112.858 | 112.954 | 112.665 | 112.665 | TP | +18 | +1.88R | 📈 |
| 532 | USDJPY | 04.12.18 05:00 | SELL | 113.312 | 113.469 | 112.999 | 112.999 | TP | +30 | +1.92R | 📈 |
| 533 | USDJPY | 07.12.18 19:00 | SELL | 112.593 | 112.794 | 112.191 | 112.794 | SL | -21 | -1.06R | 📈 |
| 534 | USDJPY | 20.12.18 07:00 | SELL | 112.245 | 112.479 | 111.776 | 111.776 | TP | +46 | +1.95R | 📈 |
| 535 | USDJPY | 27.12.18 17:00 | SELL | 110.666 | 110.931 | 110.137 | 110.931 | SL | -28 | -1.04R | 📈 |
| 536 | USDJPY | 28.12.18 06:00 | SELL | 110.550 | 110.844 | 109.961 | 109.961 | TP | +58 | +1.96R | 📈 |
| 537 | USDJPY | 09.01.19 18:00 | SELL | 108.182 | 108.436 | 107.674 | 108.436 | SL | -27 | -1.05R | 📈 |
| 538 | USDJPY | 14.01.19 07:00 | SELL | 108.110 | 108.300 | 107.730 | 108.300 | SL | -20 | -1.06R | 📈 |
| 539 | USDJPY | 15.01.19 01:00 | SELL | 108.151 | 108.314 | 107.824 | 108.314 | SL | -18 | -1.07R | 📈 |
| 540 | USDJPY | 30.01.19 05:00 | SELL | 109.270 | 109.428 | 108.953 | 109.428 | SL | -17 | -1.08R | 📈 |
| 541 | USDJPY | 18.02.19 11:00 | BUY | 110.575 | 110.455 | 110.816 | 110.455 | SL | -13 | -1.10R | 📈 |
| 542 | USDJPY | 13.03.19 21:00 | SELL | 111.026 | 111.175 | 110.729 | 111.175 | SL | -16 | -1.08R | 📈 |
| 543 | USDJPY | 14.03.19 02:00 | SELL | 111.205 | 111.363 | 110.890 | 111.363 | SL | -17 | -1.08R | 📈 |
| 544 | USDJPY | 28.03.19 05:00 | SELL | 110.167 | 110.387 | 109.726 | 110.387 | SL | -23 | -1.05R | 📈 |
| 545 | USDJPY | 23.04.19 04:00 | SELL | 111.695 | 111.773 | 111.538 | 111.773 | SL | -9 | -1.15R | 📈 |
| 546 | USDJPY | 23.04.19 20:00 | SELL | 111.786 | 111.893 | 111.572 | 111.893 | SL | -12 | -1.11R | 📈 |
| 547 | USDJPY | 25.04.19 16:00 | SELL | 111.809 | 111.956 | 111.515 | 111.515 | TP | +28 | +1.92R | 📈 |
| 548 | USDJPY | 30.04.19 05:00 | SELL | 111.570 | 111.670 | 111.370 | 111.370 | TP | +19 | +1.88R | 📈 |
| 549 | USDJPY | 01.05.19 12:00 | SELL | 111.413 | 111.516 | 111.206 | 111.206 | TP | +19 | +1.88R | 📈 |
| 550 | USDJPY | 03.05.19 18:00 | SELL | 111.223 | 111.346 | 110.978 | 110.978 | TP | +23 | +1.90R | 📈 |
| 551 | USDJPY | 13.05.19 11:00 | SELL | 109.638 | 109.813 | 109.288 | 109.288 | TP | +34 | +1.93R | 📈 |
| 552 | USDJPY | 15.05.19 13:00 | SELL | 109.337 | 109.499 | 109.012 | 109.499 | SL | -17 | -1.07R | 📈 |
| 553 | USDJPY | 28.05.19 12:00 | SELL | 109.223 | 109.361 | 108.947 | 109.361 | SL | -15 | -1.09R | 📈 |
| 554 | USDJPY | 29.05.19 00:00 | SELL | 109.365 | 109.521 | 109.052 | 109.521 | SL | -17 | -1.08R | 📈 |
| 555 | USDJPY | 31.05.19 04:00 | SELL | 109.264 | 109.444 | 108.904 | 108.904 | TP | +35 | +1.93R | 📈 |
| 556 | USDJPY | 04.06.19 22:00 | SELL | 108.053 | 108.285 | 107.589 | 108.285 | SL | -24 | -1.05R | 📈 |
| 557 | USDJPY | 07.06.19 18:00 | SELL | 108.012 | 108.236 | 107.564 | 108.236 | SL | -24 | -1.05R | 📈 |
| 558 | USDJPY | 12.06.19 09:00 | SELL | 108.396 | 108.518 | 108.152 | 108.518 | SL | -13 | -1.10R | 📈 |
| 559 | USDJPY | 13.06.19 05:00 | SELL | 108.292 | 108.435 | 108.007 | 108.435 | SL | -15 | -1.08R | 📈 |
| 560 | USDJPY | 13.06.19 22:00 | SELL | 108.315 | 108.462 | 108.021 | 108.462 | SL | -16 | -1.08R | 📈 |
| 561 | USDJPY | 19.06.19 09:00 | SELL | 108.342 | 108.494 | 108.038 | 108.038 | TP | +29 | +1.92R | 📈 |
| 562 | USDJPY | 24.06.19 12:00 | SELL | 107.364 | 107.522 | 107.048 | 107.522 | SL | -17 | -1.08R | 📈 |
| 563 | USDJPY | 24.06.19 21:00 | SELL | 107.323 | 107.484 | 107.002 | 107.002 | TP | +31 | +1.93R | 📈 |
| 564 | USDJPY | 12.07.19 01:00 | BUY | 108.476 | 108.325 | 108.778 | 108.325 | SL | -16 | -1.08R | 📈 |
| 565 | USDJPY | 16.07.19 16:00 | BUY | 108.190 | 108.037 | 108.495 | 108.037 | SL | -16 | -1.08R | 📈 |
| 566 | USDJPY | 18.07.19 00:00 | SELL | 107.935 | 108.070 | 107.664 | 107.664 | TP | +26 | +1.91R | 📈 |
| 567 | USDJPY | 31.07.19 22:00 | BUY | 108.772 | 108.610 | 109.095 | 109.095 | TP | +31 | +1.93R | 📈 |
| 568 | USDJPY | 07.08.19 07:00 | SELL | 106.058 | 106.356 | 105.463 | 105.463 | TP | +58 | +1.96R | 📈 |
| 569 | USDJPY | 20.08.19 16:00 | SELL | 106.268 | 106.411 | 105.982 | 106.411 | SL | -15 | -1.08R | 📈 |
| 570 | USDJPY | 02.09.19 21:00 | SELL | 106.146 | 106.301 | 105.837 | 106.301 | SL | -17 | -1.08R | 📈 |
| 571 | USDJPY | 01.10.19 20:00 | SELL | 107.687 | 107.910 | 107.242 | 107.242 | TP | +43 | +1.95R | 📈 |
| 572 | USDJPY | 13.11.19 12:00 | SELL | 108.891 | 109.027 | 108.619 | 108.619 | TP | +26 | +1.91R | 📈 |
| 573 | USDJPY | 18.11.19 20:00 | SELL | 108.581 | 108.729 | 108.286 | 108.729 | SL | -16 | -1.08R | 📈 |
| 574 | USDJPY | 19.11.19 18:00 | SELL | 108.488 | 108.637 | 108.189 | 108.637 | SL | -16 | -1.08R | 📈 |
| 575 | USDJPY | 21.11.19 02:00 | SELL | 108.468 | 108.651 | 108.102 | 108.651 | SL | -19 | -1.07R | 📈 |
| 576 | USDJPY | 06.12.19 05:00 | SELL | 108.672 | 108.795 | 108.426 | 108.795 | SL | -13 | -1.10R | 📈 |
| 577 | USDJPY | 06.12.19 19:00 | SELL | 108.657 | 108.808 | 108.355 | 108.808 | SL | -16 | -1.08R | 📈 |
| 578 | USDJPY | 11.12.19 23:00 | SELL | 108.539 | 108.655 | 108.306 | 108.655 | SL | -13 | -1.10R | 📈 |
| 579 | USDJPY | 08.01.20 03:00 | SELL | 107.860 | 108.099 | 107.381 | 108.099 | SL | -25 | -1.05R | 📈 |
| 580 | USDJPY | 30.01.20 03:00 | SELL | 108.962 | 109.112 | 108.663 | 108.663 | TP | +29 | +1.92R | 📈 |
| 581 | USDJPY | 31.01.20 17:00 | SELL | 108.751 | 108.906 | 108.441 | 108.441 | TP | +30 | +1.92R | 📈 |
| 582 | USDJPY | 26.02.20 19:00 | SELL | 110.362 | 110.637 | 109.812 | 109.812 | TP | +54 | +1.96R | 📈 |
| 583 | USDJPY | 03.03.20 05:00 | SELL | 107.950 | 108.418 | 107.015 | 107.015 | TP | +92 | +1.97R | 📈 |
| 584 | USDJPY | 05.03.20 06:00 | SELL | 107.313 | 107.595 | 106.749 | 106.749 | TP | +55 | +1.96R | 📈 |
| 585 | USDJPY | 12.03.20 05:00 | SELL | 103.378 | 104.112 | 101.910 | 104.112 | SL | -75 | -1.02R | 📈 |
| 586 | USDJPY | 31.03.20 20:00 | SELL | 107.769 | 108.272 | 106.762 | 108.272 | SL | -52 | -1.02R | 📈 |
| 587 | USDJPY | 21.04.20 07:00 | SELL | 107.544 | 107.751 | 107.130 | 107.751 | SL | -22 | -1.06R | 📈 |
| 588 | USDJPY | 23.04.20 14:00 | SELL | 107.547 | 107.699 | 107.243 | 107.699 | SL | -16 | -1.08R | 📈 |
| 589 | USDJPY | 23.04.20 20:00 | SELL | 107.513 | 107.763 | 107.012 | 107.012 | TP | +49 | +1.95R | 📈 |
| 590 | USDJPY | 04.05.20 06:00 | SELL | 106.695 | 106.902 | 106.282 | 106.902 | SL | -22 | -1.06R | 📈 |
| 591 | USDJPY | 04.05.20 23:00 | SELL | 106.687 | 106.859 | 106.343 | 106.859 | SL | -18 | -1.07R | 📈 |
| 592 | USDJPY | 05.05.20 17:00 | SELL | 106.580 | 106.753 | 106.233 | 106.233 | TP | +33 | +1.93R | 📈 |
| 593 | USDJPY | 15.05.20 16:00 | SELL | 106.911 | 107.085 | 106.564 | 107.085 | SL | -19 | -1.07R | 📈 |
| 594 | USDJPY | 17.06.20 09:00 | SELL | 107.236 | 107.419 | 106.869 | 107.419 | SL | -20 | -1.06R | 📈 |
| 595 | USDJPY | 17.06.20 21:00 | SELL | 107.183 | 107.341 | 106.867 | 106.867 | TP | +30 | +1.92R | 📈 |
| 596 | USDJPY | 23.06.20 17:00 | SELL | 106.256 | 106.470 | 105.827 | 106.470 | SL | -23 | -1.06R | 📈 |
| 597 | USDJPY | 26.06.20 14:00 | SELL | 106.873 | 107.020 | 106.578 | 107.020 | SL | -16 | -1.08R | 📈 |
| 598 | USDJPY | 15.07.20 12:00 | SELL | 106.895 | 107.029 | 106.626 | 107.029 | SL | -15 | -1.09R | 📈 |
| 599 | USDJPY | 17.07.20 21:00 | SELL | 107.000 | 107.120 | 106.759 | 107.120 | SL | -13 | -1.10R | 📈 |
| 600 | USDJPY | 21.07.20 17:00 | SELL | 106.995 | 107.146 | 106.692 | 106.692 | TP | +29 | +1.92R | 📈 |
| 601 | USDJPY | 30.07.20 21:00 | SELL | 104.887 | 105.103 | 104.455 | 104.455 | TP | +42 | +1.94R | 📈 |
| 602 | USDJPY | 05.08.20 03:00 | SELL | 105.622 | 105.827 | 105.212 | 105.827 | SL | -22 | -1.06R | 📈 |
| 603 | USDJPY | 21.08.20 07:00 | SELL | 105.667 | 105.822 | 105.357 | 105.822 | SL | -17 | -1.08R | 📈 |
| 604 | USDJPY | 26.08.20 21:00 | SELL | 105.995 | 106.182 | 105.621 | 106.182 | SL | -20 | -1.06R | 📈 |
| 605 | USDJPY | 08.09.20 16:00 | SELL | 105.983 | 106.119 | 105.712 | 106.119 | SL | -15 | -1.09R | 📈 |
| 606 | USDJPY | 14.09.20 08:00 | SELL | 106.046 | 106.141 | 105.855 | 105.855 | TP | +18 | +1.87R | 📈 |
| 607 | USDJPY | 14.10.20 05:00 | SELL | 105.325 | 105.432 | 105.111 | 105.432 | SL | -12 | -1.11R | 📈 |
| 608 | USDJPY | 14.10.20 12:00 | SELL | 105.359 | 105.466 | 105.144 | 105.144 | TP | +20 | +1.89R | 📈 |
| 609 | USDJPY | 16.10.20 09:00 | SELL | 105.242 | 105.357 | 105.012 | 105.357 | SL | -13 | -1.10R | 📈 |
| 610 | USDJPY | 21.10.20 06:00 | SELL | 105.370 | 105.481 | 105.147 | 105.147 | TP | +21 | +1.89R | 📈 |
| 611 | USDJPY | 27.10.20 08:00 | SELL | 104.734 | 104.839 | 104.524 | 104.524 | TP | +20 | +1.89R | 📈 |
| 612 | USDJPY | 29.10.20 09:00 | SELL | 104.339 | 104.467 | 104.082 | 104.082 | TP | +24 | +1.91R | 📈 |
| 613 | USDJPY | 30.10.20 09:00 | SELL | 104.303 | 104.465 | 103.979 | 104.465 | SL | -17 | -1.07R | 📈 |
| 614 | USDJPY | 03.11.20 19:00 | SELL | 104.497 | 104.658 | 104.174 | 104.658 | SL | -17 | -1.07R | 📈 |
| 615 | USDJPY | 19.11.20 19:00 | SELL | 103.847 | 104.026 | 103.489 | 104.026 | SL | -19 | -1.07R | 📈 |
| 616 | USDJPY | 07.12.20 22:00 | SELL | 103.968 | 104.129 | 103.646 | 104.129 | SL | -17 | -1.07R | 📈 |
| 617 | USDJPY | 15.12.20 16:00 | SELL | 103.761 | 103.902 | 103.480 | 103.480 | TP | +27 | +1.92R | 📈 |
| 618 | USDJPY | 28.12.20 09:00 | SELL | 103.442 | 103.562 | 103.202 | 103.562 | SL | -13 | -1.10R | 📈 |
| 619 | USDJPY | 04.01.21 03:00 | SELL | 103.052 | 103.218 | 102.721 | 102.721 | TP | +32 | +1.93R | 📈 |
| 620 | USDJPY | 05.01.21 08:00 | SELL | 102.947 | 103.077 | 102.687 | 102.687 | TP | +25 | +1.91R | 📈 |
| 621 | USDJPY | 14.01.21 05:00 | BUY | 104.027 | 103.847 | 104.387 | 103.847 | SL | -19 | -1.07R | 📈 |
| 622 | USDJPY | 18.01.21 06:00 | SELL | 103.737 | 103.876 | 103.459 | 103.876 | SL | -15 | -1.09R | 📈 |
| 623 | USDJPY | 20.01.21 16:00 | SELL | 103.737 | 103.847 | 103.517 | 103.517 | TP | +21 | +1.89R | 📈 |
| 624 | USDJPY | 26.01.21 17:00 | SELL | 103.580 | 103.683 | 103.374 | 103.683 | SL | -12 | -1.12R | 📈 |
| 625 | USDJPY | 27.01.21 09:00 | SELL | 103.664 | 103.754 | 103.485 | 103.754 | SL | -10 | -1.13R | 📈 |
| 626 | USDJPY | 22.02.21 16:00 | SELL | 105.344 | 105.536 | 104.959 | 104.959 | TP | +37 | +1.94R | 📈 |
| 627 | USDJPY | 23.03.21 06:00 | SELL | 108.698 | 108.824 | 108.446 | 108.446 | TP | +24 | +1.91R | 📈 |
| 628 | USDJPY | 06.04.21 16:00 | SELL | 109.895 | 110.113 | 109.459 | 109.459 | TP | +42 | +1.95R | 📈 |
| 629 | USDJPY | 12.04.21 13:00 | SELL | 109.307 | 109.475 | 108.970 | 109.475 | SL | -18 | -1.07R | 📈 |
| 630 | USDJPY | 13.04.21 13:00 | SELL | 109.332 | 109.508 | 108.981 | 109.508 | SL | -19 | -1.07R | 📈 |
| 631 | USDJPY | 19.04.21 03:00 | SELL | 108.715 | 108.845 | 108.454 | 108.454 | TP | +25 | +1.91R | 📈 |
| 632 | USDJPY | 20.04.21 18:00 | SELL | 108.121 | 108.328 | 107.707 | 107.707 | TP | +40 | +1.94R | 📈 |
| 633 | USDJPY | 23.04.21 23:00 | SELL | 107.885 | 108.066 | 107.522 | 108.066 | SL | -19 | -1.07R | 📈 |
| 634 | USDJPY | 07.05.21 16:00 | SELL | 108.572 | 108.805 | 108.105 | 108.805 | SL | -25 | -1.05R | 📈 |
| 635 | USDJPY | 11.05.21 04:00 | BUY | 108.943 | 108.762 | 109.305 | 108.762 | SL | -19 | -1.07R | 📈 |
| 636 | USDJPY | 11.05.21 15:00 | SELL | 108.588 | 108.766 | 108.231 | 108.766 | SL | -19 | -1.07R | 📈 |
| 637 | USDJPY | 19.05.21 17:00 | SELL | 108.763 | 108.943 | 108.403 | 108.943 | SL | -19 | -1.07R | 📈 |
| 638 | USDJPY | 20.05.21 15:00 | SELL | 108.911 | 109.072 | 108.589 | 108.589 | TP | +31 | +1.93R | 📈 |
| 639 | USDJPY | 26.05.21 00:00 | SELL | 108.738 | 108.891 | 108.431 | 108.891 | SL | -17 | -1.08R | 📈 |
| 640 | USDJPY | 09.06.21 17:00 | SELL | 109.282 | 109.410 | 109.026 | 109.410 | SL | -14 | -1.09R | 📈 |
| 641 | USDJPY | 10.06.21 23:00 | SELL | 109.313 | 109.468 | 109.002 | 109.468 | SL | -17 | -1.08R | 📈 |
| 642 | USDJPY | 14.07.21 17:00 | SELL | 110.072 | 110.224 | 109.767 | 109.767 | TP | +29 | +1.92R | 📈 |
| 643 | USDJPY | 19.07.21 04:00 | SELL | 109.860 | 110.012 | 109.556 | 110.012 | SL | -16 | -1.08R | 📈 |
| 644 | USDJPY | 19.07.21 11:00 | SELL | 109.836 | 109.987 | 109.533 | 109.533 | TP | +29 | +1.92R | 📈 |
| 645 | USDJPY | 02.08.21 14:00 | SELL | 109.507 | 109.646 | 109.229 | 109.229 | TP | +27 | +1.91R | 📈 |
| 646 | USDJPY | 20.08.21 11:00 | SELL | 109.608 | 109.771 | 109.282 | 109.771 | SL | -17 | -1.07R | 📈 |
| 647 | USDJPY | 23.08.21 22:00 | SELL | 109.678 | 109.828 | 109.378 | 109.828 | SL | -16 | -1.08R | 📈 |
| 648 | USDJPY | 24.08.21 14:00 | SELL | 109.707 | 109.838 | 109.445 | 109.445 | TP | +25 | +1.91R | 📈 |
| 649 | USDJPY | 27.08.21 20:00 | SELL | 109.798 | 109.974 | 109.446 | 109.974 | SL | -19 | -1.07R | 📈 |
| 650 | USDJPY | 31.08.21 08:00 | BUY | 109.900 | 109.803 | 110.095 | 109.803 | SL | -11 | -1.12R | 📈 |
| 651 | USDJPY | 31.08.21 16:00 | SELL | 109.705 | 109.834 | 109.448 | 109.834 | SL | -14 | -1.09R | 📈 |
| 652 | USDJPY | 07.09.21 04:00 | SELL | 109.775 | 109.853 | 109.619 | 109.853 | SL | -9 | -1.15R | 📈 |
| 653 | USDJPY | 13.09.21 04:00 | BUY | 109.963 | 109.852 | 110.185 | 109.852 | SL | -12 | -1.11R | 📈 |
| 654 | USDJPY | 14.09.21 18:00 | SELL | 109.651 | 109.786 | 109.382 | 109.382 | TP | +26 | +1.91R | 📈 |
| 655 | USDJPY | 20.09.21 14:00 | SELL | 109.503 | 109.640 | 109.229 | 109.640 | SL | -15 | -1.09R | 📈 |
| 656 | USDJPY | 27.10.21 13:00 | SELL | 113.638 | 113.828 | 113.257 | 113.828 | SL | -20 | -1.06R | 📈 |
| 657 | USDJPY | 04.11.21 17:00 | SELL | 113.591 | 113.816 | 113.141 | 113.816 | SL | -24 | -1.05R | 📈 |
| 658 | USDJPY | 05.11.21 16:00 | SELL | 113.629 | 113.844 | 113.198 | 113.198 | TP | +42 | +1.94R | 📈 |
| 659 | USDJPY | 01.12.21 17:00 | SELL | 112.833 | 113.151 | 112.197 | 113.151 | SL | -33 | -1.04R | 📈 |
| 660 | USDJPY | 02.12.21 15:00 | SELL | 112.814 | 113.096 | 112.249 | 113.096 | SL | -29 | -1.04R | 📈 |
| 661 | USDJPY | 03.12.21 21:00 | SELL | 112.587 | 112.899 | 111.963 | 112.899 | SL | -32 | -1.04R | 📈 |
| 662 | USDJPY | 09.12.21 15:00 | SELL | 113.426 | 113.618 | 113.041 | 113.618 | SL | -20 | -1.06R | 📈 |
| 663 | USDJPY | 10.12.21 19:00 | SELL | 113.361 | 113.561 | 112.962 | 113.561 | SL | -21 | -1.06R | 📈 |
| 664 | USDJPY | 16.12.21 20:00 | SELL | 113.626 | 113.821 | 113.236 | 113.821 | SL | -21 | -1.06R | 📈 |
| 665 | USDJPY | 12.01.22 17:00 | SELL | 115.089 | 115.278 | 114.711 | 114.711 | TP | +37 | +1.94R | 📈 |
| 666 | USDJPY | 19.01.22 08:00 | SELL | 114.249 | 114.456 | 113.835 | 114.456 | SL | -22 | -1.06R | 📈 |
| 667 | USDJPY | 19.01.22 17:00 | SELL | 114.342 | 114.548 | 113.931 | 113.931 | TP | +40 | +1.94R | 📈 |
| 668 | USDJPY | 03.02.22 12:00 | BUY | 114.738 | 114.579 | 115.055 | 115.055 | TP | +31 | +1.92R | 📈 |
| 669 | USDJPY | 24.02.22 06:00 | SELL | 114.690 | 114.893 | 114.283 | 114.893 | SL | -22 | -1.06R | 📈 |
| 670 | USDJPY | 11.05.22 20:00 | SELL | 129.926 | 130.362 | 129.054 | 129.054 | TP | +86 | +1.97R | 📈 |
| 671 | USDJPY | 18.05.22 16:00 | SELL | 128.895 | 129.178 | 128.330 | 128.330 | TP | +55 | +1.96R | 📈 |
| 672 | USDJPY | 20.05.22 19:00 | SELL | 127.858 | 128.289 | 126.997 | 126.997 | TP | +85 | +1.97R | 📈 |
| 673 | USDJPY | 26.05.22 11:00 | SELL | 126.593 | 126.934 | 125.911 | 126.934 | SL | -35 | -1.03R | 📈 |
| 674 | USDJPY | 27.05.22 05:00 | SELL | 126.786 | 127.109 | 126.140 | 127.109 | SL | -34 | -1.04R | 📈 |
| 675 | USDJPY | 24.06.22 21:00 | BUY | 135.357 | 134.923 | 136.224 | 134.923 | SL | -45 | -1.03R | 📈 |
| 676 | USDJPY | 28.07.22 02:00 | SELL | 136.446 | 136.805 | 135.729 | 135.729 | TP | +71 | +1.97R | 📈 |
| 677 | USDJPY | 05.08.22 00:00 | SELL | 132.855 | 133.326 | 131.914 | 133.326 | SL | -48 | -1.02R | 📈 |
| 678 | USDJPY | 05.08.22 13:00 | SELL | 133.055 | 133.501 | 132.163 | 133.501 | SL | -46 | -1.03R | 📈 |
| 679 | USDJPY | 10.08.22 16:00 | SELL | 133.138 | 133.614 | 132.185 | 132.185 | TP | +94 | +1.98R | 📈 |
| 680 | USDJPY | 15.08.22 17:00 | SELL | 132.736 | 133.106 | 131.996 | 133.106 | SL | -38 | -1.03R | 📈 |
| 681 | USDJPY | 13.09.22 16:00 | BUY | 144.404 | 143.735 | 145.742 | 143.735 | SL | -68 | -1.02R | 📈 |
| 682 | USDJPY | 22.09.22 14:00 | SELL | 142.490 | 143.737 | 139.995 | 143.737 | SL | -126 | -1.01R | 📈 |
| 683 | USDJPY | 01.11.22 13:00 | SELL | 147.235 | 147.711 | 146.283 | 147.711 | SL | -49 | -1.02R | 📈 |
| 684 | USDJPY | 03.11.22 05:00 | SELL | 147.358 | 147.923 | 146.227 | 147.923 | SL | -58 | -1.02R | 📈 |
| 685 | USDJPY | 04.11.22 15:00 | SELL | 147.193 | 147.661 | 146.258 | 146.258 | TP | +92 | +1.97R | 📈 |
| 686 | USDJPY | 10.11.22 16:00 | SELL | 143.715 | 144.381 | 142.384 | 142.384 | TP | +132 | +1.98R | 📈 |
| 687 | USDJPY | 15.11.22 11:00 | SELL | 139.505 | 140.091 | 138.334 | 138.334 | TP | +116 | +1.98R | 📈 |
| 688 | USDJPY | 23.11.22 17:00 | SELL | 139.995 | 140.456 | 139.073 | 139.073 | TP | +91 | +1.97R | 📈 |
| 689 | USDJPY | 28.11.22 05:00 | SELL | 138.519 | 138.952 | 137.653 | 137.653 | TP | +85 | +1.97R | 📈 |
| 690 | USDJPY | 29.11.22 10:00 | SELL | 138.290 | 138.794 | 137.282 | 138.794 | SL | -52 | -1.02R | 📈 |
| 691 | USDJPY | 08.12.22 02:00 | SELL | 136.372 | 136.822 | 135.471 | 136.822 | SL | -46 | -1.03R | 📈 |
| 692 | USDJPY | 08.12.22 18:00 | SELL | 136.509 | 136.981 | 135.565 | 136.981 | SL | -48 | -1.02R | 📈 |
| 693 | USDJPY | 13.12.22 16:00 | SELL | 135.132 | 135.743 | 133.911 | 135.743 | SL | -62 | -1.02R | 📈 |
| 694 | USDJPY | 29.12.22 16:00 | SELL | 133.162 | 133.550 | 132.387 | 132.387 | TP | +76 | +1.97R | 📈 |
| 695 | USDJPY | 04.01.23 10:00 | SELL | 130.241 | 130.781 | 129.161 | 130.781 | SL | -55 | -1.02R | 📈 |
| 696 | USDJPY | 06.01.23 21:00 | SELL | 132.093 | 132.796 | 130.686 | 132.796 | SL | -72 | -1.02R | 📈 |
| 697 | USDJPY | 12.01.23 04:00 | SELL | 131.655 | 132.085 | 130.794 | 130.794 | TP | +85 | +1.97R | 📈 |
| 698 | USDJPY | 18.01.23 19:00 | SELL | 128.448 | 129.320 | 126.705 | 129.320 | SL | -88 | -1.01R | 📈 |
| 699 | USDJPY | 30.01.23 09:00 | SELL | 129.583 | 129.974 | 128.801 | 129.974 | SL | -40 | -1.03R | 📈 |
| 700 | USDJPY | 01.02.23 13:00 | SELL | 129.818 | 130.111 | 129.232 | 129.232 | TP | +57 | +1.96R | 📈 |
| 701 | USDJPY | 03.02.23 16:00 | BUY | 129.940 | 129.462 | 130.896 | 130.896 | TP | +94 | +1.98R | 📈 |
| 702 | USDJPY | 09.02.23 03:00 | BUY | 131.506 | 131.151 | 132.216 | 131.151 | SL | -37 | -1.03R | 📈 |
| 703 | USDJPY | 10.03.23 17:00 | SELL | 134.828 | 135.505 | 133.474 | 133.474 | TP | +134 | +1.98R | 📈 |
| 704 | USDJPY | 15.03.23 15:00 | SELL | 132.653 | 133.324 | 131.311 | 133.324 | SL | -68 | -1.02R | 📈 |
| 705 | USDJPY | 17.03.23 09:00 | SELL | 132.863 | 133.376 | 131.837 | 131.837 | TP | +101 | +1.98R | 📈 |
| 706 | USDJPY | 22.03.23 22:00 | SELL | 131.193 | 131.730 | 130.120 | 130.120 | TP | +106 | +1.98R | 📈 |
| 707 | USDJPY | 28.03.23 08:00 | SELL | 130.611 | 130.978 | 129.877 | 130.978 | SL | -38 | -1.03R | 📈 |
| 708 | USDJPY | 14.04.23 18:00 | BUY | 133.458 | 133.041 | 134.292 | 134.292 | TP | +82 | +1.97R | 📈 |
| 709 | USDJPY | 24.04.23 06:00 | BUY | 134.439 | 134.130 | 135.058 | 134.130 | SL | -32 | -1.04R | 📈 |
| 710 | USDJPY | 25.04.23 16:00 | SELL | 133.913 | 134.249 | 133.241 | 133.241 | TP | +66 | +1.96R | 📈 |
| 711 | USDJPY | 27.04.23 16:00 | BUY | 133.897 | 133.521 | 134.649 | 133.521 | SL | -39 | -1.03R | 📈 |
| 712 | USDJPY | 10.05.23 17:00 | SELL | 134.416 | 134.769 | 133.709 | 134.769 | SL | -37 | -1.03R | 📈 |
| 713 | USDJPY | 07.06.23 04:00 | SELL | 139.370 | 139.611 | 138.888 | 139.611 | SL | -25 | -1.05R | 📈 |
| 714 | USDJPY | 08.06.23 17:00 | SELL | 139.003 | 139.352 | 138.306 | 139.352 | SL | -36 | -1.03R | 📈 |
| 715 | USDJPY | 12.06.23 14:00 | SELL | 139.187 | 139.440 | 138.682 | 139.440 | SL | -26 | -1.05R | 📈 |
| 716 | USDJPY | 18.07.23 11:00 | SELL | 138.222 | 138.546 | 137.574 | 138.546 | SL | -34 | -1.04R | 📈 |
| 717 | USDJPY | 27.07.23 18:00 | BUY | 141.245 | 140.781 | 142.174 | 140.781 | SL | -48 | -1.03R | 📈 |
| 718 | USDJPY | 07.08.23 19:00 | BUY | 142.440 | 142.092 | 143.136 | 143.136 | TP | +68 | +1.97R | 📈 |
| 719 | USDJPY | 21.08.23 13:00 | BUY | 145.764 | 145.472 | 146.348 | 146.348 | TP | +57 | +1.96R | 📈 |
| 720 | USDJPY | 30.08.23 16:00 | SELL | 145.864 | 146.179 | 145.234 | 146.179 | SL | -33 | -1.04R | 📈 |
| 721 | USDJPY | 10.10.23 20:00 | SELL | 148.546 | 148.817 | 148.005 | 148.817 | SL | -28 | -1.04R | 📈 |
| 722 | USDJPY | 15.11.23 21:00 | BUY | 151.369 | 151.009 | 152.088 | 151.009 | SL | -37 | -1.03R | 📈 |
| 723 | USDJPY | 22.11.23 02:00 | SELL | 148.136 | 148.524 | 147.360 | 148.524 | SL | -40 | -1.03R | 📈 |
| 724 | USDJPY | 27.11.23 05:00 | SELL | 149.130 | 149.364 | 148.663 | 148.663 | TP | +46 | +1.95R | 📈 |
| 725 | USDJPY | 01.12.23 20:00 | SELL | 146.841 | 147.360 | 145.803 | 147.360 | SL | -53 | -1.02R | 📈 |
| 726 | USDJPY | 05.12.23 10:00 | SELL | 146.828 | 147.184 | 146.116 | 147.184 | SL | -37 | -1.03R | 📈 |
| 727 | USDJPY | 05.12.23 16:00 | SELL | 146.787 | 147.141 | 146.080 | 147.141 | SL | -37 | -1.03R | 📈 |
| 728 | USDJPY | 07.12.23 05:00 | SELL | 146.848 | 147.135 | 146.275 | 146.275 | TP | +56 | +1.96R | 📈 |
| 729 | USDJPY | 13.12.23 17:00 | SELL | 145.240 | 145.609 | 144.503 | 144.503 | TP | +73 | +1.97R | 📈 |
| 730 | USDJPY | 21.12.23 04:00 | SELL | 143.019 | 143.401 | 142.255 | 142.255 | TP | +75 | +1.97R | 📈 |
| 731 | USDJPY | 27.12.23 19:00 | SELL | 142.047 | 142.344 | 141.453 | 141.453 | TP | +58 | +1.96R | 📈 |
| 732 | USDJPY | 29.12.23 19:00 | SELL | 140.905 | 141.328 | 140.058 | 141.328 | SL | -44 | -1.03R | 📈 |
| 733 | USDJPY | 31.01.24 17:00 | SELL | 146.632 | 147.056 | 145.784 | 147.056 | SL | -44 | -1.03R | 📈 |
| 734 | USDJPY | 02.02.24 16:00 | BUY | 147.958 | 147.531 | 148.811 | 148.811 | TP | +84 | +1.97R | 📈 |
| 735 | USDJPY | 08.02.24 04:00 | BUY | 148.283 | 147.992 | 148.865 | 148.865 | TP | +57 | +1.96R | 📈 |
| 736 | USDJPY | 29.02.24 04:00 | SELL | 150.203 | 150.393 | 149.824 | 149.824 | TP | +37 | +1.94R | 📈 |
| 737 | USDJPY | 04.03.24 01:00 | SELL | 150.103 | 150.352 | 149.605 | 150.352 | SL | -26 | -1.05R | 📈 |
| 738 | USDJPY | 05.03.24 17:00 | SELL | 150.087 | 150.275 | 149.711 | 149.711 | TP | +36 | +1.94R | 📈 |
| 739 | USDJPY | 02.05.24 00:00 | SELL | 154.830 | 155.630 | 153.230 | 155.630 | SL | -81 | -1.01R | 📈 |
| 740 | USDJPY | 15.05.24 12:00 | SELL | 155.640 | 155.890 | 155.141 | 155.141 | TP | +49 | +1.95R | 📈 |
| 741 | USDJPY | 31.05.24 18:00 | BUY | 157.153 | 156.805 | 157.850 | 156.805 | SL | -36 | -1.03R | 📈 |
| 742 | USDJPY | 07.06.24 02:00 | SELL | 155.606 | 155.954 | 154.910 | 155.954 | SL | -36 | -1.03R | 📈 |
| 743 | USDJPY | 12.06.24 16:00 | SELL | 156.157 | 156.455 | 155.562 | 156.455 | SL | -31 | -1.04R | 📈 |
| 744 | USDJPY | 08.07.24 17:00 | SELL | 160.650 | 160.965 | 160.020 | 160.965 | SL | -33 | -1.04R | 📈 |
| 745 | USDJPY | 11.07.24 16:00 | SELL | 158.630 | 159.119 | 157.652 | 157.652 | TP | +97 | +1.98R | 📈 |
| 746 | USDJPY | 17.07.24 09:00 | SELL | 157.876 | 158.145 | 157.338 | 157.338 | TP | +53 | +1.96R | 📈 |
| 747 | USDJPY | 22.07.24 11:00 | SELL | 156.801 | 157.199 | 156.005 | 156.005 | TP | +78 | +1.97R | 📈 |
| 748 | USDJPY | 29.07.24 10:00 | SELL | 153.345 | 153.924 | 152.186 | 153.924 | SL | -59 | -1.02R | 📈 |
| 749 | USDJPY | 30.07.24 21:00 | SELL | 153.194 | 153.767 | 152.048 | 153.767 | SL | -59 | -1.02R | 📈 |
| 750 | USDJPY | 13.08.24 20:00 | SELL | 146.727 | 147.160 | 145.861 | 147.160 | SL | -45 | -1.03R | 📈 |
| 751 | USDJPY | 14.08.24 15:00 | SELL | 146.884 | 147.334 | 145.983 | 147.334 | SL | -46 | -1.03R | 📈 |
| 752 | USDJPY | 14.08.24 18:00 | SELL | 146.757 | 147.315 | 145.641 | 147.315 | SL | -57 | -1.02R | 📈 |
| 753 | USDJPY | 21.08.24 17:00 | SELL | 145.738 | 146.197 | 144.820 | 146.197 | SL | -47 | -1.03R | 📈 |
| 754 | USDJPY | 23.08.24 19:00 | SELL | 144.859 | 145.470 | 143.637 | 143.637 | TP | +121 | +1.98R | 📈 |
| 755 | USDJPY | 10.09.24 19:00 | SELL | 142.280 | 142.754 | 141.332 | 141.332 | TP | +94 | +1.98R | 📈 |
| 756 | USDJPY | 12.09.24 23:00 | SELL | 141.859 | 142.421 | 140.734 | 140.734 | TP | +111 | +1.98R | 📈 |
| 757 | USDJPY | 05.11.24 17:00 | SELL | 151.827 | 152.155 | 151.170 | 152.155 | SL | -34 | -1.04R | 📈 |
| 758 | USDJPY | 21.11.24 12:00 | SELL | 154.392 | 154.855 | 153.465 | 154.855 | SL | -48 | -1.03R | 📈 |
| 759 | USDJPY | 22.11.24 12:00 | SELL | 154.493 | 154.965 | 153.548 | 154.965 | SL | -48 | -1.02R | 📈 |
| 760 | USDJPY | 25.11.24 16:00 | SELL | 153.920 | 154.389 | 152.982 | 154.389 | SL | -48 | -1.03R | 📈 |
| 761 | USDJPY | 26.11.24 03:00 | SELL | 154.005 | 154.474 | 153.068 | 153.068 | TP | +93 | +1.97R | 📈 |
| 762 | USDJPY | 02.12.24 10:00 | SELL | 150.245 | 150.745 | 149.245 | 149.245 | TP | +99 | +1.98R | 📈 |
| 763 | USDJPY | 03.12.24 15:00 | SELL | 149.675 | 150.123 | 148.780 | 148.780 | TP | +88 | +1.97R | 📈 |
| 764 | USDJPY | 06.12.24 06:00 | SELL | 149.875 | 150.252 | 149.121 | 150.252 | SL | -39 | -1.03R | 📈 |
| 765 | USDJPY | 06.12.24 17:00 | SELL | 149.663 | 150.131 | 148.726 | 150.131 | SL | -48 | -1.03R | 📈 |
| 766 | USDJPY | 06.01.25 16:00 | SELL | 156.608 | 157.032 | 155.759 | 157.032 | SL | -44 | -1.03R | 📈 |
| 767 | USDJPY | 15.01.25 09:00 | SELL | 157.339 | 157.695 | 156.627 | 156.627 | TP | +70 | +1.97R | 📈 |
| 768 | USDJPY | 20.01.25 22:00 | SELL | 155.629 | 156.040 | 154.808 | 156.040 | SL | -42 | -1.03R | 📈 |
| 769 | USDJPY | 21.01.25 18:00 | SELL | 155.320 | 155.815 | 154.330 | 155.815 | SL | -51 | -1.02R | 📈 |
| 770 | USDJPY | 22.01.25 03:00 | SELL | 155.414 | 155.819 | 154.604 | 155.819 | SL | -42 | -1.03R | 📈 |
| 771 | USDJPY | 27.01.25 01:00 | SELL | 155.778 | 156.254 | 154.825 | 154.825 | TP | +94 | +1.98R | 📈 |
| 772 | USDJPY | 29.01.25 20:00 | SELL | 155.048 | 155.421 | 154.303 | 155.421 | SL | -38 | -1.03R | 📈 |
| 773 | USDJPY | 30.01.25 03:00 | SELL | 154.711 | 155.108 | 153.918 | 153.918 | TP | +78 | +1.97R | 📈 |
| 774 | USDJPY | 04.02.25 20:00 | SELL | 154.259 | 154.689 | 153.399 | 153.399 | TP | +85 | +1.97R | 📈 |
| 775 | USDJPY | 13.02.25 20:00 | SELL | 153.156 | 153.588 | 152.292 | 152.292 | TP | +85 | +1.97R | 📈 |
| 776 | USDJPY | 19.02.25 12:00 | SELL | 151.643 | 151.951 | 151.026 | 151.026 | TP | +60 | +1.96R | 📈 |
| 777 | USDJPY | 21.02.25 17:00 | SELL | 149.806 | 150.257 | 148.904 | 148.904 | TP | +89 | +1.97R | 📈 |
| 778 | USDJPY | 24.02.25 17:00 | SELL | 149.314 | 149.725 | 148.492 | 149.725 | SL | -42 | -1.03R | 📈 |
| 779 | USDJPY | 25.02.25 17:00 | SELL | 149.170 | 149.632 | 148.246 | 149.632 | SL | -47 | -1.03R | 📈 |
| 780 | USDJPY | 26.02.25 21:00 | SELL | 148.914 | 149.367 | 148.008 | 149.367 | SL | -46 | -1.03R | 📈 |
| 781 | USDJPY | 27.02.25 07:00 | SELL | 149.089 | 149.489 | 148.289 | 149.489 | SL | -41 | -1.03R | 📈 |
| 782 | USDJPY | 03.03.25 23:00 | SELL | 149.400 | 149.962 | 148.276 | 148.276 | TP | +111 | +1.98R | 📈 |
| 783 | USDJPY | 05.03.25 16:00 | SELL | 149.012 | 149.584 | 147.869 | 147.869 | TP | +113 | +1.98R | 📈 |
| 784 | USDJPY | 10.03.25 01:00 | SELL | 147.465 | 148.074 | 146.246 | 148.074 | SL | -62 | -1.02R | 📈 |
| 785 | USDJPY | 13.03.25 20:00 | SELL | 147.619 | 148.060 | 146.737 | 148.060 | SL | -45 | -1.03R | 📈 |
| 786 | USDJPY | 21.03.25 05:00 | BUY | 149.063 | 148.728 | 149.733 | 148.728 | SL | -35 | -1.04R | 📈 |
| 787 | USDJPY | 01.04.25 13:00 | SELL | 149.623 | 150.008 | 148.854 | 150.008 | SL | -40 | -1.03R | 📈 |
| 788 | USDJPY | 03.04.25 01:00 | SELL | 148.698 | 149.208 | 147.678 | 147.678 | TP | +101 | +1.98R | 📈 |
| 789 | USDJPY | 07.04.25 01:00 | SELL | 145.604 | 146.610 | 143.593 | 146.610 | SL | -102 | -1.01R | 📈 |
| 790 | USDJPY | 07.04.25 08:00 | SELL | 145.878 | 146.854 | 143.927 | 146.854 | SL | -99 | -1.01R | 📈 |
| 791 | USDJPY | 09.04.25 00:00 | SELL | 146.142 | 146.821 | 144.783 | 144.783 | TP | +135 | +1.98R | 📈 |
| 792 | USDJPY | 15.04.25 14:00 | SELL | 142.843 | 143.364 | 141.801 | 141.801 | TP | +103 | +1.98R | 📈 |
| 793 | USDJPY | 17.04.25 17:00 | SELL | 142.142 | 142.610 | 141.207 | 142.610 | SL | -48 | -1.03R | 📈 |
| 794 | USDJPY | 18.04.25 06:00 | SELL | 142.313 | 142.658 | 141.623 | 141.623 | TP | +68 | +1.97R | 📈 |
| 795 | USDJPY | 19.05.25 02:00 | SELL | 145.163 | 145.574 | 144.341 | 144.341 | TP | +81 | +1.97R | 📈 |
| 796 | USDJPY | 23.05.25 07:00 | SELL | 143.437 | 143.829 | 142.653 | 142.653 | TP | +77 | +1.97R | 📈 |
| 797 | USDJPY | 29.05.25 20:00 | SELL | 144.146 | 144.633 | 143.173 | 143.173 | TP | +96 | +1.98R | 📈 |
| 798 | USDJPY | 04.06.25 20:00 | SELL | 142.642 | 143.139 | 141.648 | 143.139 | SL | -51 | -1.02R | 📈 |
| 799 | USDJPY | 25.06.25 14:00 | BUY | 145.729 | 145.376 | 146.434 | 145.376 | SL | -36 | -1.03R | 📈 |
| 800 | USDJPY | 30.06.25 06:00 | SELL | 144.293 | 144.678 | 143.523 | 143.523 | TP | +76 | +1.97R | 📈 |
| 801 | USDJPY | 05.08.25 18:00 | SELL | 147.448 | 147.831 | 146.681 | 147.831 | SL | -40 | -1.03R | 📈 |
| 802 | USDJPY | 06.08.25 21:00 | SELL | 147.240 | 147.561 | 146.599 | 147.561 | SL | -33 | -1.04R | 📈 |
| 803 | USDJPY | 07.08.25 10:00 | SELL | 146.857 | 147.211 | 146.148 | 147.211 | SL | -37 | -1.03R | 📈 |
| 804 | USDJPY | 08.08.25 01:00 | SELL | 147.018 | 147.384 | 146.286 | 147.384 | SL | -38 | -1.03R | 📈 |
| 805 | USDJPY | 20.08.25 16:00 | SELL | 147.275 | 147.558 | 146.709 | 147.558 | SL | -29 | -1.04R | 📈 |
| 806 | USDJPY | 26.08.25 19:00 | SELL | 147.316 | 147.640 | 146.667 | 147.640 | SL | -34 | -1.04R | 📈 |
| 807 | USDJPY | 28.08.25 00:00 | SELL | 147.362 | 147.632 | 146.823 | 146.823 | TP | +53 | +1.96R | 📈 |
| 808 | USDJPY | 29.08.25 18:00 | SELL | 146.827 | 147.123 | 146.236 | 147.123 | SL | -31 | -1.04R | 📈 |
| 809 | USDJPY | 01.09.25 09:00 | SELL | 146.915 | 147.183 | 146.380 | 147.183 | SL | -28 | -1.04R | 📈 |
| 810 | USDJPY | 11.09.25 20:00 | SELL | 147.055 | 147.359 | 146.446 | 147.359 | SL | -32 | -1.04R | 📈 |
| 811 | USDJPY | 15.09.25 14:00 | SELL | 147.391 | 147.617 | 146.940 | 146.940 | TP | +44 | +1.95R | 📈 |
| 812 | USDJPY | 13.10.25 22:00 | BUY | 152.285 | 151.956 | 152.943 | 151.956 | SL | -34 | -1.04R | 📈 |
| 813 | USDJPY | 29.10.25 16:00 | SELL | 152.002 | 152.368 | 151.271 | 152.368 | SL | -38 | -1.03R | 📈 |
| 814 | USDJPY | 28.11.25 16:00 | SELL | 156.021 | 156.246 | 155.570 | 156.246 | SL | -24 | -1.05R | 📈 |
| 815 | USDJPY | 28.11.25 18:00 | SELL | 156.028 | 156.299 | 155.485 | 155.485 | TP | +53 | +1.96R | 📈 |
| 816 | USDJPY | 03.12.25 13:00 | SELL | 155.524 | 155.748 | 155.076 | 155.076 | TP | +44 | +1.95R | 📈 |
| 817 | USDJPY | 12.12.25 14:00 | BUY | 155.910 | 155.651 | 156.428 | 155.651 | SL | -27 | -1.05R | 📈 |
| 818 | USDJPY | 15.12.25 05:00 | SELL | 155.427 | 155.708 | 154.866 | 154.866 | TP | +55 | +1.96R | 📈 |
| Totale: 336 | +1,207 | +45.3R | |||||||||
Tutte le operazioni sullo yen — sia della prima versione (818 nel 2008–2025) sia di Puria 2.0 (1,030 nel 2008–2026) — sono nel diario Excel, su fogli separati.
Errori frequenti
- Operare la versione classica con un take profit di 10–20 pip. Il test mostra che sul lungo periodo lo spread si mangia tutto il risultato.
- Entrare prima della chiusura della barra. EMA 5 e MACD si «ridisegnano» dentro la candela. Il segnale esiste solo su una barra chiusa.
- Calcolare le LWMA solo su Low. Così non ci sono quasi acquisti. Per gli acquisti in Puria 2.0 le LWMA si calcolano su High.
- Operare contro il trend H4 e settimanale. Senza questi filtri le operazioni sono di più e il risultato è peggiore.
- Usare uno stop fisso con qualsiasi volatilità. Sull’oro lo stop è passato da $6 a $35 in 18 anni — i pip fissi qui non funzionano.
- Vendere USDJPY durante gli interventi. Nel 2026 tutte queste vendite si sono chiuse allo stop.
- Operare tutte le coppie della tabella dell’autore. Anche Puria 2.0 resta positiva solo sugli strumenti in trend — l’oro e in parte lo yen.
- Credere ai test di 3 mesi. Il nostro vecchio test di 3–12 mesi era positivo, mentre 17 anni di storico hanno mostrato una perdita.
FAQ: domande frequenti sul Metodo Puria
Il Metodo Puria funziona nel 2026?
La versione classica — no: 13,002 operazioni nel 2008–2024 hanno dato −19,276 pip. Puria 2.0 sull’oro — sì: nel 2026 (gennaio–ottobre) +10.6R su 40 operazioni, e le regole sono state scelte prima del 2024. Su USDJPY nel 2026 sono positivi solo gli acquisti (+2.7R), le vendite sono negative.
Perché proprio l’oro?
Il segnale Puria è di trend, e negli ultimi 18 anni l’oro si è mosso con trend lunghi. Abbiamo testato le stesse regole su 33 strumenti: la maggior parte delle coppie di valute non mostra alcun vantaggio. Tra gli strumenti con storico dal 2008, Puria 2.0 è positiva nel 2008–2023 solo sull’oro e su USDJPY, e nel 2026 è rimasto positivo solo l’oro.
Non è sovra-ottimizzazione sullo storico?
Abbiamo fatto di tutto per evitarla: le regole sono state scelte sul 2008–2023, stop e take profit presi dalla prima versione senza modifiche, e il 2024–2026 testato «alla cieca». Anche tutte le 16 combinazioni vicine di stop e take profit sono positive. Il rischio non si può escludere del tutto — per questo continueremo ad aggiornare le statistiche.
Spostare lo stop a breakeven rende redditizia la versione classica?
Abbiamo testato il breakeven dopo +8, +10 e +12 pip. Su tutte e tre le coppie il risultato è rimasto negativo — più o meno allo stesso livello.
Il MACD deve confermare sulla stessa candela o può farlo dopo?
Il test principale è rigoroso: MACD sulla candela dell’incrocio. La variante morbida (conferma entro 3 candele) peggiora ancora di più la versione classica. Per la prima versione migliorata su USDJPY dava +3,578 pip invece di +2,692, ma le LWMA speculari risolvono lo stesso problema in modo più semplice e più onesto.
Quale timeframe è il migliore?
H1. Su M30 ci sono troppi incroci falsi, su H4 poche operazioni e un risultato instabile.
Esiste un EA per il Metodo Puria?
Un EA pronto non c’è. La strategia è meccanica — facile da automatizzare. Per il trading manuale c’è un template Puria 2.0 per MT4 pronto: LWMA 85 e 75 rosse su Low (vendite), verdi su High (acquisti), EMA 5 blu, MACD 15/26/1 e ATR 14 per lo stop. La EMA 50 arancione è visibile solo su H4 e la EMA 20 solo su W1: cambia timeframe per verificare il trend. Il lotto si calcola comodamente con il nostro EA gratuito S4U.PRO Trade Panel.
È un guadagno garantito?
No. Un test è storia, non una promessa. Anche sull’oro c’è stato un anno a −16R e 12 stop di fila. Fai trading solo con soldi che puoi permetterti di perdere e prova prima la strategia su un conto demo.
Video: il Metodo Puria testato su operazioni reali
Il vecchio video dell’autore della strategia:
Conclusione
Il Metodo Puria nella sua forma originale — M30, stop di 14 pip e take profit di 10–25 pip — non è redditizio sullo storico lungo: perdita su tutte e quattro le coppie testate, −19,276 pip in 17 anni. Il problema non sono gli indicatori, ma il take profit piccolo che lo spread divora.
Puria 2.0 — H1, trend H4 e settimanale, LWMA speculari, stop 1.5 ATR e take profit 2R — ha fatto +108R su 994 operazioni sull’oro nel 2008–2026, con 14 anni positivi su 19. Abbiamo fissato le regole sul 2008–2023, e il 2026, che non ha partecipato alla scelta, è anch’esso positivo: +10.6R. Non sono «50 pip al giorno», ma circa +0.1R per operazione — modesto, ma verificato e senza martingala.
Su USDJPY la strategia ha funzionato fino al 2025, ma nel 2026 le vendite contro uno yen in indebolimento — sullo sfondo degli interventi — si chiudevano allo stop. La nostra conclusione: oggi lo strumento principale per il Metodo Puria è l’oro; su USDJPY solo acquisti e con prudenza, niente vendite. Inizia con un conto demo. Se vuoi un’altra strategia testata sull’oro, guarda FVG sull’oro (185 operazioni con diario).
Un’altra strategia sull’oro che abbiamo testato: la strategia Kortik («Pugnale», XAUUSD, W1+D1+H1) testata su 21 anni di storico. Le regole classiche dell’autore hanno dato +112R su 589 operazioni 2005–2026, e Kortik 2.0 con stop corretto +134R; anche il 2026 è in utile.
Questo articolo ha scopo didattico e non costituisce una raccomandazione di investimento. Il trading su Forex e CFD comporta un alto rischio di perdere denaro. I risultati passati non garantiscono profitti futuri. Dati: storico quotazioni MetaTrader 4 (Alpari, ora del terminale GMT+2/+3) per il 2008–2025; 2026 — candele orarie di Yahoo Finance (UTC), oro — future COMEX (GC). Le quotazioni del tuo broker possono differire leggermente.