Contenido 14
- Reglas del Método Puria (original)
- Cómo probamos la estrategia
- Resultado: el Método Puria clásico pierde dinero
- Puria 2.0: la versión mejorada en oro
- Cómo comprobamos que no es sobreajuste
- Estadísticas: 994 operaciones en oro en 2008–2026
- Ejemplos de operaciones Puria 2.0 paso a paso
- Galería: todas las operaciones en oro 2024–2026
- Cómo calcular el lote en oro
- Resultados en USDJPY: por qué el yen está al final del artículo
- Errores frecuentes
- FAQ: preguntas frecuentes sobre el Método Puria
- Vídeo: el Método Puria probado con operaciones reales
- Conclusión
El Método Puria es una de las estrategias forex sencillas más conocidas: tres medias móviles y MACD, un take profit pequeño y la promesa de «al menos 50 pips al día». Publicamos este artículo hace muchos años y desde entonces lo han leído miles de traders.
En 2026 probamos la estrategia con un programa en todo el historial. Primero, estrictamente con las reglas del autor: 13,002 operaciones en cuatro pares de divisas durante 2008–2024, con el spread incluido. Después la mejoramos paso a paso y encontramos una versión que funciona en el oro (XAUUSD): ganancia en 2008–2025 y ganancia en 2026, un año que no usamos para elegir las reglas. A continuación: las reglas originales, los resultados honestos de la versión clásica, Puria 2.0 en oro con todas las operaciones y, por separado, lo que ocurrió en USDJPY.
Reglas del Método Puria (original)
Estas son las reglas tal como siempre aparecieron en este artículo. Son las que probamos.
Indicadores
En un gráfico H1 o M30 (según el par, ver la tabla de abajo) se colocan:
- Moving Average 1: periodo 85, método Linear Weighted (LWMA), aplicar a Low, color rojo.
- Moving Average 2: periodo 75, método Linear Weighted, aplicar a Low, color rojo.
- Moving Average 3: periodo 5, método Exponential (EMA), aplicar a Close, color amarillo.
- MACD: EMA rápida 15, EMA lenta 26, MACD SMA 1.
Todos los indicadores vienen de serie en MetaTrader 4 y 5. Una plantilla lista para MT4 está al final de esta sección.

Entrada en la operación
- Compra: la EMA 5 amarilla cruza las dos LWMA rojas de abajo hacia arriba y el MACD confirma — la barra cerró por encima del nivel cero.
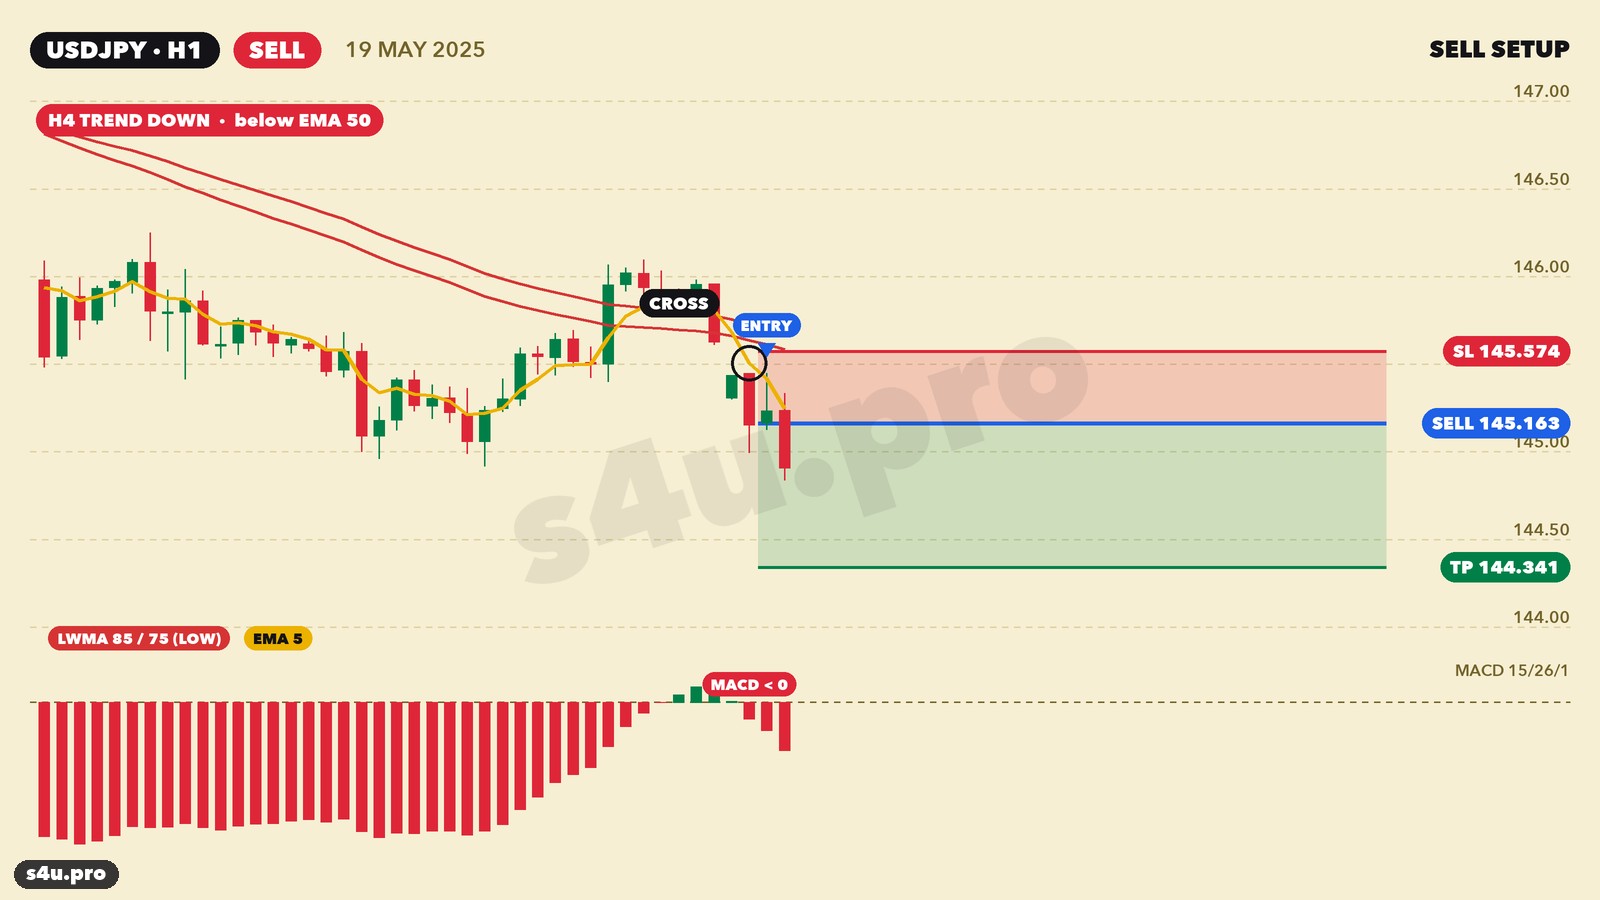
- Venta: la EMA 5 amarilla cruza las dos LWMA rojas de arriba hacia abajo y la barra del MACD cerró por debajo de cero.
- Stop Loss: como máximo 14 pips.
- Take Profit: fijo, distinto para cada par.
Pares, timeframes y take profit
| Par | Timeframe | Take Profit |
|---|---|---|
| AUDJPY | M30 | 15 pips |
| NZDUSD | H1 | 25 pips |
| USDCAD | H1 | 20 pips |
| EURGBP | H1 | 10 pips |
| USDJPY | M30 | 15 pips |
| GBPUSD | M30 | 20 pips |
| USDCHF | M30 | 10 pips |
| EURCHF | H1 | 15 pips |
| AUDUSD | M30 | 10 pips |
| EURJPY | M30 | 15 pips |
| CHFJPY | H1 | 15 pips |
| CADJPY | M30 | 20 pips |
| EURUSD | M30 | 15 pips |
La idea del autor: «mejor ganar un poco cada día». Un take profit pequeño se alcanza a menudo y el stop, según el autor, «ocurre muy raramente». Veamos si es cierto.
- Descargar la plantilla clásica para MetaTrader 4 — method_puria.tpl
- Nuestra antigua prueba manual de 2018–2019 — aquí >>
Cómo probamos la estrategia
Antes probábamos la estrategia a mano en Forex Tester: unos meses en cada par. Esta vez la pasamos con un programa por todas las barras, sin huecos y sin elegir operaciones «cómodas».
- Datos: historial de cotizaciones de MetaTrader 4 (Alpari), 2008–2024, hora del terminal.
- Pares: GBPUSD, EURUSD, USDJPY (M30) y USDCAD (H1), los de historial más largo y limpio. Timeframes y take profits estrictamente de la tabla del autor.
- Señal: en la barra cerrada la EMA 5 está al otro lado de ambas LWMA y en la barra anterior todavía no; el MACD en la misma barra está por encima de cero (compra) o por debajo de cero (venta).
- Entrada: en la apertura de la barra siguiente. Stop de 14 pips, take profit de la tabla. Una operación por par a la vez.
- Spread: se descuenta de cada operación — GBPUSD 1.5 pips, EURUSD 1.0, USDJPY 1.2, USDCAD 1.8.
- Precisión: si en una barra M30 el precio tocó el stop y el take profit, miramos en M5 qué ocurrió primero.
Resultado: el Método Puria clásico pierde dinero
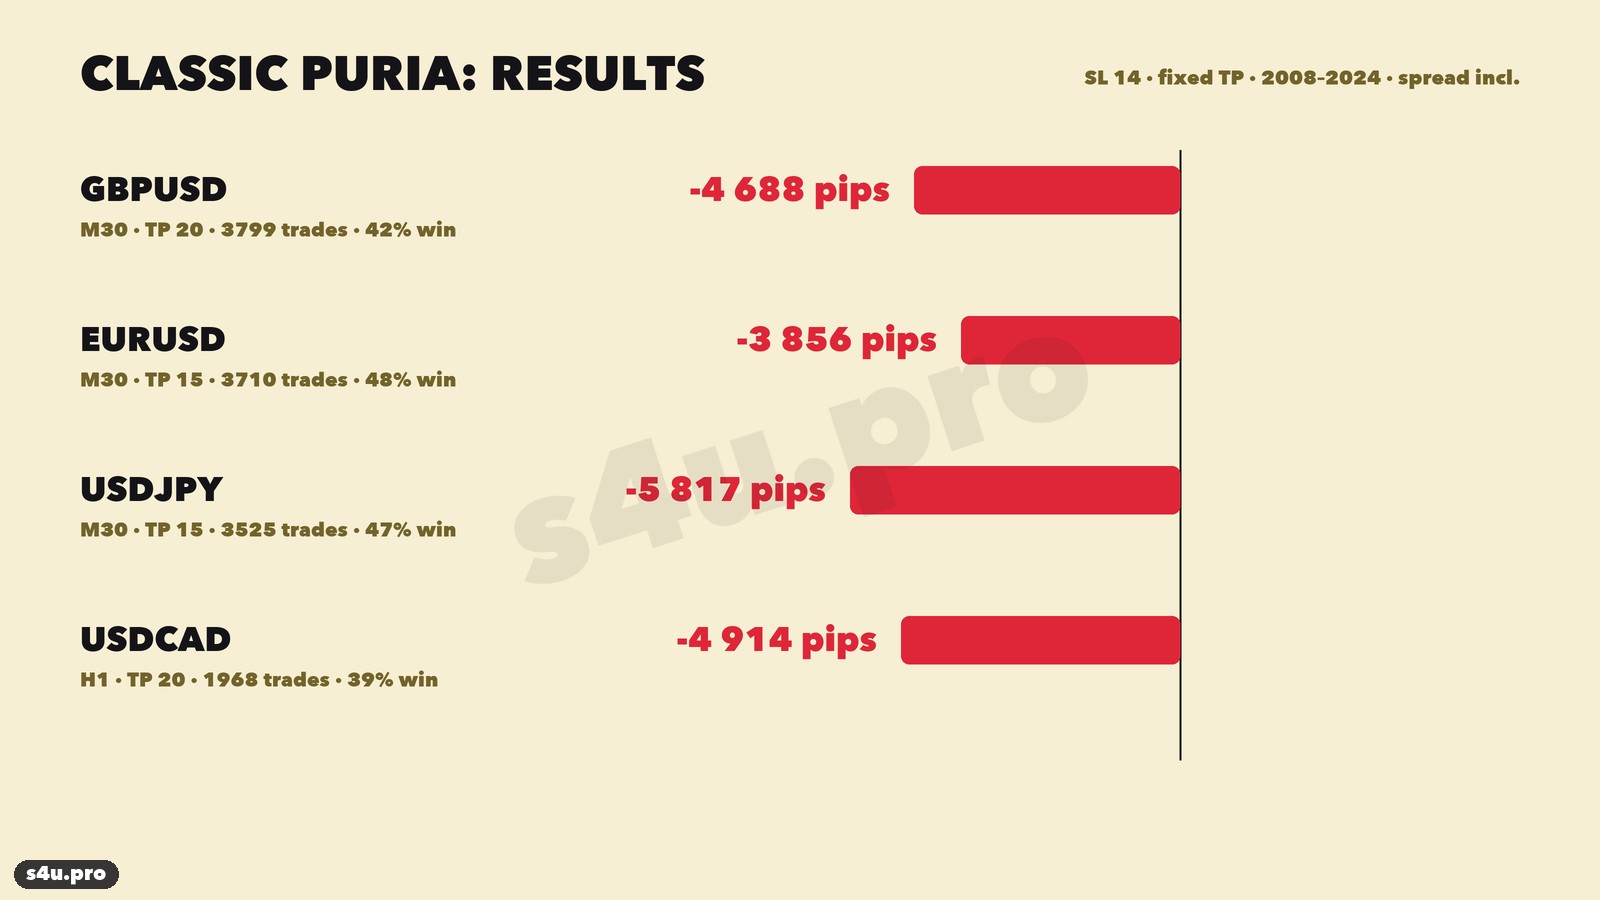
| Par | TF / take profit | Operaciones | Ganadoras | Resultado, pips |
|---|---|---|---|---|
| GBPUSD | M30 / 20 | 3,799 | 42% | −4,688 |
| EURUSD | M30 / 15 | 3,710 | 48% | −3,856 |
| USDJPY | M30 / 15 | 3,525 | 47% | −5,817 |
| USDCAD | H1 / 20 | 1,968 | 39% | −4,914 |
| Total | 13,002 | −19,276 |
Ningún par terminó en ganancia. Las curvas de capital bajan casi en línea recta: no son «años malos», sino una pérdida constante en todo el historial.
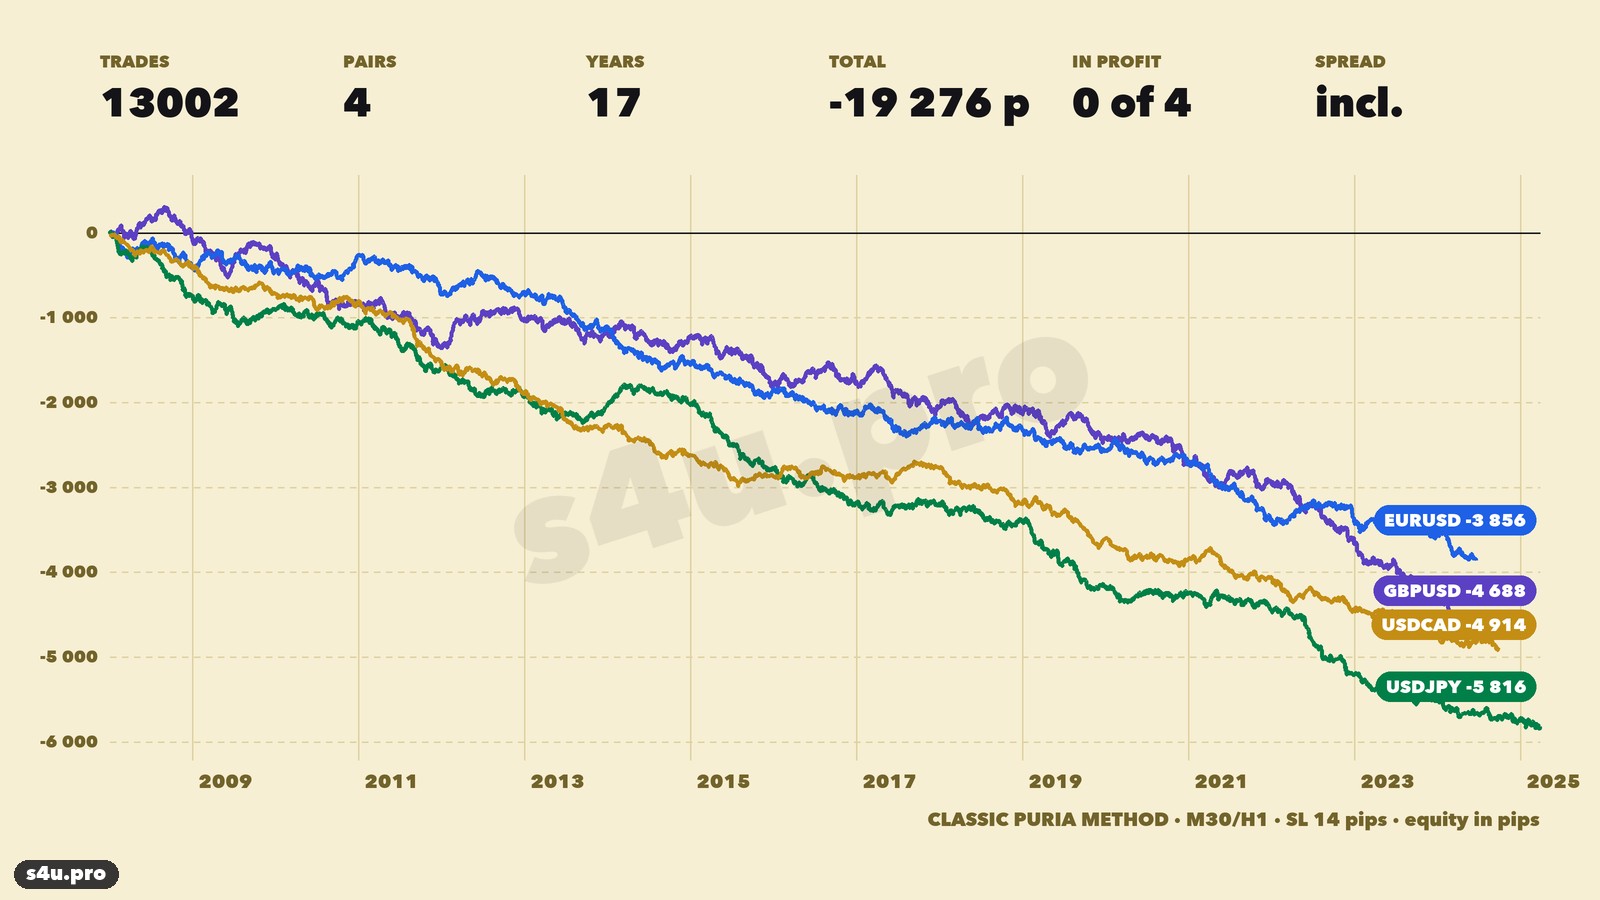
La promesa de que «el stop ocurre muy raramente» tampoco se cumplió: el 52–61% de las operaciones cerró en el stop. Un stop de 14 pips en M30 es menor que el rango medio de una sola vela de GBPUSD; el ruido normal lo saca.
Por qué no funciona: el spread se lo come todo
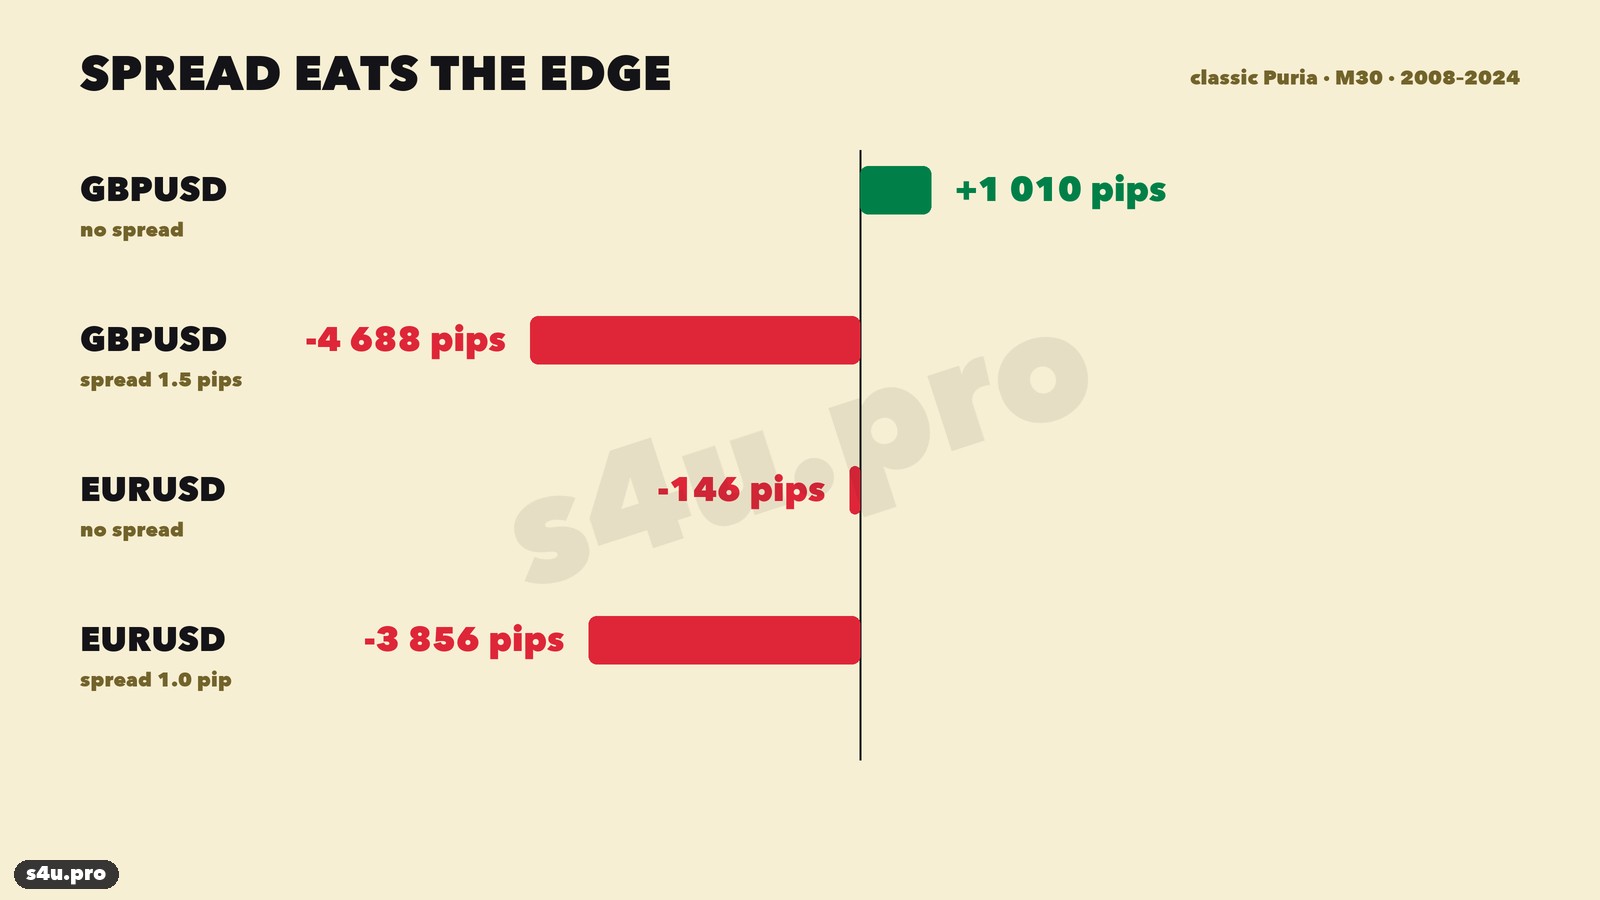
Repetimos la misma prueba sin spread. Entonces GBPUSD da +1,010 pips y EURUSD, cerca de cero (−146). Es decir, la señal en sí casi no da ventaja, y con un take profit de 15–20 pips un spread de 1–1.5 pips se lleva el 7–10% de cada operación ganadora y suma lo mismo a cada pérdida. En miles de operaciones eso convierte el cero en una gran pérdida.
¿Y la antigua prueba de +84%?
En la prueba manual de 2018–2019 GBPUSD M30 mostró +84% en un año, y allí las operaciones perdedoras «se cerraban en cero». Tomamos el mismo periodo (agosto de 2018 – junio de 2019) y probamos dos variantes: estrictamente según las reglas y moviendo el stop a breakeven tras +10 pips. Ambas dieron cerca de −100 pips después del spread. El breakeven tampoco ayuda en todo el historial: −4,234 pips en GBPUSD, −3,998 en EURUSD, −6,036 en USDJPY.
Una prueba manual siempre tiene riesgo de errores: se saltan operaciones, se «ajusta» la entrada, se ignora el spread. Por eso ahora probamos las estrategias solo con programas y mostramos cada operación.
Puria 2.0: la versión mejorada en oro
La señal en sí — el cruce de la EMA 5 con dos LWMA y la confirmación del MACD — es por naturaleza una señal de tendencia. Un take profit fijo y pequeño obliga a salir antes de que la tendencia tenga tiempo de moverse. Mantuvimos los indicadores del autor y cambiamos cinco cosas. Las tres primeras las encontramos antes, en pares de divisas; la cuarta y la quinta, al analizar por qué la primera versión mejorada dejó de funcionar en el yen.
- Timeframe H1 en lugar de M30. Menos cruces falsos y el spread pesa menos frente al movimiento.
- Filtro de tendencia H4. Compramos solo si la última vela H4 cerrada cerró por encima de la EMA 50 en H4. Vendemos solo si cerró por debajo.
- Stop y objetivo según la volatilidad. Stop Loss = 1.5 × ATR(14) en H1, Take Profit = 2 stops (2R). Una operación a la vez.
- LWMA «espejo». Para las ventas, las LWMA 85 y 75 rojas se construyen sobre Low, como en el original. Para las compras, las mismas LWMA pero sobre High.
- Filtro de tendencia semanal. Compramos solo si la última semana cerrada cerró por encima de la EMA 20 en el gráfico semanal. Vendemos solo si cerró por debajo.
Descargar la plantilla Puria 2.0 para MetaTrader 4 — puria_2_0.tpl (XAUUSD H1).
LWMA 85 y 75 rojas sobre Low para ventas, verdes sobre High para compras, EMA 5 azul, MACD 15/26/1 y ATR 14 para el stop. La EMA 50 naranja solo se ve en H4 y la EMA 20 solo en el gráfico semanal: cambia de timeframe para comprobar la tendencia.
Por qué LWMA «espejo»
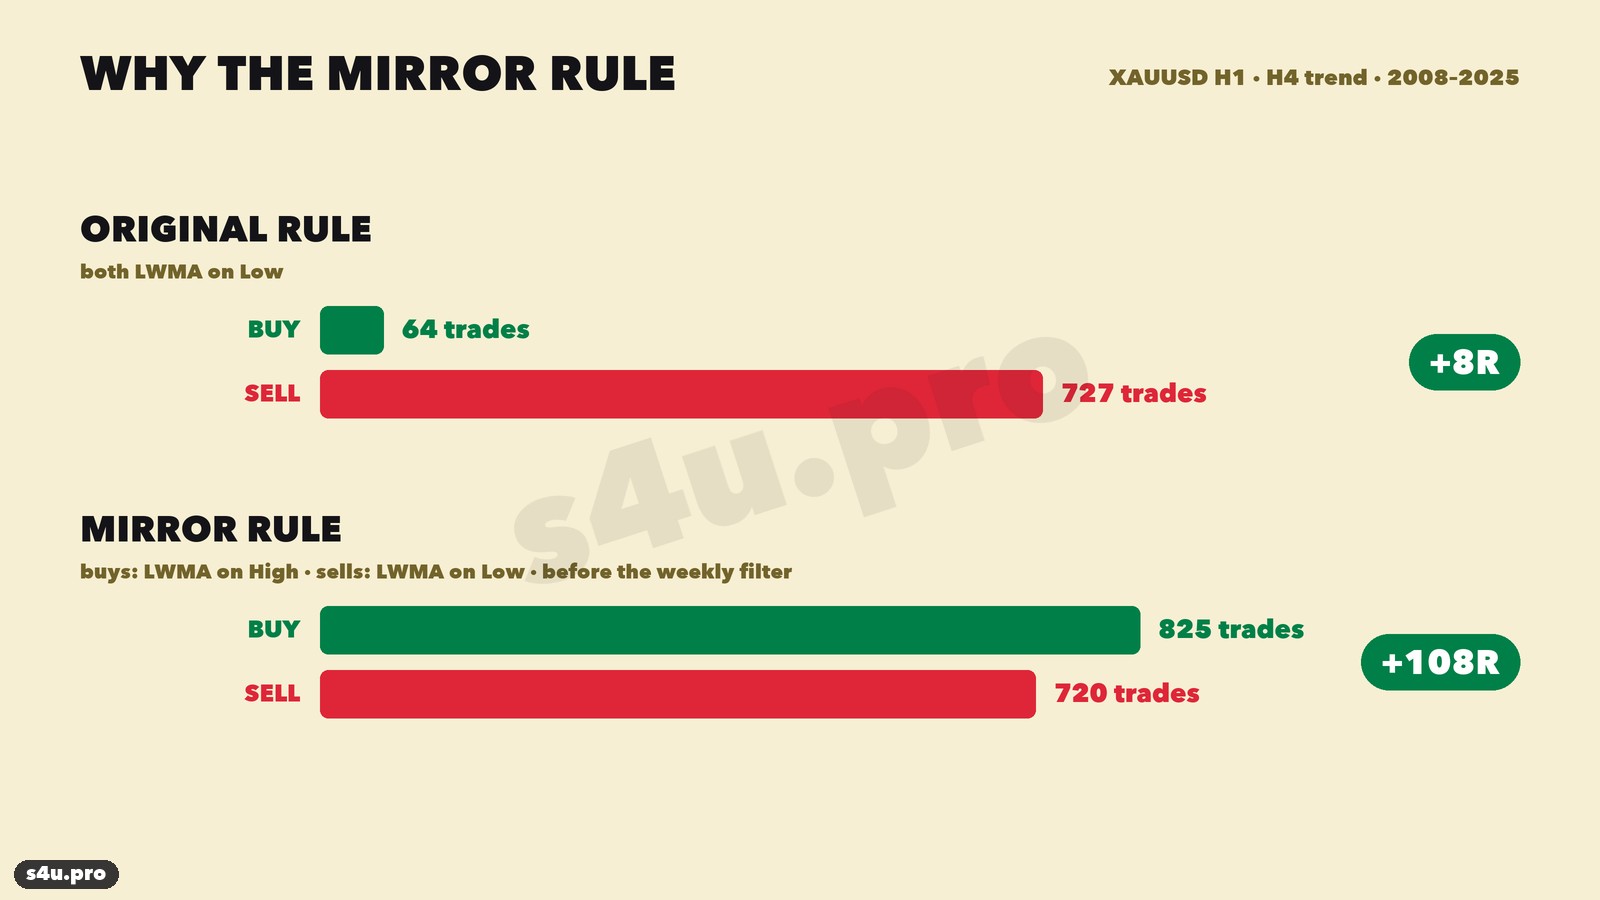
En el original las dos líneas rojas se construyen sobre los mínimos de las velas (Low). El cierre casi siempre está por encima del mínimo, así que la EMA 5 cruza estas líneas hacia arriba demasiado pronto, cuando el MACD casi siempre sigue por debajo de cero. Con la regla «MACD en la misma vela» casi no hay compras: en oro en 2008–2025 hay 64 compras frente a 727 ventas. Una estrategia que casi solo vende está condenada en un mercado alcista.
Simplemente hicimos la regla simétrica: para comprar, la EMA 5 debe cruzar LWMA construidas sobre los máximos (High), igual que para vender cruza LWMA sobre los mínimos. Compras y ventas quedan casi a la par (825 y 720), y el resultado en oro en 2008–2025 sube de +8R a +108R, incluso antes del filtro semanal.
El filtro semanal elimina operaciones contra la gran tendencia: hay menos operaciones (994 en lugar de 1,600 en 2008–2026), el drawdown baja de −43R a −34R y el profit factor sube de 1.11 a 1.17.
Cómo comprobamos que no es sobreajuste
Ajustar parámetros al historial es fácil: prueba cien variantes y alguna seguro que «gana». Por eso probamos de forma que los últimos años no influyeran en la elección de las reglas.
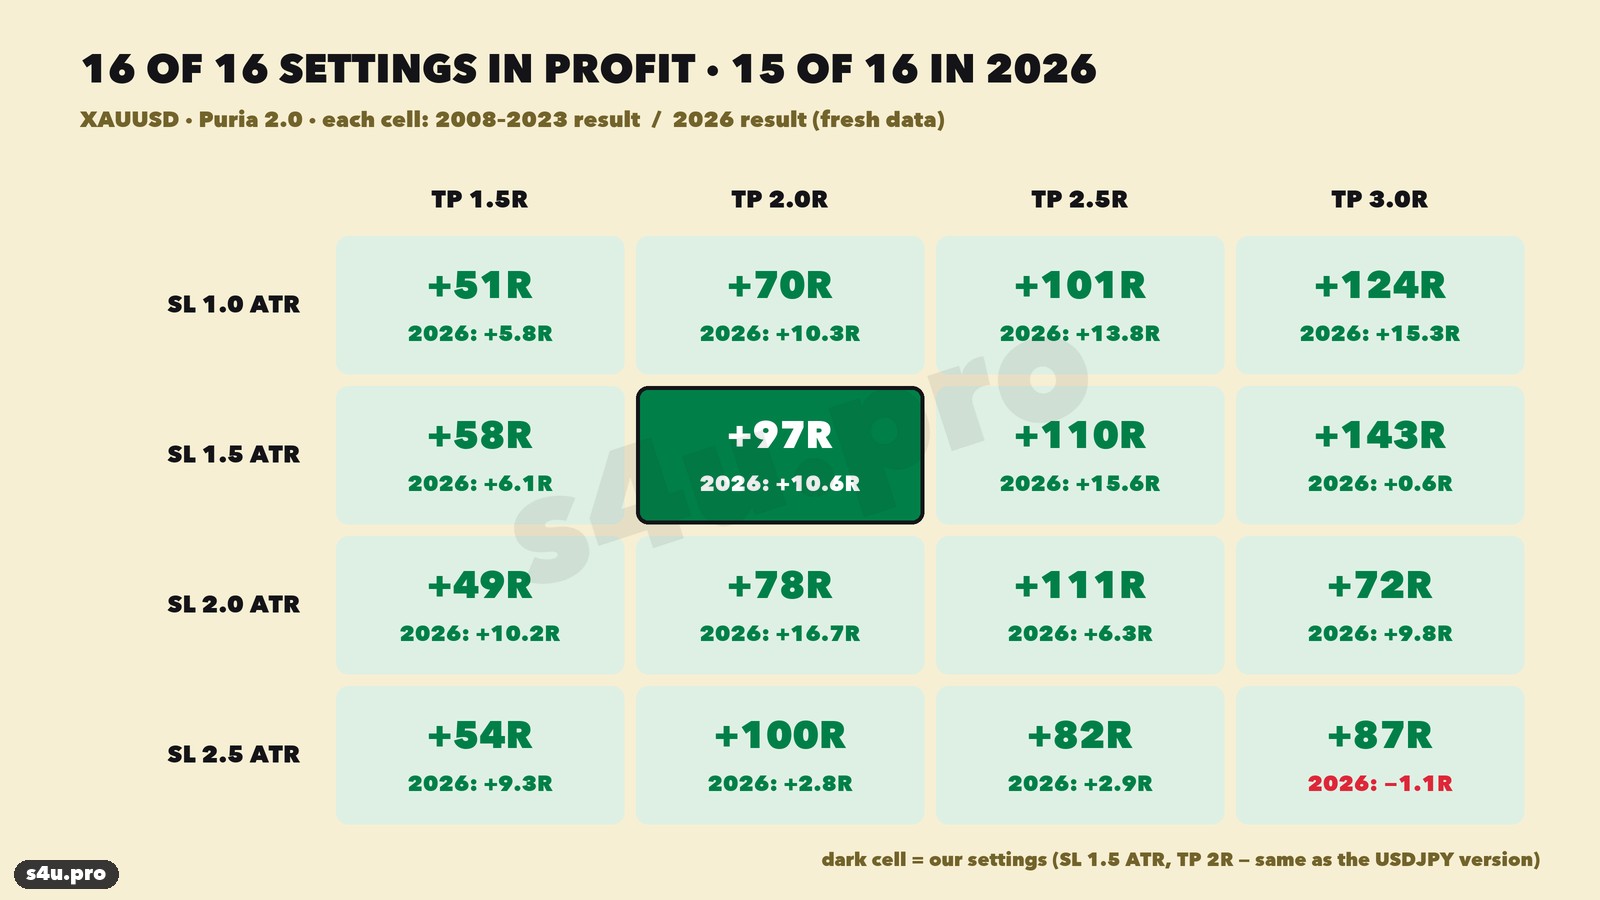
- Las reglas se eligieron con 2008–2023. El stop de 1.5 ATR y el take profit 2R son los mismos que en la primera versión mejorada para USDJPY; no los ajustamos al oro.
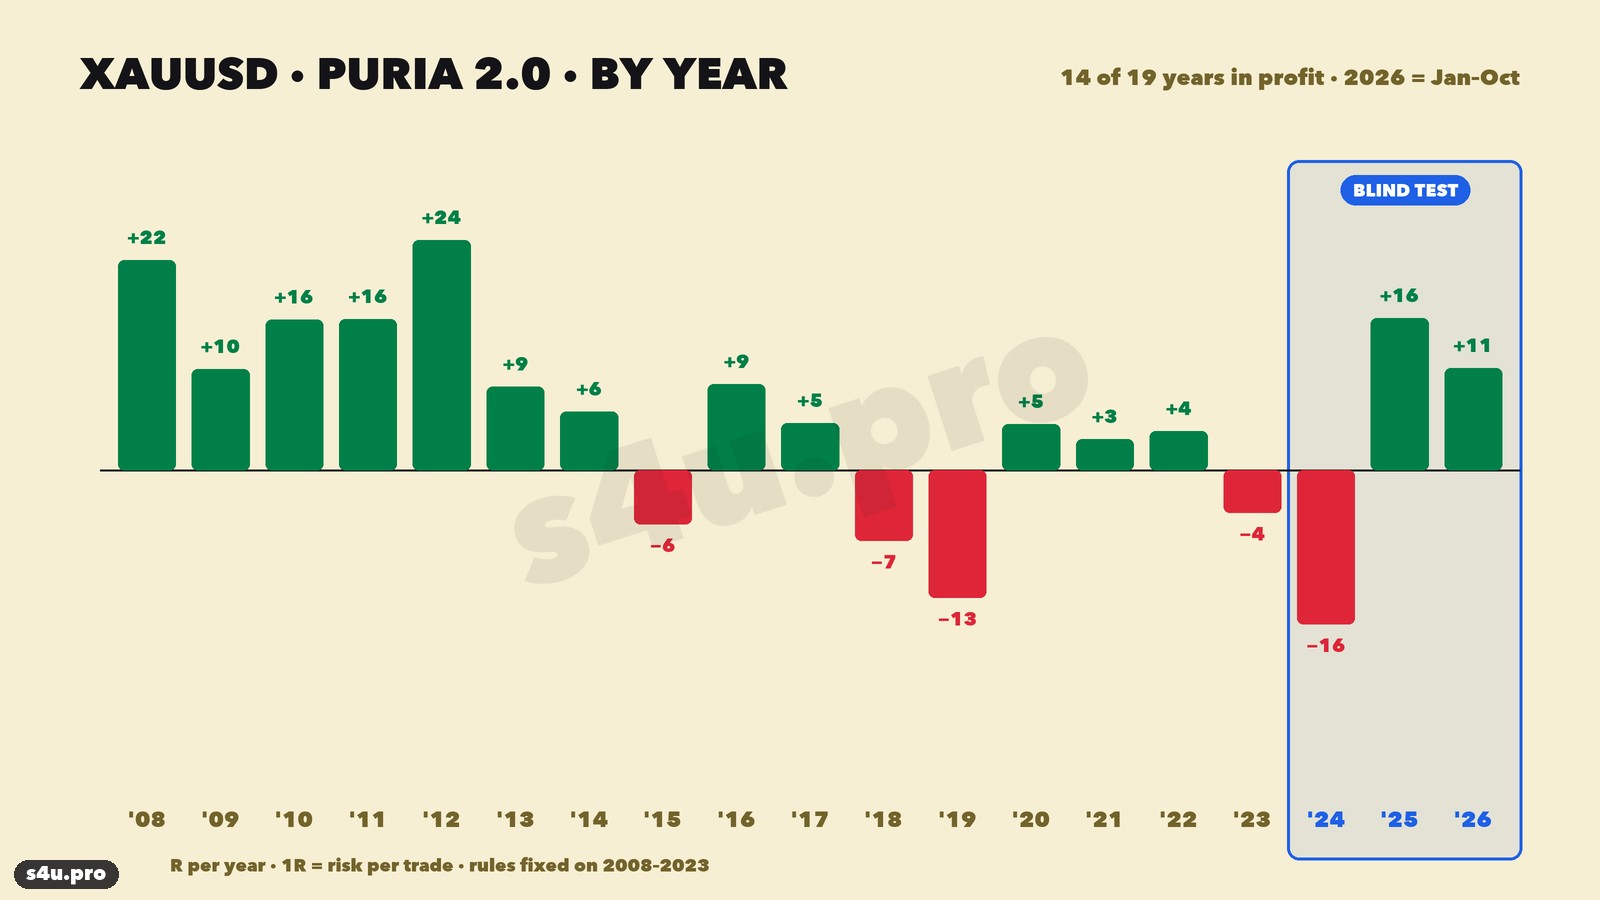
- 2024–2026 es una prueba «a ciegas». 2024–2025 con el historial de Alpari, 2026 (enero–octubre) con cotizaciones nuevas que no estaban en el historial principal.
- Resultado de la prueba a ciegas: 2024 −16R, 2025 +15.8R, 2026 +10.6R (40 operaciones, 17 take profits).
- Los ajustes vecinos también funcionan. Probamos 16 combinaciones de stop (1–2.5 ATR) y take profit (1.5–3R). Las 16 ganan en 2008–2023 y 15 de 16 ganan en 2026. El resultado no depende de un único número «afortunado».
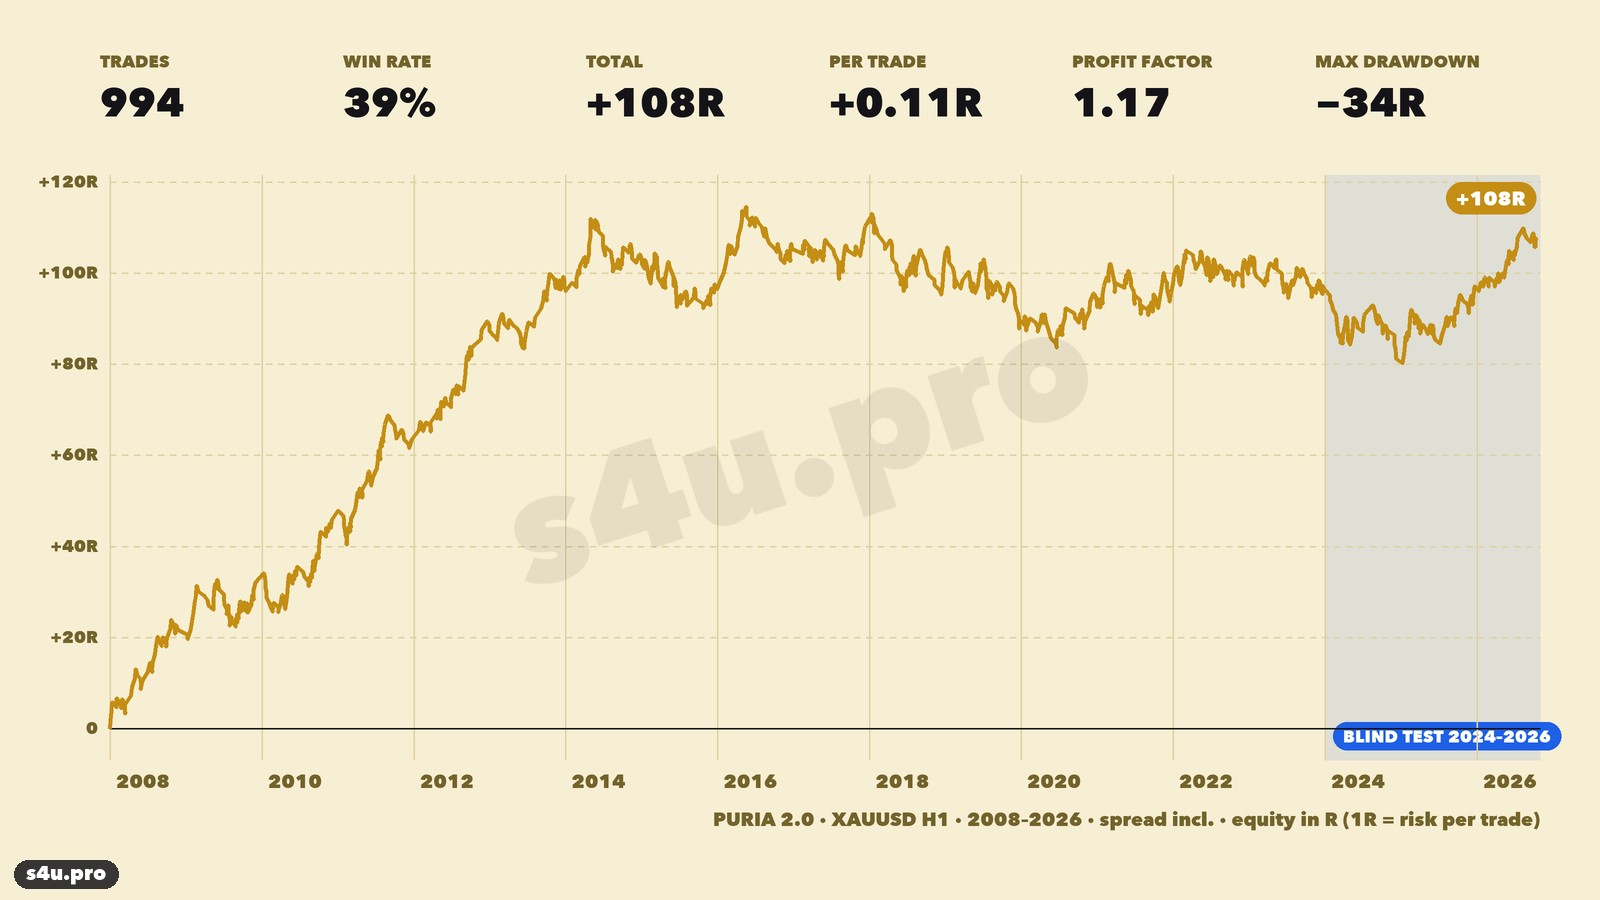
Estadísticas: 994 operaciones en oro en 2008–2026
Cifras principales
| XAUUSD H1, Puria 2.0 | 2008–2026 | 2008–2023 (elección de reglas) | 2024–2025 (prueba a ciegas) | 2026 (prueba a ciegas) |
|---|---|---|---|---|
| Operaciones | 994 | 846 | 108 | 40 |
| Ganadoras | 39% | 39% | 34% | 43% |
| Resultado | +107.7R | +97.3R | −0.2R | +10.6R |
| Profit factor | 1.17 | 1.18 | 1.00 | 1.46 |
| Drawdown máx. | −34R | −31R | −17R | −4R |
R es el riesgo de una operación. +107.7R significa: si arriesgas el 1% de la cuenta en cada operación, el resultado es de cerca de +108% en 19 años sin reinversión, alrededor de 5.7% al año. De media, +0.11R por operación después del spread. Unas 50 operaciones al año, menos de una por semana.
Resultados por año
14 años de 19 son positivos. El mejor año es 2012 (+23.8R) y el peor, 2024 (−16R): el oro subió todo el año con una tendencia fuerte y retrocesos cortos y bruscos, y la estrategia estuvo mucho tiempo tocando stops, incluidos 12 seguidos. 2025 y 2026 compensaron esa pérdida.
Compras y ventas
Las compras dieron +96.2R (609 operaciones) y las ventas +11.5R (385 operaciones). El oro subió durante mucho tiempo y la mayor parte de la ganancia vino de operaciones a favor de la tendencia alcista. Aun así, las ventas también ganan, y en 2026 ganaron más que las compras: +8.7R frente a +1.9R. No recomendamos desactivar las ventas: sería ajustarse al pasado.
2026 en el oro
| 2026 (enero–octubre), XAUUSD H1 | Valor |
|---|---|
| Operaciones | 40 (16 compras, 24 ventas) |
| En take profit | 17 (43%) |
| Compras | +1.9R |
| Ventas | +8.7R |
| Resultado | +10.6R, drawdown −4R, no más de 3 stops seguidos |
La ganancia se hizo a lo largo de varios meses, no con una sola operación afortunada. Una advertencia: el historial de Alpari termina en diciembre de 2025, así que 2026 se calculó con cotizaciones de futuros del oro (Yahoo Finance, hora UTC). El precio del futuro difiere un poco del spot del bróker, y las velas H4 y semanales se cortan en UTC: algunas operaciones en tu bróker pueden no coincidir.
Cuánto es en dinero
El oro se ha encarecido mucho, así que el stop en dólares ha crecido: en 2008, 1.5 ATR en H1 eran unos $6; en 2025, unos $16; en 2026, unos $35 por onza. Comparar años en dólares no tiene sentido, por eso contamos en R y en porcentaje de riesgo. Con un riesgo del 1% por operación: 2008–2026, cerca de +108%; 2026 (10 meses), cerca de +10.6%.
Ejemplos de operaciones Puria 2.0 paso a paso
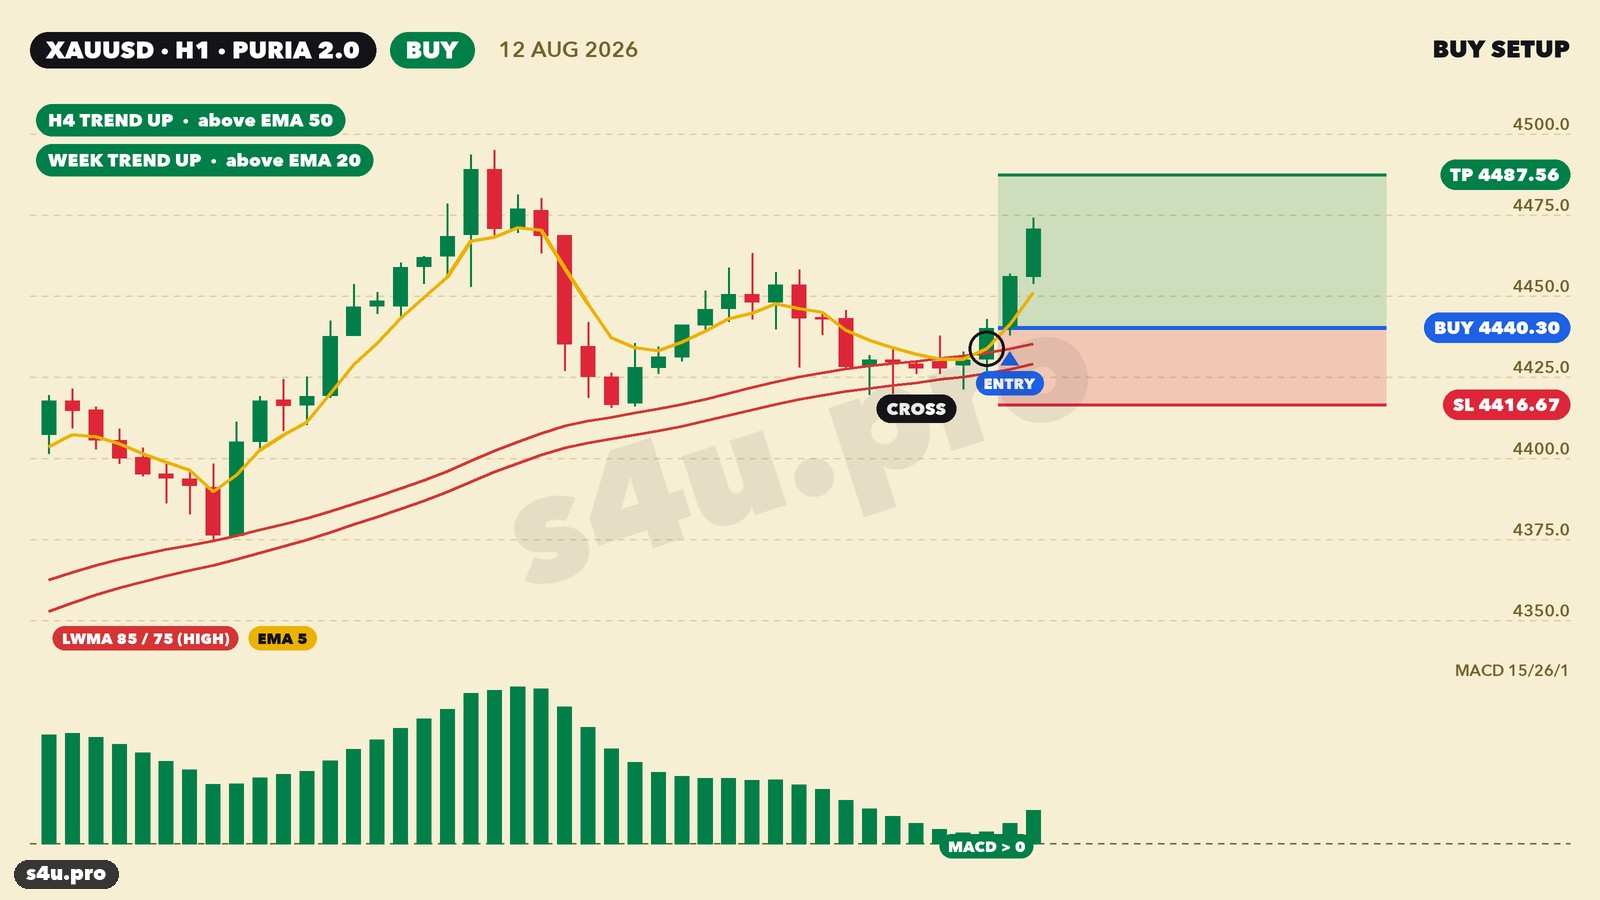
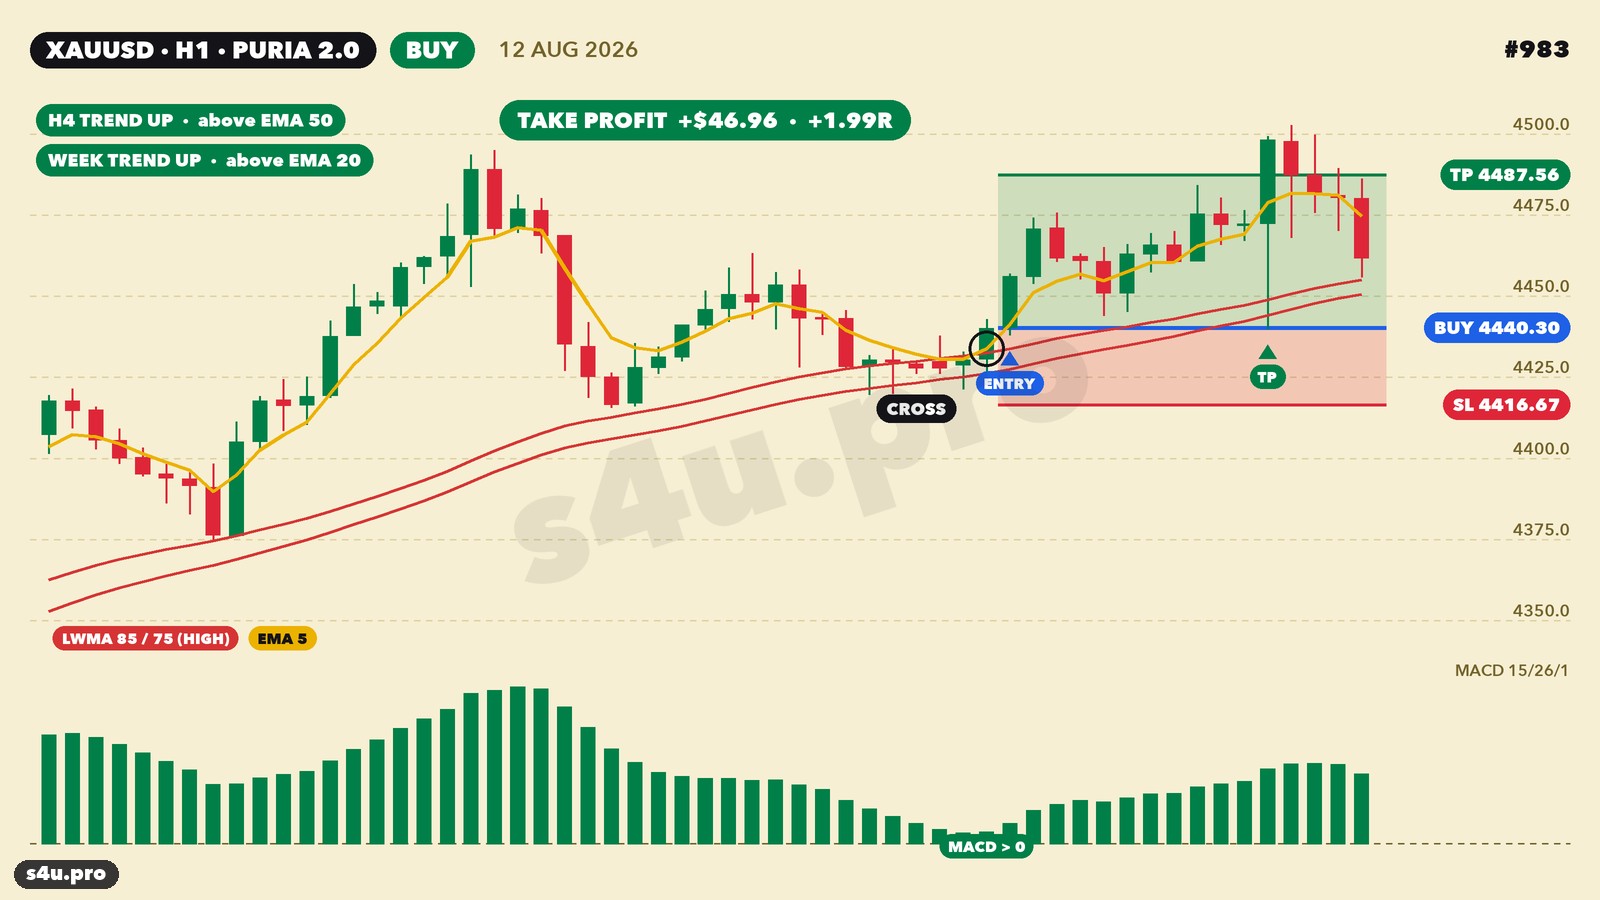
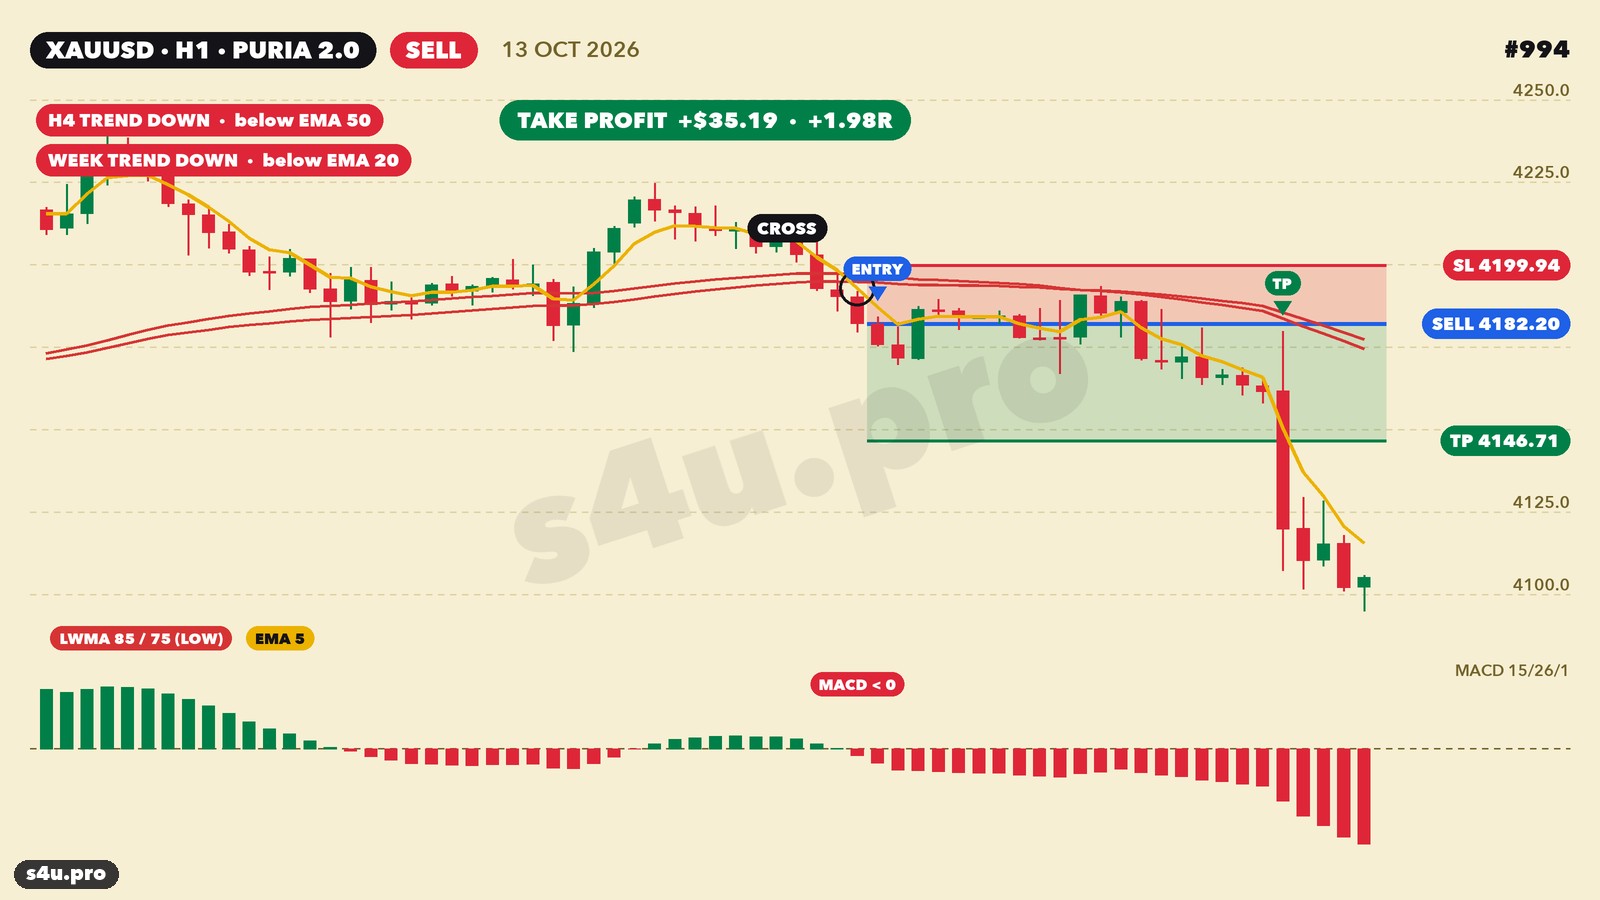
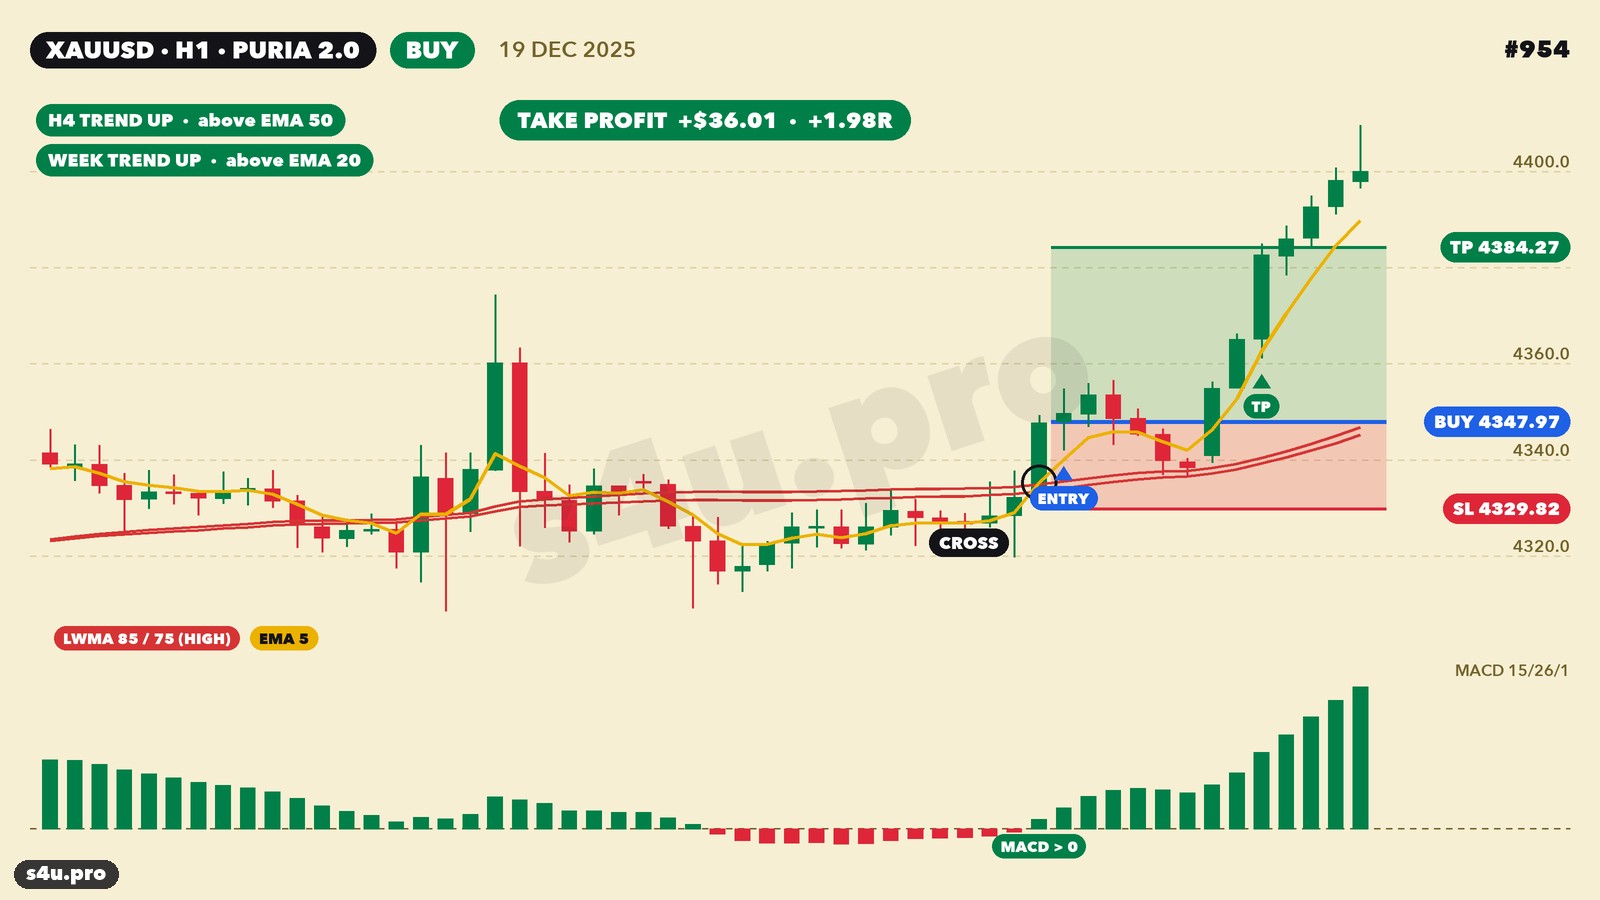
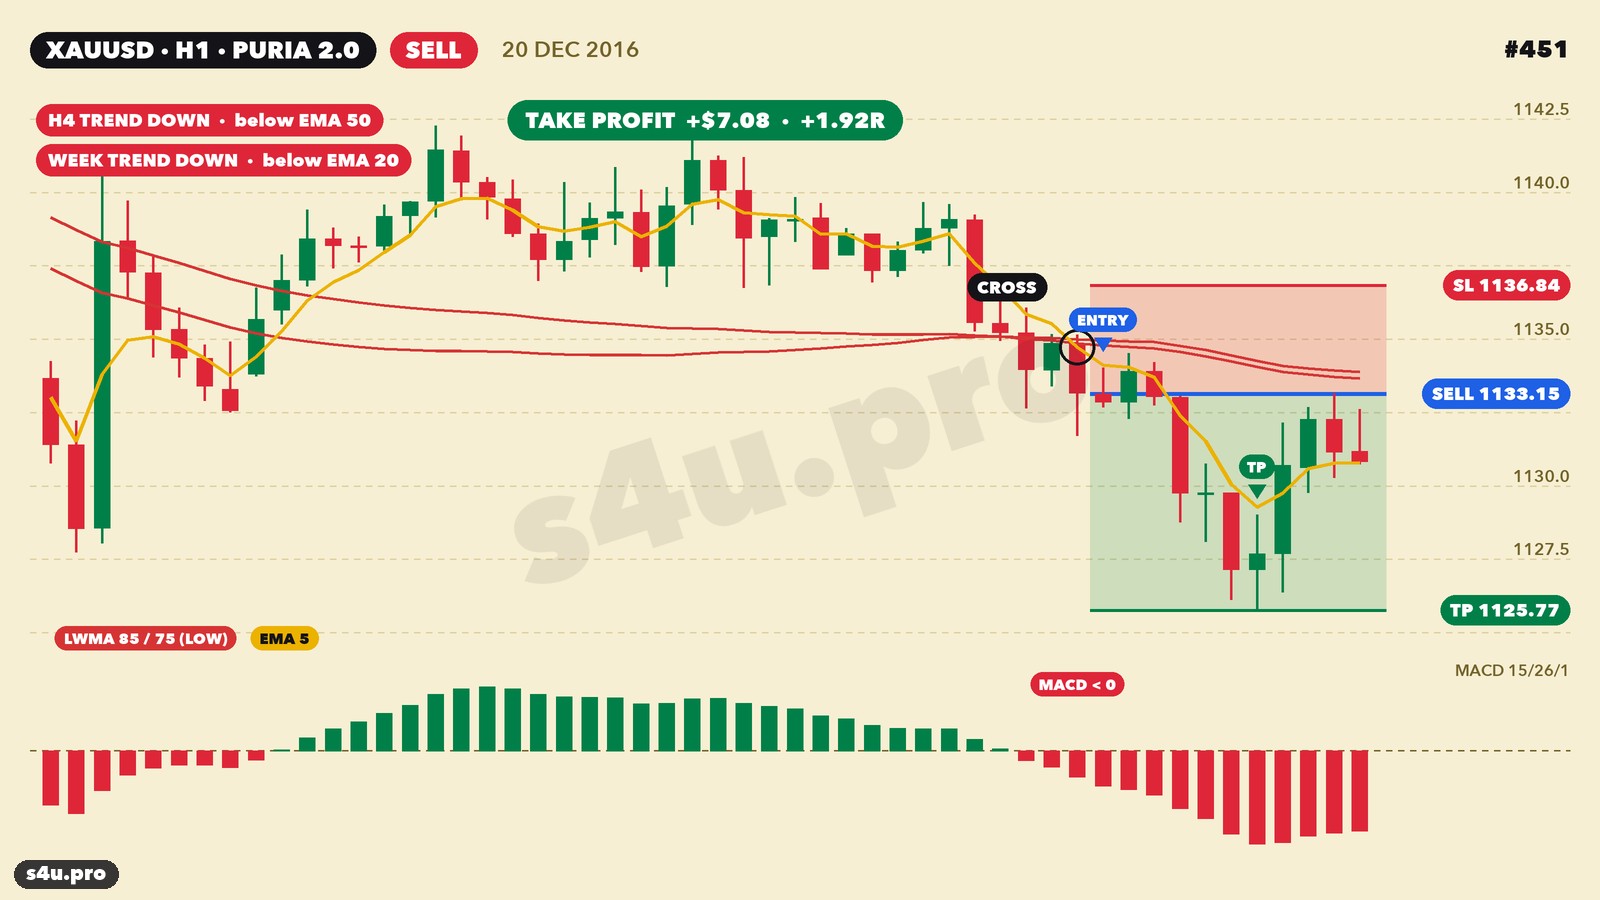
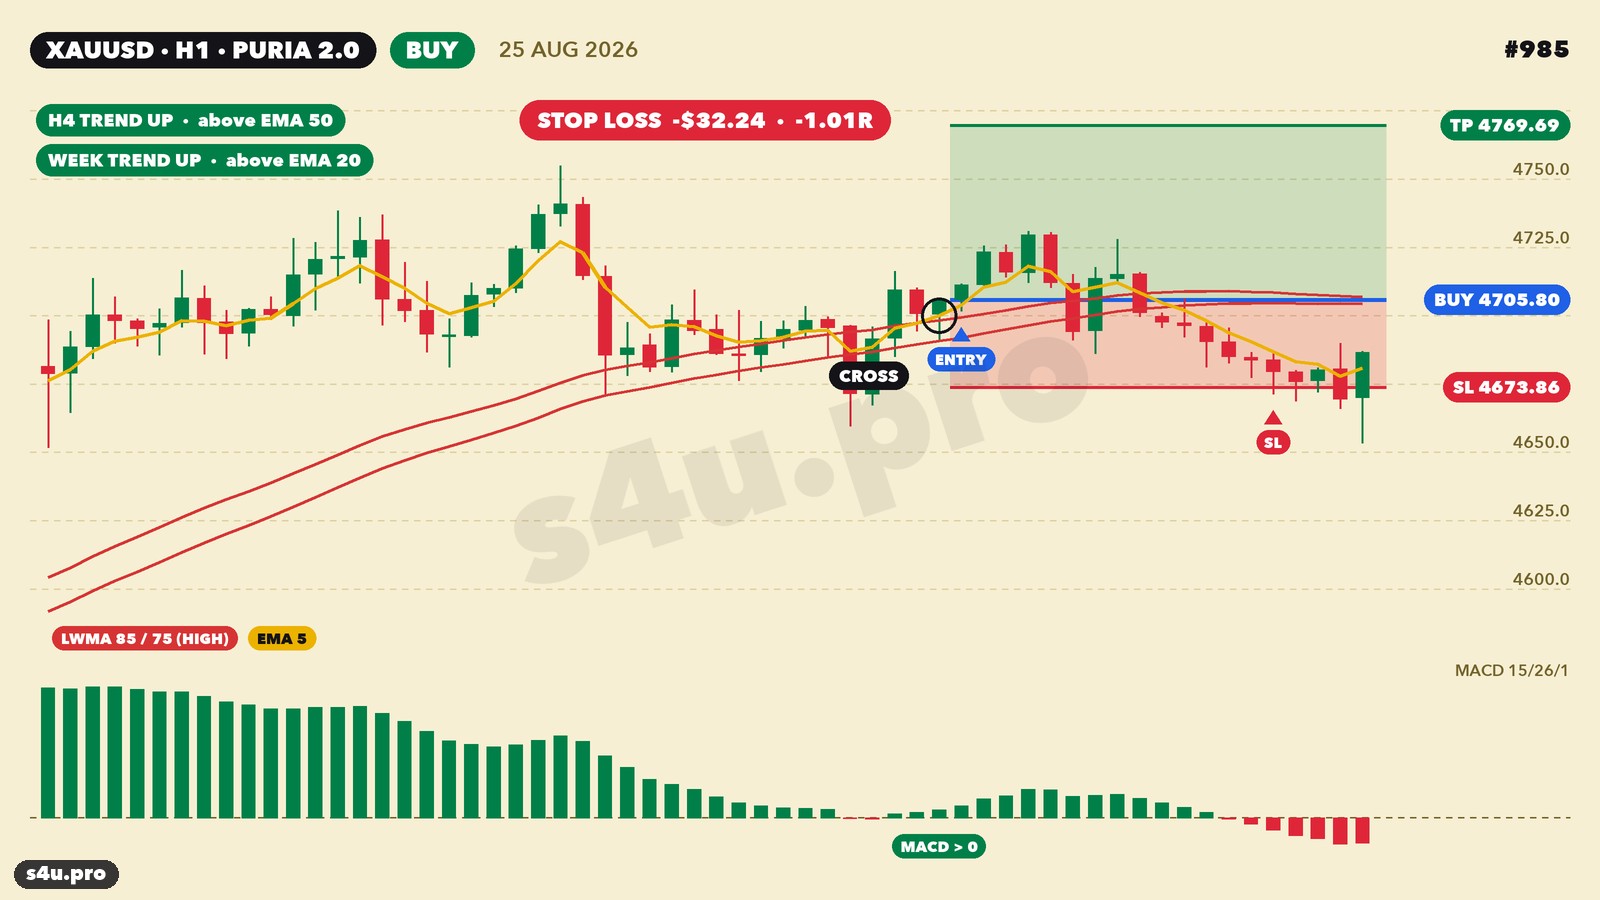
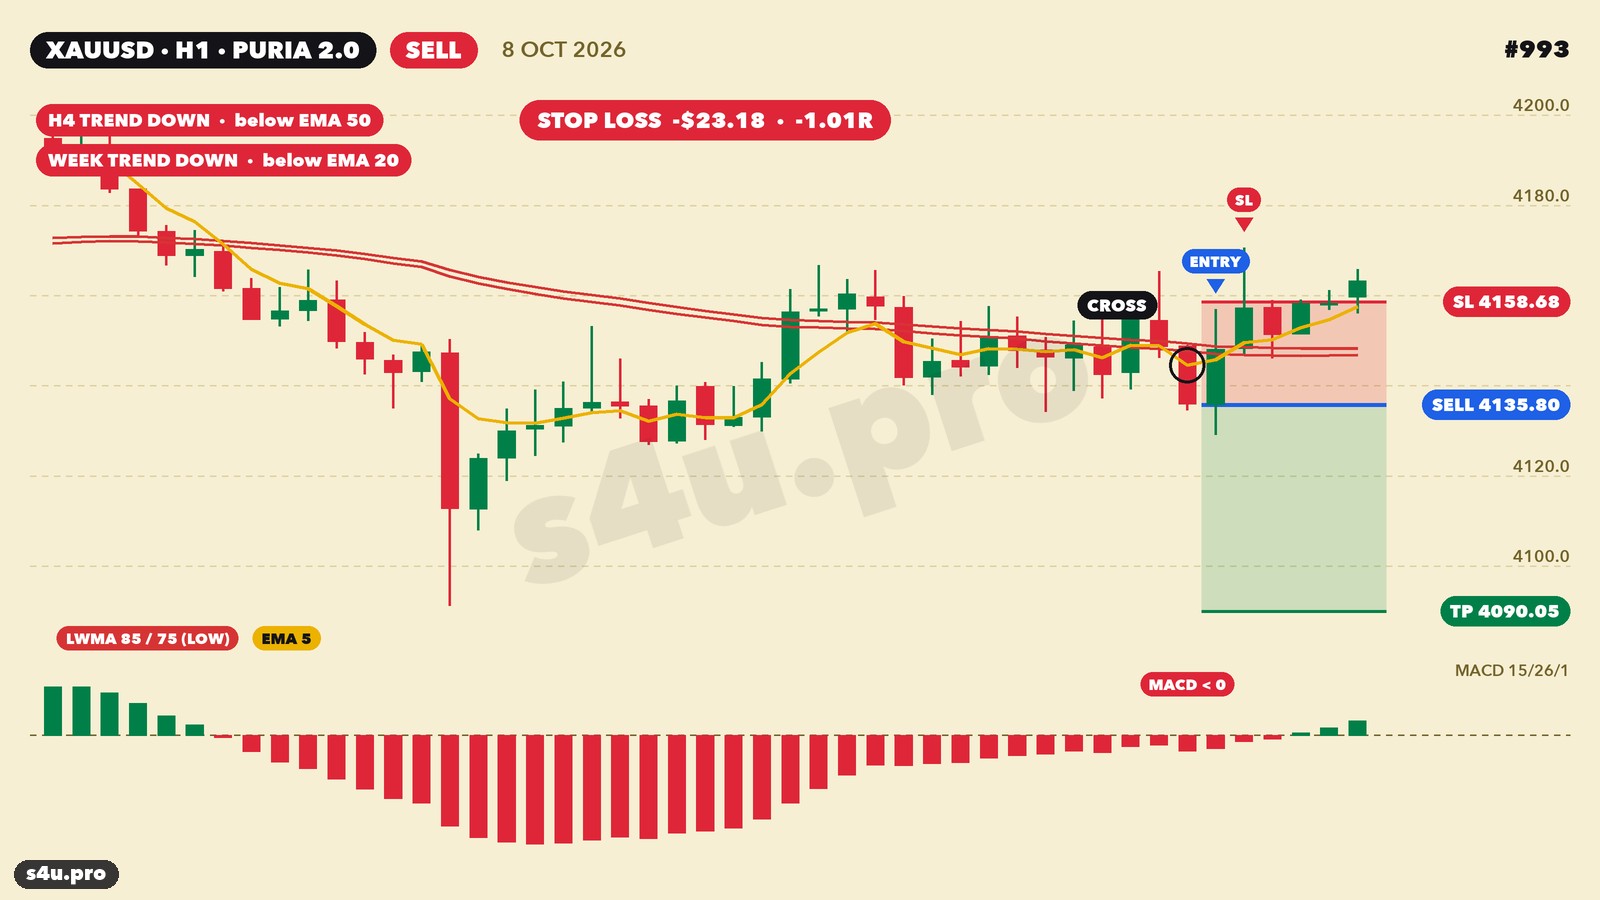
En cada gráfico: las líneas rojas son las LWMA 85 y 75 (sobre High para compras, sobre Low para ventas), la amarilla es la EMA 5, el círculo es el cruce y abajo está el MACD. Arriba a la izquierda, la dirección de la tendencia H4 y semanal. La línea azul es la entrada, la roja el stop y la verde el take profit.
Compra: agosto de 2026 — +$47 por onza
La semana y H4 apuntan arriba. La EMA 5 cruzó ambas LWMA sobre High de abajo hacia arriba, MACD por encima de cero. Stop $24, take profit $47. El precio subió justo después de la entrada y cerró en el take profit.
Venta: octubre de 2026 — +$35
La semana y H4 giraron a la baja. La EMA 5 cruzó las LWMA sobre Low de arriba hacia abajo, MACD por debajo de cero: venta a favor de la tendencia, take profit 2R.
Compra: diciembre de 2025 — +$36
Venta: diciembre de 2016 — +$7
Una operación antigua para comparar: en 2016 el oro costaba unos $1,150 y el stop era de solo $3.7. Las reglas son las mismas; solo cambia el tamaño en dólares.
Y así se ven las pérdidas
Agosto de 2026, compra: hubo cruce, pero la subida no continuó; el precio giró y se llevó el stop.
Octubre de 2026, venta: entrada a favor de la tendencia bajista, pero el precio saltó por encima del stop.
Seis de cada diez operaciones cierran en el stop: es normal en una estrategia con take profit 2R. La ganancia la dan ese 39% en el que el take profit es el doble del stop.
Galería: todas las operaciones en oro 2024–2026
Aquí están las 148 operaciones de Puria 2.0 en oro del periodo de prueba a ciegas, sin selección: ganadoras y perdedoras. 2024–2025 son cotizaciones de Alpari y 2026, del futuro GC. Filtra por resultado, dirección y año, y pulsa una imagen para abrir el gráfico.
Tabla de operaciones 2024–2026
| # | Mercado | Apertura | Tipo | Entrada | Stop | Objetivo | Salida | Resultado | $ por onza | R | Gráfico |
|---|---|---|---|---|---|---|---|---|---|---|---|
| 847 | XAUUSD | 02.01.24 12:00 | BUY | 2077.04 | 2070.81 | 2089.50 | 2070.81 | SL | -6.53 | -1.05R | |
| 848 | XAUUSD | 23.01.24 08:00 | BUY | 2030.62 | 2025.07 | 2041.72 | 2025.07 | SL | -5.85 | -1.05R | |
| 849 | XAUUSD | 24.01.24 01:00 | BUY | 2029.18 | 2023.08 | 2041.39 | 2023.08 | SL | -6.40 | -1.05R | |
| 850 | XAUUSD | 01.02.24 18:00 | BUY | 2051.77 | 2042.63 | 2070.05 | 2042.63 | SL | -9.44 | -1.03R | |
| 851 | XAUUSD | 06.02.24 21:00 | BUY | 2036.37 | 2029.73 | 2049.65 | 2029.73 | SL | -6.94 | -1.04R | |
| 852 | XAUUSD | 22.02.24 05:00 | BUY | 2027.59 | 2023.22 | 2036.33 | 2023.22 | SL | -4.67 | -1.07R | |
| 853 | XAUUSD | 23.02.24 19:00 | BUY | 2038.23 | 2031.90 | 2050.90 | 2031.90 | SL | -6.63 | -1.05R | |
| 854 | XAUUSD | 27.02.24 04:00 | BUY | 2033.51 | 2029.11 | 2042.31 | 2029.11 | SL | -4.70 | -1.07R | |
| 855 | XAUUSD | 29.02.24 01:00 | BUY | 2035.14 | 2030.58 | 2044.26 | 2030.58 | SL | -4.86 | -1.07R | |
| 856 | XAUUSD | 29.02.24 16:00 | BUY | 2047.43 | 2041.70 | 2058.88 | 2041.70 | SL | -6.03 | -1.05R | |
| 857 | XAUUSD | 13.03.24 21:00 | BUY | 2174.75 | 2167.29 | 2189.67 | 2167.29 | SL | -7.76 | -1.04R | |
| 858 | XAUUSD | 15.03.24 12:00 | BUY | 2171.65 | 2165.97 | 2183.01 | 2165.97 | SL | -5.98 | -1.05R | |
| 859 | XAUUSD | 20.03.24 21:00 | BUY | 2181.82 | 2173.45 | 2198.55 | 2198.55 | TP | +16.43 | +1.96R | |
| 860 | XAUUSD | 22.03.24 03:00 | BUY | 2184.91 | 2175.64 | 2203.46 | 2175.64 | SL | -9.57 | -1.03R | |
| 861 | XAUUSD | 26.03.24 12:00 | BUY | 2190.84 | 2183.25 | 2206.02 | 2183.25 | SL | -7.89 | -1.04R | |
| 862 | XAUUSD | 27.03.24 10:00 | BUY | 2180.40 | 2173.50 | 2194.20 | 2194.20 | TP | +13.50 | +1.96R | |
| 863 | XAUUSD | 05.04.24 17:00 | BUY | 2299.70 | 2287.26 | 2324.58 | 2324.58 | TP | +24.58 | +1.98R | |
| 864 | XAUUSD | 11.04.24 21:00 | BUY | 2356.20 | 2343.31 | 2381.98 | 2381.98 | TP | +25.48 | +1.98R | |
| 865 | XAUUSD | 15.04.24 23:00 | BUY | 2386.08 | 2366.60 | 2425.05 | 2366.60 | SL | -19.78 | -1.01R | |
| 866 | XAUUSD | 16.04.24 19:00 | BUY | 2385.85 | 2369.48 | 2418.58 | 2369.48 | SL | -16.67 | -1.02R | |
| 867 | XAUUSD | 18.04.24 20:00 | BUY | 2387.79 | 2375.75 | 2411.87 | 2375.75 | SL | -12.34 | -1.02R | |
| 868 | XAUUSD | 19.04.24 05:00 | BUY | 2409.19 | 2395.56 | 2436.46 | 2395.56 | SL | -13.93 | -1.02R | |
| 869 | XAUUSD | 19.04.24 19:00 | BUY | 2394.75 | 2380.03 | 2424.18 | 2380.03 | SL | -15.02 | -1.02R | |
| 870 | XAUUSD | 29.04.24 20:00 | BUY | 2342.90 | 2332.10 | 2364.49 | 2332.10 | SL | -11.10 | -1.03R | |
| 871 | XAUUSD | 09.05.24 17:00 | BUY | 2324.11 | 2314.85 | 2342.64 | 2342.64 | TP | +18.23 | +1.97R | |
| 872 | XAUUSD | 14.05.24 21:00 | BUY | 2355.68 | 2346.42 | 2374.20 | 2374.20 | TP | +18.22 | +1.97R | |
| 873 | XAUUSD | 17.05.24 10:00 | BUY | 2385.81 | 2378.61 | 2400.21 | 2400.21 | TP | +14.10 | +1.96R | |
| 874 | XAUUSD | 31.05.24 16:00 | BUY | 2354.77 | 2346.49 | 2371.34 | 2346.49 | SL | -8.58 | -1.04R | |
| 875 | XAUUSD | 03.06.24 20:00 | BUY | 2349.09 | 2338.65 | 2369.98 | 2338.65 | SL | -10.74 | -1.03R | |
| 876 | XAUUSD | 02.07.24 11:00 | BUY | 2330.87 | 2324.01 | 2344.59 | 2324.01 | SL | -7.16 | -1.04R | |
| 877 | XAUUSD | 03.07.24 08:00 | BUY | 2334.48 | 2327.97 | 2347.50 | 2347.50 | TP | +12.72 | +1.95R | |
| 878 | XAUUSD | 10.07.24 11:00 | BUY | 2372.65 | 2365.99 | 2385.97 | 2385.97 | TP | +13.02 | +1.96R | |
| 879 | XAUUSD | 16.08.24 13:00 | BUY | 2463.34 | 2455.08 | 2479.85 | 2479.85 | TP | +16.21 | +1.96R | |
| 880 | XAUUSD | 23.08.24 19:00 | BUY | 2510.00 | 2499.98 | 2530.03 | 2499.98 | SL | -10.31 | -1.03R | |
| 881 | XAUUSD | 29.08.24 09:00 | BUY | 2518.77 | 2511.28 | 2533.76 | 2511.28 | SL | -7.79 | -1.04R | |
| 882 | XAUUSD | 30.08.24 12:00 | BUY | 2522.95 | 2514.95 | 2538.94 | 2514.95 | SL | -8.30 | -1.04R | |
| 883 | XAUUSD | 10.09.24 16:00 | BUY | 2514.03 | 2506.94 | 2528.22 | 2506.94 | SL | -7.39 | -1.04R | |
| 884 | XAUUSD | 12.09.24 08:00 | BUY | 2517.18 | 2510.76 | 2530.03 | 2530.03 | TP | +12.55 | +1.95R | |
| 885 | XAUUSD | 19.09.24 12:00 | BUY | 2584.93 | 2573.05 | 2608.68 | 2573.05 | SL | -12.18 | -1.02R | |
| 886 | XAUUSD | 01.10.24 17:00 | BUY | 2667.00 | 2657.23 | 2686.53 | 2657.23 | SL | -10.07 | -1.03R | |
| 887 | XAUUSD | 03.10.24 01:00 | BUY | 2657.97 | 2648.34 | 2677.23 | 2648.34 | SL | -9.93 | -1.03R | |
| 888 | XAUUSD | 04.10.24 05:00 | BUY | 2658.31 | 2650.34 | 2674.24 | 2650.34 | SL | -8.27 | -1.04R | |
| 889 | XAUUSD | 15.10.24 19:00 | BUY | 2664.70 | 2654.58 | 2684.94 | 2684.94 | TP | +19.93 | +1.97R | |
| 890 | XAUUSD | 24.10.24 16:00 | BUY | 2739.09 | 2731.07 | 2755.13 | 2731.07 | SL | -8.32 | -1.04R | |
| 891 | XAUUSD | 25.10.24 20:00 | BUY | 2739.19 | 2729.76 | 2758.05 | 2729.76 | SL | -9.73 | -1.03R | |
| 892 | XAUUSD | 28.10.24 09:00 | BUY | 2740.73 | 2731.36 | 2759.47 | 2731.36 | SL | -9.67 | -1.03R | |
| 893 | XAUUSD | 28.10.24 16:00 | BUY | 2740.85 | 2731.24 | 2760.08 | 2760.08 | TP | +18.93 | +1.97R | |
| 894 | XAUUSD | 27.11.24 16:00 | BUY | 2656.20 | 2645.27 | 2678.06 | 2645.27 | SL | -11.23 | -1.03R | |
| 895 | XAUUSD | 28.11.24 13:00 | BUY | 2647.59 | 2637.92 | 2666.92 | 2637.92 | SL | -9.97 | -1.03R | |
| 896 | XAUUSD | 29.11.24 05:00 | BUY | 2657.43 | 2647.71 | 2676.87 | 2647.71 | SL | -10.02 | -1.03R | |
| 897 | XAUUSD | 04.12.24 08:00 | BUY | 2649.79 | 2641.41 | 2666.56 | 2641.41 | SL | -8.68 | -1.04R | |
| 898 | XAUUSD | 04.12.24 18:00 | BUY | 2655.06 | 2644.79 | 2675.61 | 2644.79 | SL | -10.57 | -1.03R | |
| 899 | XAUUSD | 05.12.24 08:00 | BUY | 2653.05 | 2644.44 | 2670.27 | 2644.44 | SL | -8.91 | -1.03R | |
| 900 | XAUUSD | 07.01.25 15:00 | BUY | 2651.39 | 2643.03 | 2668.10 | 2643.03 | SL | -8.65 | -1.04R | |
| 901 | XAUUSD | 15.01.25 09:00 | BUY | 2681.07 | 2673.75 | 2695.71 | 2695.71 | TP | +14.34 | +1.96R | |
| 902 | XAUUSD | 21.01.25 04:00 | BUY | 2718.09 | 2707.81 | 2738.65 | 2738.65 | TP | +20.25 | +1.97R | |
| 903 | XAUUSD | 23.01.25 20:00 | BUY | 2757.75 | 2747.89 | 2777.47 | 2777.47 | TP | +19.42 | +1.97R | |
| 904 | XAUUSD | 28.01.25 21:00 | BUY | 2762.19 | 2754.44 | 2777.69 | 2754.44 | SL | -8.05 | -1.04R | |
| 905 | XAUUSD | 30.01.25 03:00 | BUY | 2762.06 | 2754.32 | 2777.53 | 2777.53 | TP | +15.17 | +1.96R | |
| 906 | XAUUSD | 07.02.25 05:00 | BUY | 2868.76 | 2858.87 | 2888.54 | 2858.87 | SL | -10.19 | -1.03R | |
| 907 | XAUUSD | 10.02.25 04:00 | BUY | 2871.97 | 2860.16 | 2895.59 | 2895.59 | TP | +23.32 | +1.98R | |
| 908 | XAUUSD | 13.02.25 02:00 | BUY | 2905.80 | 2893.52 | 2930.36 | 2930.36 | TP | +24.27 | +1.98R | |
| 909 | XAUUSD | 18.02.25 11:00 | BUY | 2912.41 | 2903.30 | 2930.63 | 2930.63 | TP | +17.92 | +1.97R | |
| 910 | XAUUSD | 24.02.25 11:00 | BUY | 2946.32 | 2934.27 | 2970.42 | 2934.27 | SL | -12.35 | -1.02R | |
| 911 | XAUUSD | 07.03.25 12:00 | BUY | 2921.55 | 2910.77 | 2943.11 | 2910.77 | SL | -11.08 | -1.03R | |
| 912 | XAUUSD | 07.03.25 17:00 | BUY | 2926.84 | 2913.77 | 2952.97 | 2913.77 | SL | -13.37 | -1.02R | |
| 913 | XAUUSD | 11.03.25 14:00 | BUY | 2913.56 | 2902.83 | 2935.01 | 2935.01 | TP | +21.15 | +1.97R | |
| 914 | XAUUSD | 20.03.25 21:00 | BUY | 3043.30 | 3032.08 | 3065.74 | 3032.08 | SL | -11.52 | -1.03R | |
| 915 | XAUUSD | 26.03.25 10:00 | BUY | 3030.46 | 3021.74 | 3047.90 | 3021.74 | SL | -9.02 | -1.03R | |
| 916 | XAUUSD | 26.03.25 14:00 | BUY | 3027.69 | 3018.29 | 3046.49 | 3018.29 | SL | -9.70 | -1.03R | |
| 917 | XAUUSD | 27.03.25 05:00 | BUY | 3031.61 | 3023.09 | 3048.64 | 3048.64 | TP | +16.73 | +1.97R | |
| 918 | XAUUSD | 02.04.25 05:00 | BUY | 3133.02 | 3118.90 | 3161.25 | 3118.90 | SL | -14.42 | -1.02R | |
| 919 | XAUUSD | 02.04.25 12:00 | BUY | 3131.39 | 3117.13 | 3159.91 | 3117.13 | SL | -14.56 | -1.02R | |
| 920 | XAUUSD | 03.04.25 02:00 | BUY | 3145.83 | 3126.97 | 3183.55 | 3126.97 | SL | -19.16 | -1.02R | |
| 921 | XAUUSD | 15.04.25 06:00 | BUY | 3224.20 | 3206.81 | 3258.97 | 3258.97 | TP | +34.47 | +1.98R | |
| 922 | XAUUSD | 28.04.25 20:00 | BUY | 3336.78 | 3311.36 | 3387.61 | 3311.36 | SL | -25.72 | -1.01R | |
| 923 | XAUUSD | 08.05.25 05:00 | BUY | 3408.69 | 3385.18 | 3455.71 | 3385.18 | SL | -23.81 | -1.01R | |
| 924 | XAUUSD | 23.05.25 09:00 | BUY | 3323.99 | 3304.90 | 3362.18 | 3362.18 | TP | +37.89 | +1.98R | |
| 925 | XAUUSD | 26.05.25 19:00 | BUY | 3337.81 | 3324.10 | 3365.22 | 3324.10 | SL | -14.01 | -1.02R | |
| 926 | XAUUSD | 29.05.25 19:00 | BUY | 3321.48 | 3302.09 | 3360.27 | 3302.09 | SL | -19.69 | -1.01R | |
| 927 | XAUUSD | 02.06.25 04:00 | BUY | 3311.20 | 3293.51 | 3346.58 | 3346.58 | TP | +35.08 | +1.98R | |
| 928 | XAUUSD | 04.06.25 12:00 | BUY | 3363.03 | 3347.75 | 3393.60 | 3347.75 | SL | -15.58 | -1.02R | |
| 929 | XAUUSD | 04.06.25 18:00 | BUY | 3377.50 | 3358.93 | 3414.65 | 3358.93 | SL | -18.87 | -1.02R | |
| 930 | XAUUSD | 10.06.25 17:00 | BUY | 3343.79 | 3329.22 | 3372.94 | 3329.22 | SL | -14.87 | -1.02R | |
| 931 | XAUUSD | 08.07.25 02:00 | BUY | 3339.88 | 3327.68 | 3364.28 | 3327.68 | SL | -12.50 | -1.02R | |
| 932 | XAUUSD | 18.07.25 12:00 | BUY | 3347.63 | 3336.98 | 3368.93 | 3368.93 | TP | +21.00 | +1.97R | |
| 933 | XAUUSD | 01.08.25 16:00 | BUY | 3341.11 | 3325.18 | 3372.96 | 3372.96 | TP | +31.55 | +1.98R | |
| 934 | XAUUSD | 07.08.25 06:00 | BUY | 3379.43 | 3368.56 | 3401.17 | 3401.17 | TP | +21.44 | +1.97R | |
| 935 | XAUUSD | 08.08.25 22:00 | BUY | 3395.62 | 3376.21 | 3434.44 | 3376.21 | SL | -19.71 | -1.01R | |
| 936 | XAUUSD | 14.08.25 04:00 | BUY | 3369.29 | 3358.36 | 3391.14 | 3358.36 | SL | -11.22 | -1.03R | |
| 937 | XAUUSD | 27.08.25 18:00 | BUY | 3386.32 | 3376.39 | 3406.18 | 3406.18 | TP | +19.56 | +1.97R | |
| 938 | XAUUSD | 10.09.25 06:00 | BUY | 3636.04 | 3619.56 | 3669.00 | 3619.56 | SL | -16.78 | -1.02R | |
| 939 | XAUUSD | 12.09.25 07:00 | BUY | 3652.85 | 3640.32 | 3677.92 | 3640.32 | SL | -12.83 | -1.02R | |
| 940 | XAUUSD | 15.09.25 17:00 | BUY | 3657.24 | 3644.80 | 3682.12 | 3682.12 | TP | +24.58 | +1.98R | |
| 941 | XAUUSD | 19.09.25 21:00 | BUY | 3678.80 | 3663.90 | 3708.61 | 3708.61 | TP | +29.51 | +1.98R | |
| 942 | XAUUSD | 26.09.25 18:00 | BUY | 3778.77 | 3761.37 | 3813.57 | 3761.37 | SL | -17.70 | -1.02R | |
| 943 | XAUUSD | 03.10.25 17:00 | BUY | 3883.31 | 3865.80 | 3918.33 | 3918.33 | TP | +34.72 | +1.98R | |
| 944 | XAUUSD | 13.10.25 02:00 | BUY | 4042.09 | 4010.44 | 4105.40 | 4105.40 | TP | +63.01 | +1.99R | |
| 945 | XAUUSD | 20.10.25 17:00 | BUY | 4300.48 | 4259.23 | 4382.98 | 4259.23 | SL | -41.55 | -1.01R | |
| 946 | XAUUSD | 14.11.25 05:00 | BUY | 4206.96 | 4177.19 | 4266.50 | 4177.19 | SL | -30.07 | -1.01R | |
| 947 | XAUUSD | 19.11.25 08:00 | BUY | 4095.39 | 4068.87 | 4148.43 | 4068.87 | SL | -26.82 | -1.01R | |
| 948 | XAUUSD | 21.11.25 21:00 | BUY | 4082.81 | 4050.02 | 4148.39 | 4050.02 | SL | -33.09 | -1.01R | |
| 949 | XAUUSD | 27.11.25 10:00 | BUY | 4160.02 | 4142.84 | 4194.39 | 4194.39 | TP | +34.07 | +1.98R | |
| 950 | XAUUSD | 05.12.25 08:00 | BUY | 4220.71 | 4204.54 | 4253.04 | 4253.04 | TP | +32.03 | +1.98R | |
| 951 | XAUUSD | 09.12.25 22:00 | BUY | 4212.13 | 4194.02 | 4248.36 | 4194.02 | SL | -18.41 | -1.02R | |
| 952 | XAUUSD | 10.12.25 23:00 | BUY | 4229.66 | 4210.08 | 4268.82 | 4210.08 | SL | -19.88 | -1.01R | |
| 953 | XAUUSD | 17.12.25 04:00 | BUY | 4326.52 | 4305.57 | 4368.42 | 4368.42 | TP | +41.60 | +1.99R | |
| 954 | XAUUSD | 19.12.25 18:00 | BUY | 4347.97 | 4329.82 | 4384.27 | 4384.27 | TP | +36.01 | +1.98R | |
| 955 | XAUUSD | 08.01.26 23:00 | BUY | 4489.30 | 4465.23 | 4537.45 | 4465.23 | SL | -24.37 | -1.01R | |
| 956 | XAUUSD | 20.01.26 06:00 | BUY | 4720.70 | 4682.37 | 4797.35 | 4797.35 | TP | +76.35 | +1.99R | |
| 957 | XAUUSD | 29.01.26 23:00 | BUY | 5410.00 | 5290.67 | 5648.66 | 5290.67 | SL | -119.63 | -1.00R | |
| 958 | XAUUSD | 06.02.26 16:00 | BUY | 4967.80 | 4888.65 | 5126.09 | 5126.09 | TP | +157.99 | +2.00R | |
| 959 | XAUUSD | 18.02.26 16:00 | BUY | 5018.90 | 4982.33 | 5092.04 | 4982.33 | SL | -36.87 | -1.01R | |
| 960 | XAUUSD | 25.02.26 04:00 | BUY | 5200.10 | 5160.52 | 5279.26 | 5160.52 | SL | -39.88 | -1.01R | |
| 961 | XAUUSD | 27.02.26 14:00 | BUY | 5240.80 | 5210.59 | 5301.22 | 5301.22 | TP | +60.12 | +1.99R | |
| 962 | XAUUSD | 24.03.26 13:00 | SELL | 4379.00 | 4468.94 | 4199.12 | 4468.94 | SL | -90.24 | -1.00R | |
| 963 | XAUUSD | 26.03.26 09:00 | SELL | 4425.40 | 4482.01 | 4312.17 | 4482.01 | SL | -56.91 | -1.00R | |
| 964 | XAUUSD | 07.04.26 22:00 | BUY | 4747.20 | 4700.66 | 4840.28 | 4840.28 | TP | +92.78 | +1.99R | |
| 965 | XAUUSD | 09.04.26 14:00 | BUY | 4790.00 | 4752.02 | 4865.95 | 4752.02 | SL | -38.28 | -1.01R | |
| 966 | XAUUSD | 14.04.26 01:00 | BUY | 4792.70 | 4761.50 | 4855.09 | 4855.09 | TP | +62.09 | +1.99R | |
| 967 | XAUUSD | 16.04.26 00:00 | BUY | 4845.40 | 4818.59 | 4899.02 | 4818.59 | SL | -27.11 | -1.01R | |
| 968 | XAUUSD | 17.04.26 14:00 | BUY | 4903.30 | 4870.86 | 4968.18 | 4870.86 | SL | -32.74 | -1.01R | |
| 969 | XAUUSD | 04.05.26 09:00 | SELL | 4587.90 | 4615.70 | 4532.30 | 4532.30 | TP | +55.30 | +1.99R | |
| 970 | XAUUSD | 11.05.26 16:00 | BUY | 4742.00 | 4708.03 | 4809.93 | 4708.03 | SL | -34.27 | -1.01R | |
| 971 | XAUUSD | 19.05.26 03:00 | SELL | 4549.90 | 4581.76 | 4486.17 | 4486.17 | TP | +63.43 | +1.99R | |
| 972 | XAUUSD | 26.05.26 17:00 | SELL | 4504.90 | 4531.91 | 4450.88 | 4450.88 | TP | +53.72 | +1.99R | |
| 973 | XAUUSD | 01.06.26 14:00 | SELL | 4479.10 | 4509.37 | 4418.56 | 4509.37 | SL | -30.57 | -1.01R | |
| 974 | XAUUSD | 02.06.26 18:00 | SELL | 4514.30 | 4538.09 | 4466.71 | 4466.71 | TP | +47.29 | +1.99R | |
| 975 | XAUUSD | 05.06.26 02:00 | SELL | 4473.40 | 4499.05 | 4422.11 | 4499.05 | SL | -25.95 | -1.01R | |
| 976 | XAUUSD | 05.06.26 13:00 | SELL | 4432.00 | 4460.88 | 4374.24 | 4374.24 | TP | +57.46 | +1.99R | |
| 977 | XAUUSD | 17.06.26 20:00 | SELL | 4254.20 | 4294.72 | 4173.16 | 4294.72 | SL | -40.82 | -1.01R | |
| 978 | XAUUSD | 26.06.26 03:00 | SELL | 4005.90 | 4039.67 | 3938.37 | 4039.67 | SL | -34.07 | -1.01R | |
| 979 | XAUUSD | 29.06.26 18:00 | SELL | 4035.70 | 4063.79 | 3979.52 | 3979.52 | TP | +55.88 | +1.99R | |
| 980 | XAUUSD | 30.06.26 23:00 | SELL | 4026.50 | 4053.33 | 3972.85 | 4053.33 | SL | -27.13 | -1.01R | |
| 981 | XAUUSD | 12.07.26 23:00 | SELL | 4084.00 | 4108.10 | 4035.81 | 4035.81 | TP | +47.89 | +1.99R | |
| 982 | XAUUSD | 16.07.26 06:00 | SELL | 4032.40 | 4055.87 | 3985.46 | 3985.46 | TP | +46.64 | +1.99R | |
| 983 | XAUUSD | 12.08.26 01:00 | BUY | 4440.30 | 4416.67 | 4487.56 | 4487.56 | TP | +46.96 | +1.99R | |
| 984 | XAUUSD | 17.08.26 01:00 | BUY | 4457.10 | 4432.85 | 4505.59 | 4432.85 | SL | -24.55 | -1.01R | |
| 985 | XAUUSD | 25.08.26 18:00 | BUY | 4705.80 | 4673.86 | 4769.69 | 4673.86 | SL | -32.24 | -1.01R | |
| 986 | XAUUSD | 16.09.26 22:00 | SELL | 4301.40 | 4340.43 | 4223.33 | 4340.43 | SL | -39.33 | -1.01R | |
| 987 | XAUUSD | 28.09.26 00:00 | SELL | 4294.20 | 4319.01 | 4244.58 | 4244.58 | TP | +49.32 | +1.99R | |
| 988 | XAUUSD | 30.09.26 19:00 | SELL | 4182.80 | 4206.47 | 4135.46 | 4206.47 | SL | -23.97 | -1.01R | |
| 989 | XAUUSD | 02.10.26 16:00 | SELL | 4156.20 | 4190.94 | 4086.71 | 4190.94 | SL | -35.04 | -1.01R | |
| 990 | XAUUSD | 05.10.26 14:00 | SELL | 4163.00 | 4188.59 | 4111.82 | 4188.59 | SL | -25.89 | -1.01R | |
| 991 | XAUUSD | 07.10.26 06:00 | SELL | 4154.80 | 4173.34 | 4117.71 | 4117.71 | TP | +36.79 | +1.98R | |
| 992 | XAUUSD | 08.10.26 06:00 | SELL | 4141.90 | 4163.60 | 4098.49 | 4163.60 | SL | -22.00 | -1.01R | |
| 993 | XAUUSD | 08.10.26 16:00 | SELL | 4135.80 | 4158.68 | 4090.05 | 4158.68 | SL | -23.18 | -1.01R | |
| 994 | XAUUSD | 13.10.26 16:00 | SELL | 4182.20 | 4199.94 | 4146.71 | 4146.71 | TP | +35.19 | +1.98R | |
| Total: 148 | +148.06 | +10.5R | |||||||||
- Pulsa «Descargar el diario en Excel con el bot» y en Telegram toca “Start”.
- ¿Ya usaste el bot y no aparece el botón “Start”? Envía al bot el mensaje /start.
- Si aún no sigues @strategy4you, el bot te pedirá suscribirte: suscríbete y toca “✅ I’ve subscribed”. Si ya estás suscrito, el bot pasa directamente al siguiente paso.
- El bot envía el botón “Get the EA for free”: tócalo para abrir la página de bonos.
- En la página busca el bloque “📊 Strategy trade journals” y pulsa “Download Excel”.
Cómo calcular el lote en oro
El stop en Puria 2.0 es distinto cada vez, así que el lote hay que recalcularlo en cada operación. En XAUUSD 1 lote = 100 onzas: un movimiento de $1 da $100 con 1 lote o $1 con 0.01 lote. Fórmula: lote = (cuenta × riesgo %) / (stop en dólares × 100).
Ejemplo: cuenta de $5,000, riesgo del 1% = $50, stop de $35. Lote = 50 / (35 × 100) ≈ 0.014 → 0.01. Con un stop de $35 y un lote mínimo de 0.01, un riesgo del 1% solo es posible desde una cuenta de $3,500. Con una cuenta menor el riesgo por operación será superior al 1%; tenlo en cuenta.
Resultados en USDJPY: por qué el yen está al final del artículo
La primera versión mejorada la encontramos precisamente en el yen, y hasta 2025 parecía mejor que cualquier otro par. No eliminamos estos resultados: muestran con honestidad cómo una estrategia puede dejar de funcionar. Pero los pusimos al final porque 2026 resultó negativo en el yen, y la razón principal son las intervenciones y los movimientos bruscos del yen.
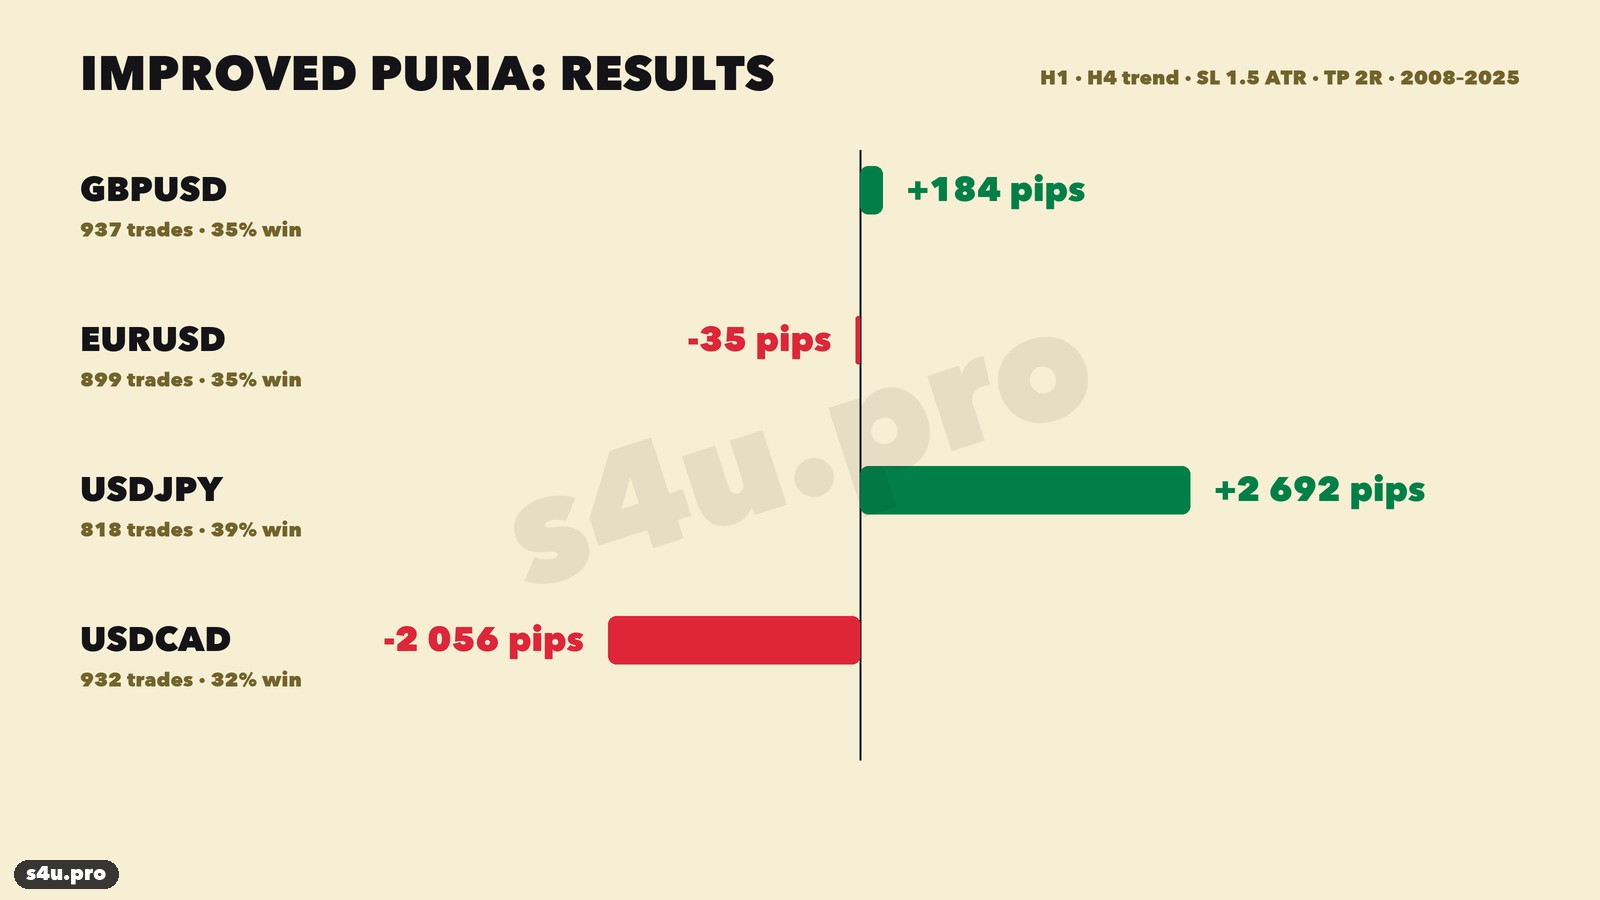
Primera versión mejorada (H1 + tendencia H4 + stop 1.5 ATR + take profit 2R)
Es Puria 2.0 sin los dos últimos pasos: LWMA sobre Low para ambos lados, sin filtro semanal. Prueba en 2008–2025, con el spread descontado.
| Par | Clásico, pips | Mejorada: operaciones | Ganadoras | Mejorada, pips |
|---|---|---|---|---|
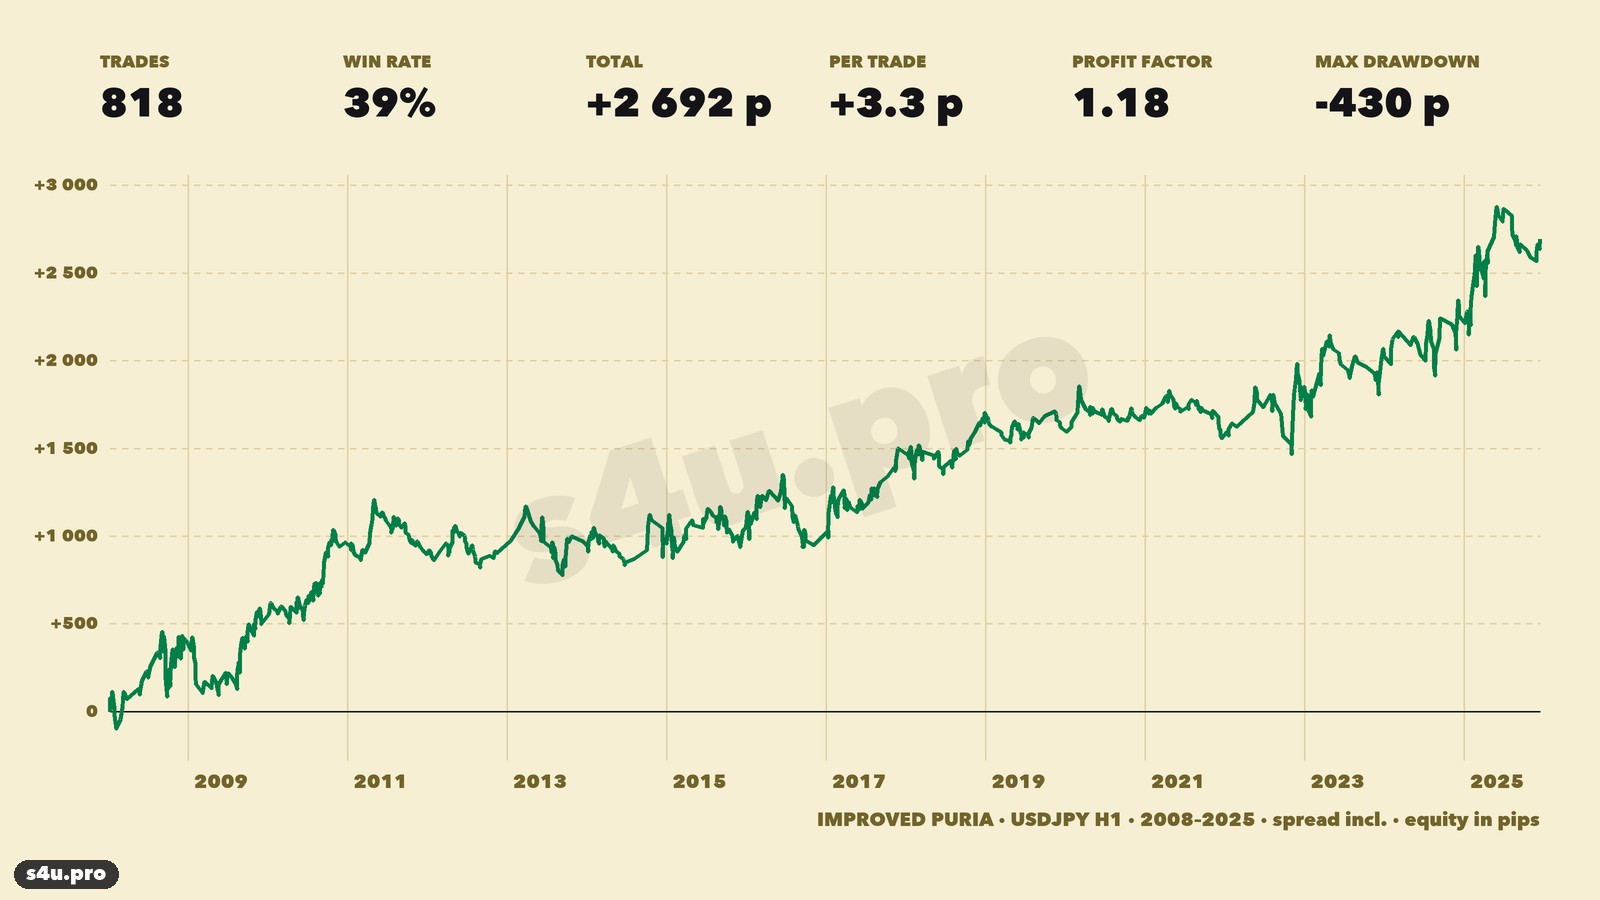
| USDJPY | −5,817 | 818 | 39% | +2,692 |
| GBPUSD | −4,688 | 937 | 35% | +184 |
| EURUSD | −3,856 | 899 | 35% | −35 |
| USDCAD | −4,914 | 932 | 32% | −2,056 |
En USDJPY: +2,692 pips en 818 operaciones en 2008–2025, profit factor 1.18, drawdown −430 pips, 14 años positivos de 18. Las reglas se eligieron con 2008–2017, y 2018–2025 también fue positivo (+1,207 pips). Casi toda la ganancia vino de las ventas (+2,860); las compras dieron −168: con LWMA sobre Low solo hubo 55 compras frente a 763 ventas.
2026: −341 pips
Con cotizaciones nuevas de USDJPY H1 de enero–octubre de 2026, las mismas reglas dieron 17 operaciones, 3 take profits y −341 pips. 16 de las 17 operaciones fueron ventas, en total −303 pips.
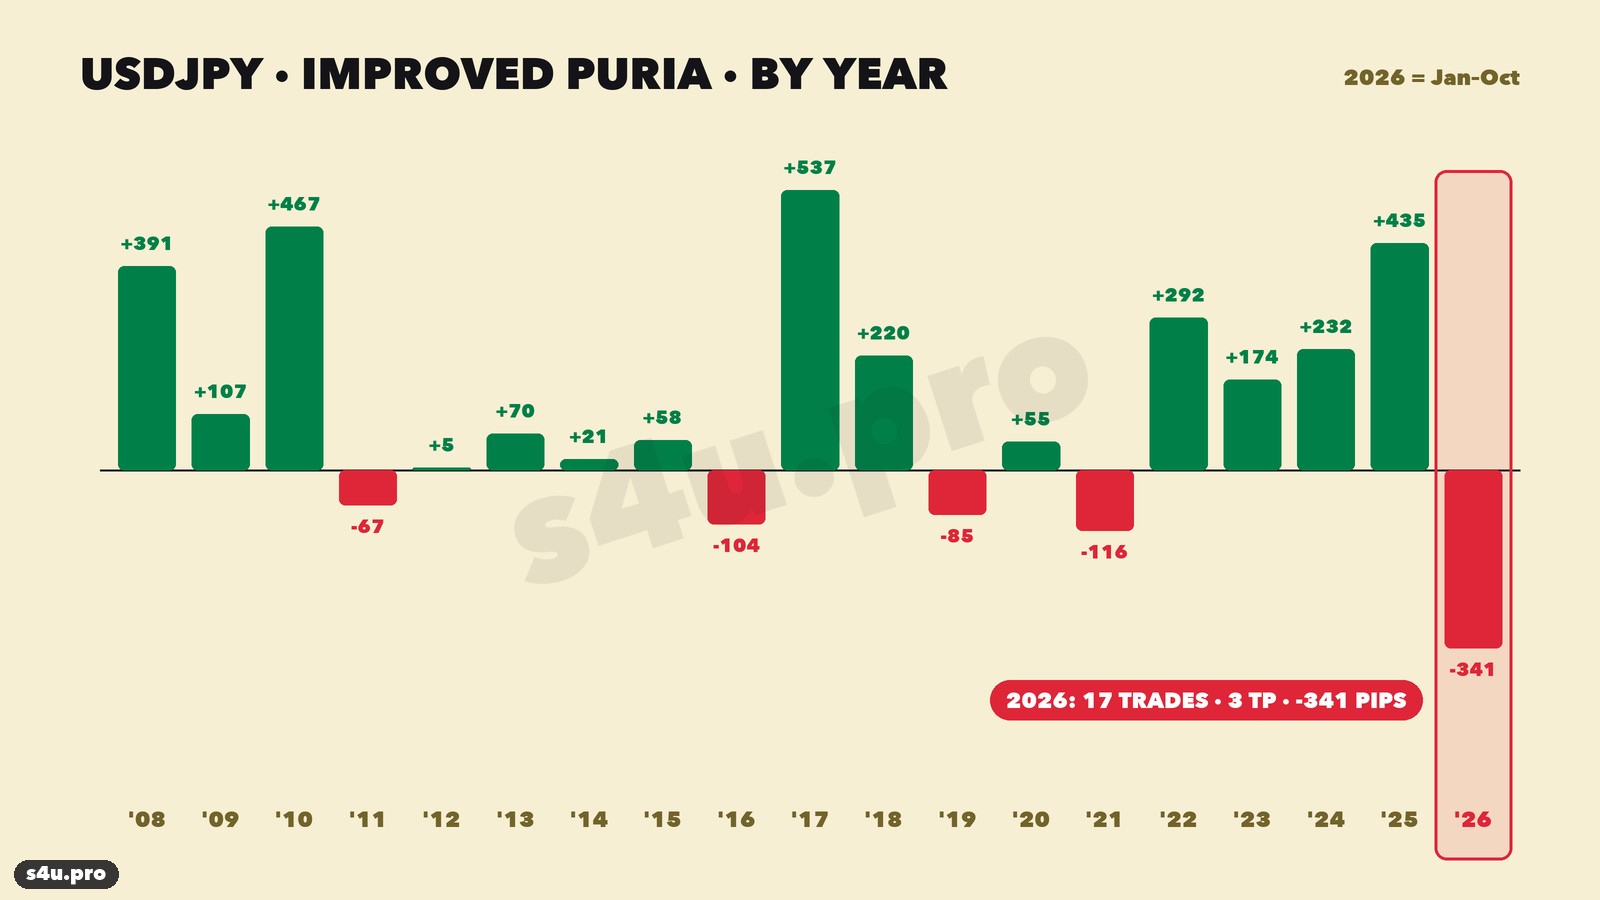
Qué pasó: en 2026 el yen siguió debilitándose, USDJPY se mantuvo en 155–162, y las caídas bruscas del tipo de cambio — también en torno a las intervenciones cambiarias — giraban la tendencia H4 a la baja. El filtro veía una «tendencia bajista», la estrategia vendía y el mercado pronto volvía a subir y tocaba el stop. Conclusión: ahora no se pueden operar ventas de USDJPY con esta señal.
Puria 2.0 en USDJPY: las compras funcionan
Con las reglas de Puria 2.0 (LWMA espejo + tendencia semanal) el yen también es positivo en el historial largo: +79.9R en 1,030 operaciones en 2008–2026, 11 años positivos de 19. En 2008–2025 las compras dieron +43.8R y las ventas +41.7R. En la prueba a ciegas de 2024–2025: +18R.
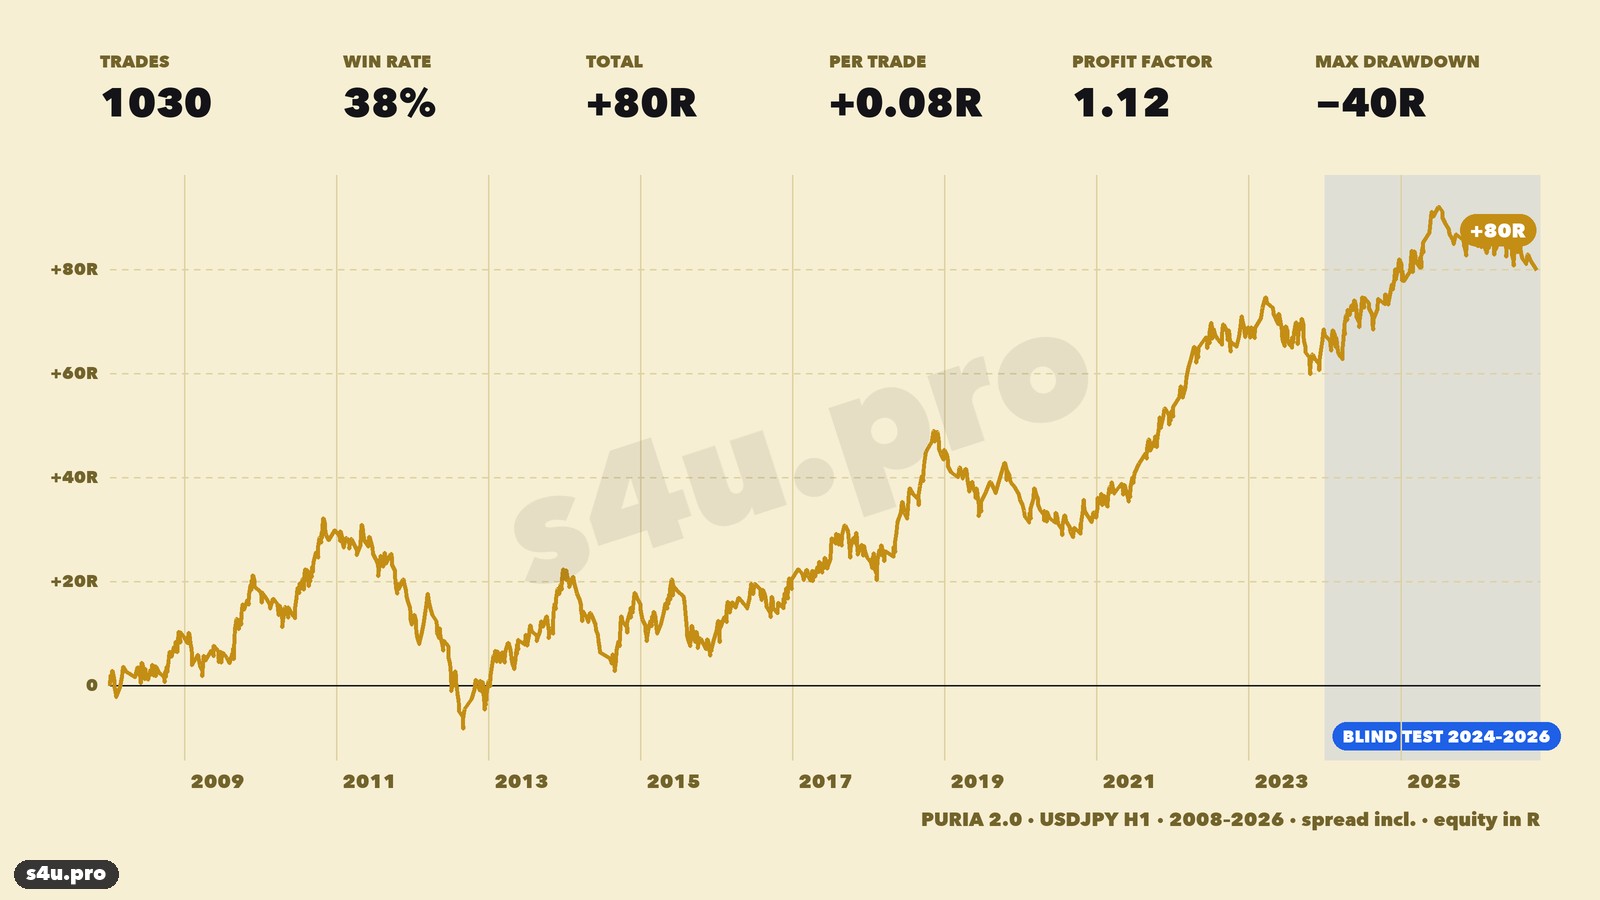
Pero 2026 también es negativo aquí: −5.6R en 51 operaciones. Separado por dirección, el panorama es muy claro:
| USDJPY, 2026 | Operaciones | Take profits | Resultado |
|---|---|---|---|
| Primera versión mejorada | 17 (16 ventas) | 3 | −341 pips |
| Puria 2.0 — compras | 43 | 16 | +50 pips (+2.7R) |
| Puria 2.0 — ventas | 8 | 0 | −325 pips (−8.3R) |
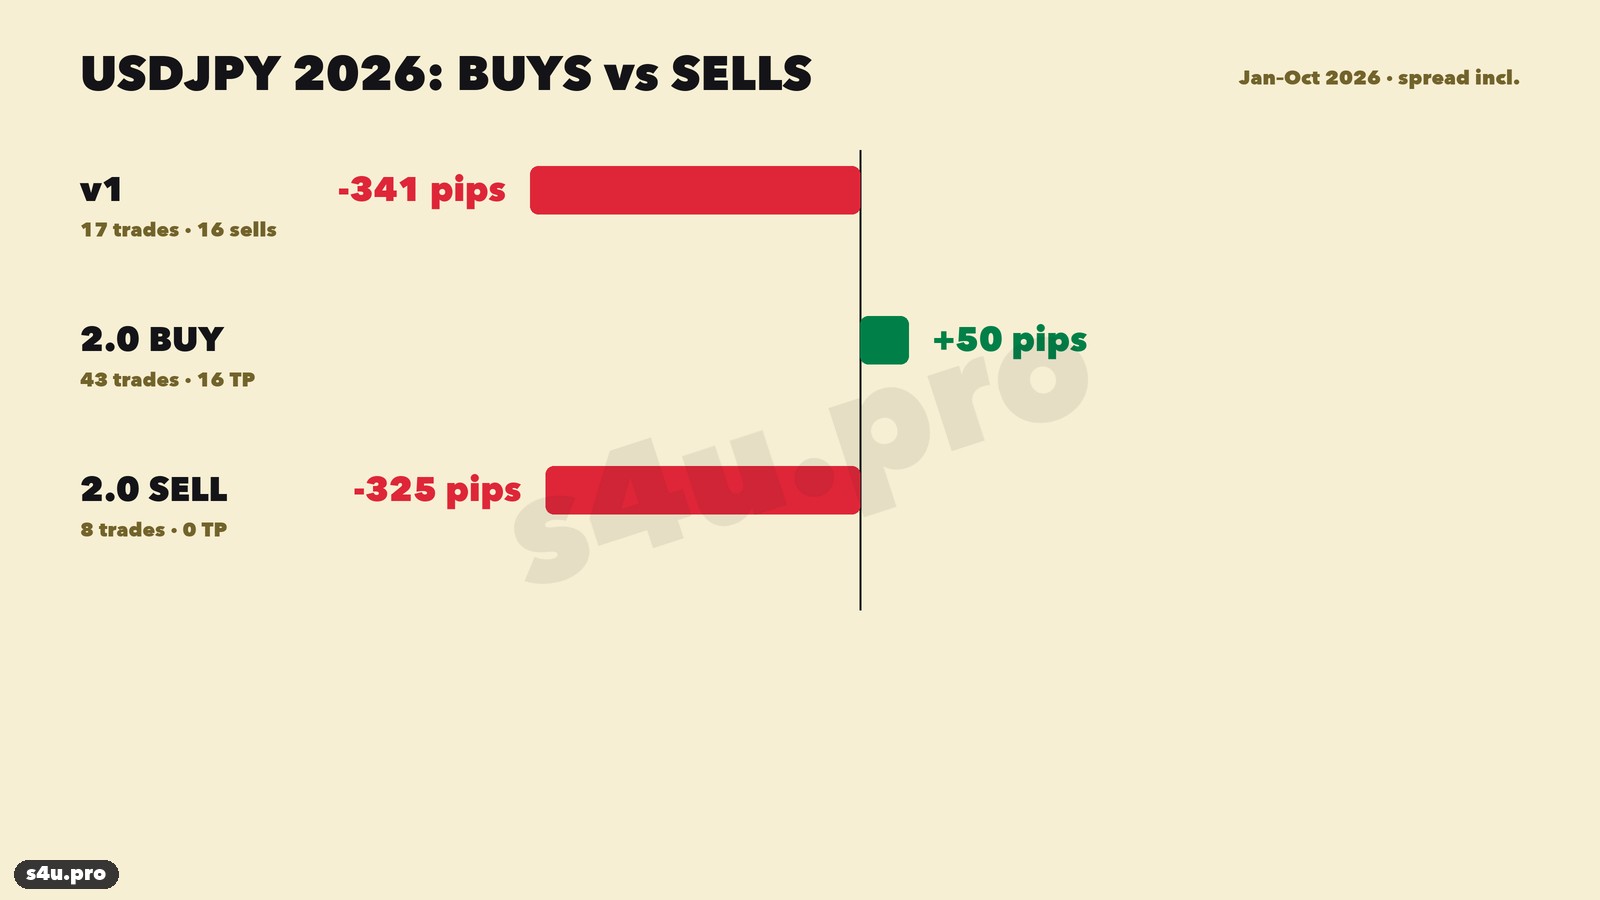
Toda la pérdida de 2026 en el yen son ventas contra un yen que se debilita. Las 8 ventas cerraron en el stop. Las compras a favor de la tendencia siguieron en positivo, aunque por poco.
¿Conviene operar USDJPY con el Método Puria?
- Ventas — no. Mientras sean posibles intervenciones y giros bruscos del yen, las ventas con esta señal saltan una y otra vez.
- Compras de Puria 2.0 — se pueden considerar como complemento del oro, pero con menos riesgo y primero en demo: su ganancia de 2026 es pequeña.
- La primera versión mejorada en el yen (LWMA sobre Low, casi solo ventas) — no operarla.
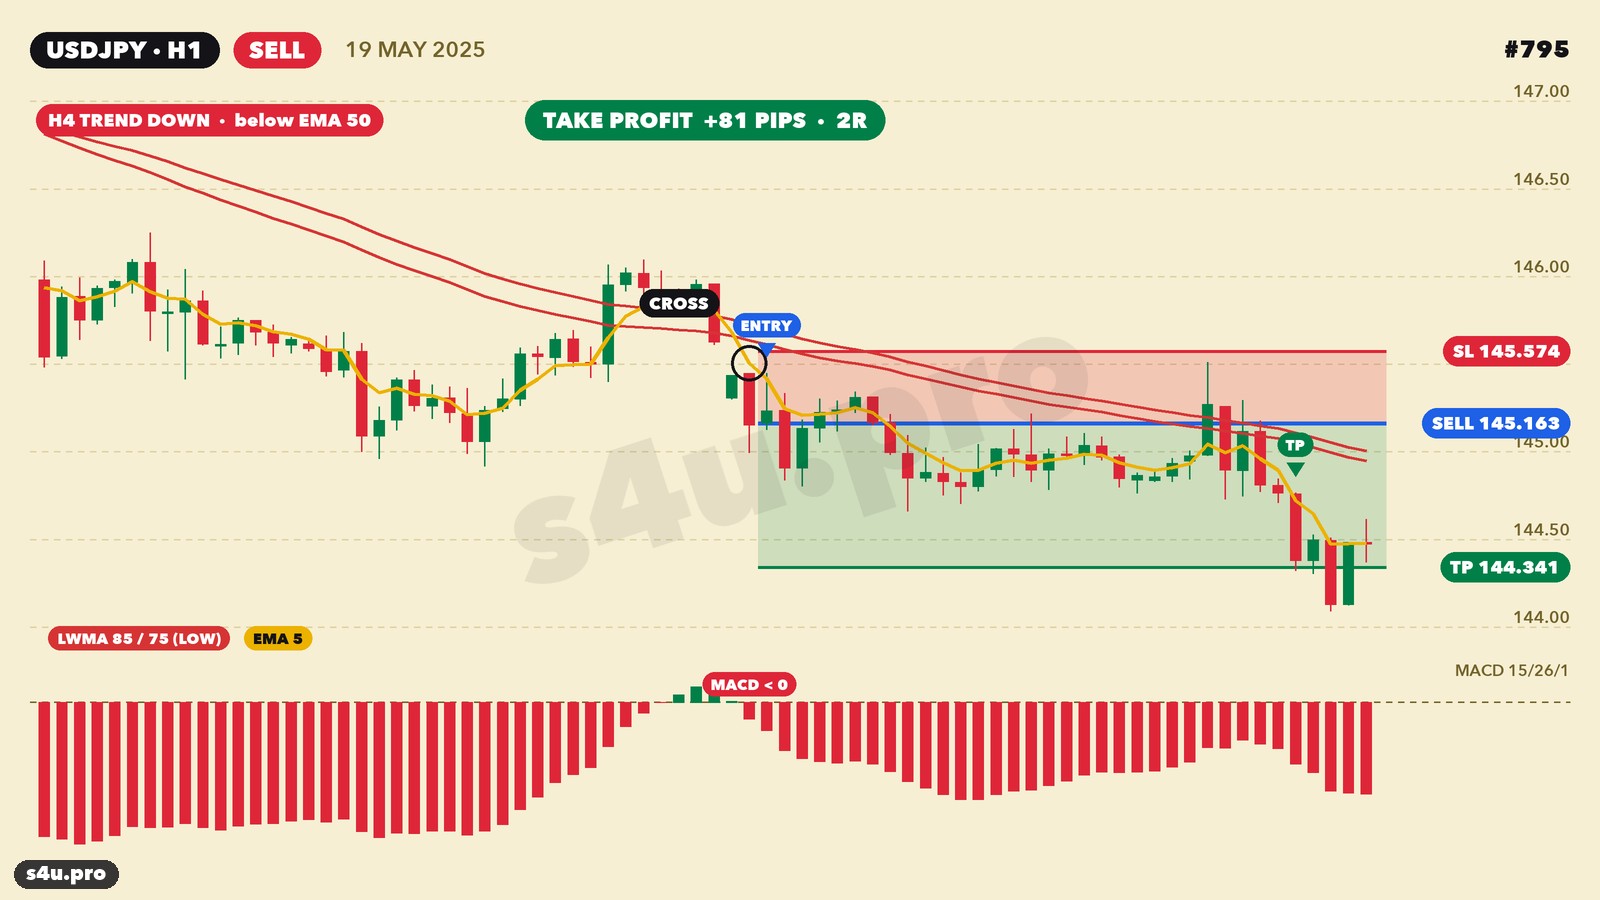
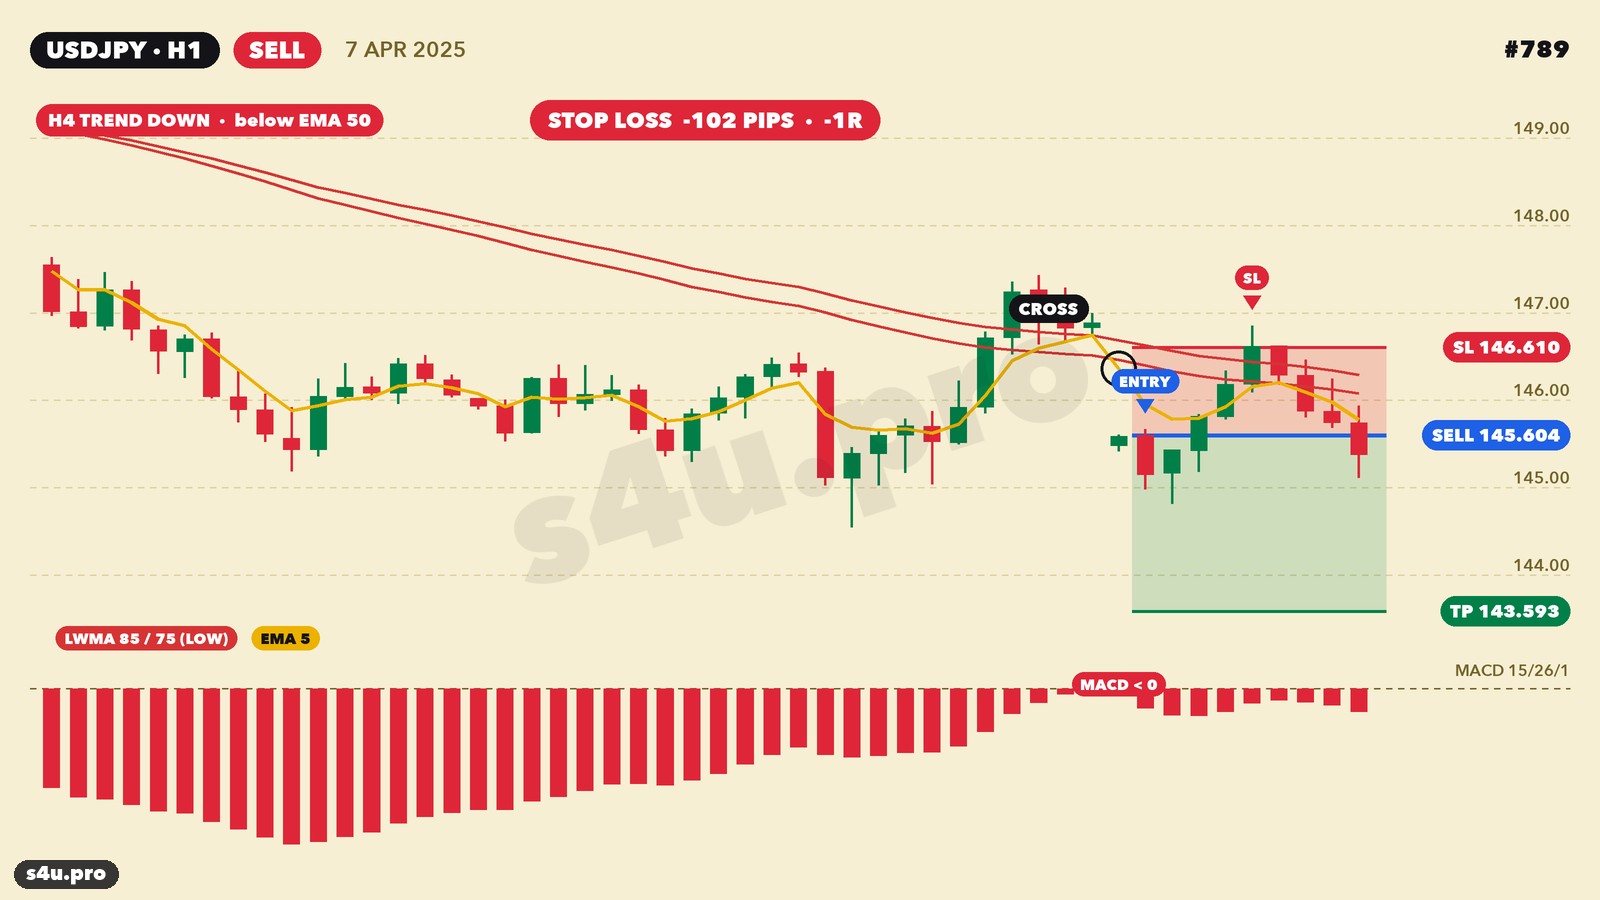
Un ejemplo de venta ganadora con la primera versión — mayo de 2025, +81 pips — y una perdedora — abril de 2025, stop de 101 pips en pleno pánico del mercado:
Galería: todas las operaciones USDJPY 2018–2025 (primera versión mejorada)
Aquí están las 336 operaciones de la primera versión mejorada en el yen en 2018–2025, el periodo de prueba «a ciegas» de esa versión, sin selección. Filtra por resultado, dirección y año, y pulsa una imagen para abrir el gráfico. Las 17 operaciones de 2026 se calcularon con otras cotizaciones (Yahoo) y no están en la galería; su resultado está en la tabla de arriba.
Tabla de operaciones USDJPY 2018–2025
| # | Mercado | Apertura | Tipo | Entrada | Stop | Objetivo | Salida | Resultado | Pips | R | Gráfico |
|---|---|---|---|---|---|---|---|---|---|---|---|
| 483 | USDJPY | 09.01.18 04:00 | SELL | 112.655 | 112.841 | 112.283 | 112.841 | SL | -20 | -1.06R | 📈 |
| 484 | USDJPY | 16.01.18 11:00 | SELL | 110.646 | 110.873 | 110.193 | 110.873 | SL | -24 | -1.05R | 📈 |
| 485 | USDJPY | 16.01.18 18:00 | SELL | 110.674 | 110.901 | 110.220 | 110.220 | TP | +44 | +1.95R | 📈 |
| 486 | USDJPY | 19.01.18 09:00 | SELL | 110.779 | 111.028 | 110.280 | 111.028 | SL | -26 | -1.05R | 📈 |
| 487 | USDJPY | 23.01.18 13:00 | SELL | 110.638 | 110.905 | 110.103 | 110.103 | TP | +52 | +1.96R | 📈 |
| 488 | USDJPY | 26.01.18 11:00 | SELL | 108.932 | 109.276 | 108.243 | 109.276 | SL | -36 | -1.03R | 📈 |
| 489 | USDJPY | 26.01.18 17:00 | SELL | 108.699 | 109.126 | 107.845 | 109.126 | SL | -44 | -1.03R | 📈 |
| 490 | USDJPY | 30.01.18 08:00 | SELL | 108.680 | 108.969 | 108.102 | 108.969 | SL | -30 | -1.04R | 📈 |
| 491 | USDJPY | 07.02.18 08:00 | SELL | 109.160 | 109.502 | 108.476 | 109.502 | SL | -35 | -1.03R | 📈 |
| 492 | USDJPY | 08.02.18 20:00 | SELL | 108.670 | 109.042 | 107.925 | 109.042 | SL | -38 | -1.03R | 📈 |
| 493 | USDJPY | 09.02.18 14:00 | SELL | 109.043 | 109.383 | 108.363 | 108.363 | TP | +67 | +1.97R | 📈 |
| 494 | USDJPY | 13.02.18 06:00 | SELL | 108.575 | 108.794 | 108.137 | 108.137 | TP | +43 | +1.95R | 📈 |
| 495 | USDJPY | 22.02.18 15:00 | SELL | 107.036 | 107.321 | 106.467 | 106.467 | TP | +56 | +1.96R | 📈 |
| 496 | USDJPY | 28.02.18 18:00 | SELL | 106.711 | 106.983 | 106.167 | 106.983 | SL | -28 | -1.04R | 📈 |
| 497 | USDJPY | 01.03.18 21:00 | SELL | 106.487 | 106.757 | 105.948 | 105.948 | TP | +53 | +1.96R | 📈 |
| 498 | USDJPY | 07.03.18 02:00 | SELL | 105.575 | 105.883 | 104.960 | 105.883 | SL | -32 | -1.04R | 📈 |
| 499 | USDJPY | 14.03.18 00:00 | SELL | 106.454 | 106.718 | 105.926 | 106.718 | SL | -28 | -1.04R | 📈 |
| 500 | USDJPY | 16.03.18 04:00 | SELL | 105.992 | 106.245 | 105.485 | 106.245 | SL | -27 | -1.05R | 📈 |
| 501 | USDJPY | 21.03.18 22:00 | SELL | 105.907 | 106.164 | 105.394 | 105.394 | TP | +50 | +1.95R | 📈 |
| 502 | USDJPY | 07.05.18 12:00 | BUY | 109.290 | 109.095 | 109.681 | 109.095 | SL | -21 | -1.06R | 📈 |
| 503 | USDJPY | 07.05.18 23:00 | SELL | 109.039 | 109.223 | 108.670 | 109.223 | SL | -20 | -1.06R | 📈 |
| 504 | USDJPY | 28.05.18 15:00 | SELL | 109.343 | 109.557 | 108.914 | 108.914 | TP | +42 | +1.94R | 📈 |
| 505 | USDJPY | 31.05.18 05:00 | SELL | 108.571 | 108.817 | 108.078 | 108.817 | SL | -26 | -1.05R | 📈 |
| 506 | USDJPY | 31.05.18 10:00 | SELL | 108.619 | 108.865 | 108.128 | 108.865 | SL | -26 | -1.05R | 📈 |
| 507 | USDJPY | 31.05.18 18:00 | SELL | 108.623 | 108.908 | 108.053 | 108.908 | SL | -30 | -1.04R | 📈 |
| 508 | USDJPY | 20.06.18 09:00 | BUY | 110.210 | 110.006 | 110.617 | 110.006 | SL | -22 | -1.06R | 📈 |
| 509 | USDJPY | 21.06.18 20:00 | SELL | 109.950 | 110.191 | 109.469 | 110.191 | SL | -25 | -1.05R | 📈 |
| 510 | USDJPY | 22.06.18 18:00 | SELL | 109.892 | 110.100 | 109.476 | 109.476 | TP | +40 | +1.94R | 📈 |
| 511 | USDJPY | 25.07.18 14:00 | SELL | 111.097 | 111.278 | 110.735 | 110.735 | TP | +35 | +1.93R | 📈 |
| 512 | USDJPY | 27.07.18 20:00 | SELL | 110.839 | 111.025 | 110.467 | 111.025 | SL | -20 | -1.06R | 📈 |
| 513 | USDJPY | 31.07.18 07:00 | SELL | 110.873 | 111.054 | 110.511 | 111.054 | SL | -19 | -1.07R | 📈 |
| 514 | USDJPY | 03.08.18 16:00 | SELL | 111.449 | 111.620 | 111.106 | 111.106 | TP | +33 | +1.93R | 📈 |
| 515 | USDJPY | 07.08.18 03:00 | SELL | 111.328 | 111.445 | 111.094 | 111.094 | TP | +22 | +1.90R | 📈 |
| 516 | USDJPY | 08.08.18 10:00 | SELL | 111.102 | 111.230 | 110.846 | 110.846 | TP | +24 | +1.91R | 📈 |
| 517 | USDJPY | 09.08.18 17:00 | SELL | 110.964 | 111.120 | 110.653 | 111.120 | SL | -17 | -1.08R | 📈 |
| 518 | USDJPY | 10.08.18 05:00 | SELL | 110.935 | 111.102 | 110.600 | 111.102 | SL | -18 | -1.07R | 📈 |
| 519 | USDJPY | 10.08.18 17:00 | SELL | 110.768 | 111.034 | 110.236 | 110.236 | TP | +52 | +1.96R | 📈 |
| 520 | USDJPY | 15.08.18 18:00 | SELL | 110.435 | 110.666 | 109.972 | 110.666 | SL | -24 | -1.05R | 📈 |
| 521 | USDJPY | 16.08.18 16:00 | SELL | 110.642 | 110.859 | 110.209 | 110.859 | SL | -23 | -1.05R | 📈 |
| 522 | USDJPY | 17.08.18 11:00 | SELL | 110.702 | 110.865 | 110.377 | 110.377 | TP | +31 | +1.93R | 📈 |
| 523 | USDJPY | 20.08.18 16:00 | SELL | 110.431 | 110.587 | 110.118 | 110.118 | TP | +30 | +1.92R | 📈 |
| 524 | USDJPY | 22.08.18 02:00 | SELL | 110.074 | 110.278 | 109.665 | 110.278 | SL | -22 | -1.06R | 📈 |
| 525 | USDJPY | 03.09.18 04:00 | SELL | 110.988 | 111.176 | 110.613 | 111.176 | SL | -20 | -1.06R | 📈 |
| 526 | USDJPY | 10.10.18 17:00 | SELL | 112.911 | 113.103 | 112.527 | 112.527 | TP | +37 | +1.94R | 📈 |
| 527 | USDJPY | 12.10.18 12:00 | SELL | 112.253 | 112.496 | 111.767 | 111.767 | TP | +47 | +1.95R | 📈 |
| 528 | USDJPY | 18.10.18 21:00 | SELL | 112.043 | 112.257 | 111.615 | 112.257 | SL | -23 | -1.06R | 📈 |
| 529 | USDJPY | 26.10.18 08:00 | SELL | 112.213 | 112.427 | 111.785 | 111.785 | TP | +42 | +1.94R | 📈 |
| 530 | USDJPY | 16.11.18 04:00 | SELL | 113.447 | 113.656 | 113.030 | 113.030 | TP | +41 | +1.94R | 📈 |
| 531 | USDJPY | 23.11.18 11:00 | SELL | 112.858 | 112.954 | 112.665 | 112.665 | TP | +18 | +1.88R | 📈 |
| 532 | USDJPY | 04.12.18 05:00 | SELL | 113.312 | 113.469 | 112.999 | 112.999 | TP | +30 | +1.92R | 📈 |
| 533 | USDJPY | 07.12.18 19:00 | SELL | 112.593 | 112.794 | 112.191 | 112.794 | SL | -21 | -1.06R | 📈 |
| 534 | USDJPY | 20.12.18 07:00 | SELL | 112.245 | 112.479 | 111.776 | 111.776 | TP | +46 | +1.95R | 📈 |
| 535 | USDJPY | 27.12.18 17:00 | SELL | 110.666 | 110.931 | 110.137 | 110.931 | SL | -28 | -1.04R | 📈 |
| 536 | USDJPY | 28.12.18 06:00 | SELL | 110.550 | 110.844 | 109.961 | 109.961 | TP | +58 | +1.96R | 📈 |
| 537 | USDJPY | 09.01.19 18:00 | SELL | 108.182 | 108.436 | 107.674 | 108.436 | SL | -27 | -1.05R | 📈 |
| 538 | USDJPY | 14.01.19 07:00 | SELL | 108.110 | 108.300 | 107.730 | 108.300 | SL | -20 | -1.06R | 📈 |
| 539 | USDJPY | 15.01.19 01:00 | SELL | 108.151 | 108.314 | 107.824 | 108.314 | SL | -18 | -1.07R | 📈 |
| 540 | USDJPY | 30.01.19 05:00 | SELL | 109.270 | 109.428 | 108.953 | 109.428 | SL | -17 | -1.08R | 📈 |
| 541 | USDJPY | 18.02.19 11:00 | BUY | 110.575 | 110.455 | 110.816 | 110.455 | SL | -13 | -1.10R | 📈 |
| 542 | USDJPY | 13.03.19 21:00 | SELL | 111.026 | 111.175 | 110.729 | 111.175 | SL | -16 | -1.08R | 📈 |
| 543 | USDJPY | 14.03.19 02:00 | SELL | 111.205 | 111.363 | 110.890 | 111.363 | SL | -17 | -1.08R | 📈 |
| 544 | USDJPY | 28.03.19 05:00 | SELL | 110.167 | 110.387 | 109.726 | 110.387 | SL | -23 | -1.05R | 📈 |
| 545 | USDJPY | 23.04.19 04:00 | SELL | 111.695 | 111.773 | 111.538 | 111.773 | SL | -9 | -1.15R | 📈 |
| 546 | USDJPY | 23.04.19 20:00 | SELL | 111.786 | 111.893 | 111.572 | 111.893 | SL | -12 | -1.11R | 📈 |
| 547 | USDJPY | 25.04.19 16:00 | SELL | 111.809 | 111.956 | 111.515 | 111.515 | TP | +28 | +1.92R | 📈 |
| 548 | USDJPY | 30.04.19 05:00 | SELL | 111.570 | 111.670 | 111.370 | 111.370 | TP | +19 | +1.88R | 📈 |
| 549 | USDJPY | 01.05.19 12:00 | SELL | 111.413 | 111.516 | 111.206 | 111.206 | TP | +19 | +1.88R | 📈 |
| 550 | USDJPY | 03.05.19 18:00 | SELL | 111.223 | 111.346 | 110.978 | 110.978 | TP | +23 | +1.90R | 📈 |
| 551 | USDJPY | 13.05.19 11:00 | SELL | 109.638 | 109.813 | 109.288 | 109.288 | TP | +34 | +1.93R | 📈 |
| 552 | USDJPY | 15.05.19 13:00 | SELL | 109.337 | 109.499 | 109.012 | 109.499 | SL | -17 | -1.07R | 📈 |
| 553 | USDJPY | 28.05.19 12:00 | SELL | 109.223 | 109.361 | 108.947 | 109.361 | SL | -15 | -1.09R | 📈 |
| 554 | USDJPY | 29.05.19 00:00 | SELL | 109.365 | 109.521 | 109.052 | 109.521 | SL | -17 | -1.08R | 📈 |
| 555 | USDJPY | 31.05.19 04:00 | SELL | 109.264 | 109.444 | 108.904 | 108.904 | TP | +35 | +1.93R | 📈 |
| 556 | USDJPY | 04.06.19 22:00 | SELL | 108.053 | 108.285 | 107.589 | 108.285 | SL | -24 | -1.05R | 📈 |
| 557 | USDJPY | 07.06.19 18:00 | SELL | 108.012 | 108.236 | 107.564 | 108.236 | SL | -24 | -1.05R | 📈 |
| 558 | USDJPY | 12.06.19 09:00 | SELL | 108.396 | 108.518 | 108.152 | 108.518 | SL | -13 | -1.10R | 📈 |
| 559 | USDJPY | 13.06.19 05:00 | SELL | 108.292 | 108.435 | 108.007 | 108.435 | SL | -15 | -1.08R | 📈 |
| 560 | USDJPY | 13.06.19 22:00 | SELL | 108.315 | 108.462 | 108.021 | 108.462 | SL | -16 | -1.08R | 📈 |
| 561 | USDJPY | 19.06.19 09:00 | SELL | 108.342 | 108.494 | 108.038 | 108.038 | TP | +29 | +1.92R | 📈 |
| 562 | USDJPY | 24.06.19 12:00 | SELL | 107.364 | 107.522 | 107.048 | 107.522 | SL | -17 | -1.08R | 📈 |
| 563 | USDJPY | 24.06.19 21:00 | SELL | 107.323 | 107.484 | 107.002 | 107.002 | TP | +31 | +1.93R | 📈 |
| 564 | USDJPY | 12.07.19 01:00 | BUY | 108.476 | 108.325 | 108.778 | 108.325 | SL | -16 | -1.08R | 📈 |
| 565 | USDJPY | 16.07.19 16:00 | BUY | 108.190 | 108.037 | 108.495 | 108.037 | SL | -16 | -1.08R | 📈 |
| 566 | USDJPY | 18.07.19 00:00 | SELL | 107.935 | 108.070 | 107.664 | 107.664 | TP | +26 | +1.91R | 📈 |
| 567 | USDJPY | 31.07.19 22:00 | BUY | 108.772 | 108.610 | 109.095 | 109.095 | TP | +31 | +1.93R | 📈 |
| 568 | USDJPY | 07.08.19 07:00 | SELL | 106.058 | 106.356 | 105.463 | 105.463 | TP | +58 | +1.96R | 📈 |
| 569 | USDJPY | 20.08.19 16:00 | SELL | 106.268 | 106.411 | 105.982 | 106.411 | SL | -15 | -1.08R | 📈 |
| 570 | USDJPY | 02.09.19 21:00 | SELL | 106.146 | 106.301 | 105.837 | 106.301 | SL | -17 | -1.08R | 📈 |
| 571 | USDJPY | 01.10.19 20:00 | SELL | 107.687 | 107.910 | 107.242 | 107.242 | TP | +43 | +1.95R | 📈 |
| 572 | USDJPY | 13.11.19 12:00 | SELL | 108.891 | 109.027 | 108.619 | 108.619 | TP | +26 | +1.91R | 📈 |
| 573 | USDJPY | 18.11.19 20:00 | SELL | 108.581 | 108.729 | 108.286 | 108.729 | SL | -16 | -1.08R | 📈 |
| 574 | USDJPY | 19.11.19 18:00 | SELL | 108.488 | 108.637 | 108.189 | 108.637 | SL | -16 | -1.08R | 📈 |
| 575 | USDJPY | 21.11.19 02:00 | SELL | 108.468 | 108.651 | 108.102 | 108.651 | SL | -19 | -1.07R | 📈 |
| 576 | USDJPY | 06.12.19 05:00 | SELL | 108.672 | 108.795 | 108.426 | 108.795 | SL | -13 | -1.10R | 📈 |
| 577 | USDJPY | 06.12.19 19:00 | SELL | 108.657 | 108.808 | 108.355 | 108.808 | SL | -16 | -1.08R | 📈 |
| 578 | USDJPY | 11.12.19 23:00 | SELL | 108.539 | 108.655 | 108.306 | 108.655 | SL | -13 | -1.10R | 📈 |
| 579 | USDJPY | 08.01.20 03:00 | SELL | 107.860 | 108.099 | 107.381 | 108.099 | SL | -25 | -1.05R | 📈 |
| 580 | USDJPY | 30.01.20 03:00 | SELL | 108.962 | 109.112 | 108.663 | 108.663 | TP | +29 | +1.92R | 📈 |
| 581 | USDJPY | 31.01.20 17:00 | SELL | 108.751 | 108.906 | 108.441 | 108.441 | TP | +30 | +1.92R | 📈 |
| 582 | USDJPY | 26.02.20 19:00 | SELL | 110.362 | 110.637 | 109.812 | 109.812 | TP | +54 | +1.96R | 📈 |
| 583 | USDJPY | 03.03.20 05:00 | SELL | 107.950 | 108.418 | 107.015 | 107.015 | TP | +92 | +1.97R | 📈 |
| 584 | USDJPY | 05.03.20 06:00 | SELL | 107.313 | 107.595 | 106.749 | 106.749 | TP | +55 | +1.96R | 📈 |
| 585 | USDJPY | 12.03.20 05:00 | SELL | 103.378 | 104.112 | 101.910 | 104.112 | SL | -75 | -1.02R | 📈 |
| 586 | USDJPY | 31.03.20 20:00 | SELL | 107.769 | 108.272 | 106.762 | 108.272 | SL | -52 | -1.02R | 📈 |
| 587 | USDJPY | 21.04.20 07:00 | SELL | 107.544 | 107.751 | 107.130 | 107.751 | SL | -22 | -1.06R | 📈 |
| 588 | USDJPY | 23.04.20 14:00 | SELL | 107.547 | 107.699 | 107.243 | 107.699 | SL | -16 | -1.08R | 📈 |
| 589 | USDJPY | 23.04.20 20:00 | SELL | 107.513 | 107.763 | 107.012 | 107.012 | TP | +49 | +1.95R | 📈 |
| 590 | USDJPY | 04.05.20 06:00 | SELL | 106.695 | 106.902 | 106.282 | 106.902 | SL | -22 | -1.06R | 📈 |
| 591 | USDJPY | 04.05.20 23:00 | SELL | 106.687 | 106.859 | 106.343 | 106.859 | SL | -18 | -1.07R | 📈 |
| 592 | USDJPY | 05.05.20 17:00 | SELL | 106.580 | 106.753 | 106.233 | 106.233 | TP | +33 | +1.93R | 📈 |
| 593 | USDJPY | 15.05.20 16:00 | SELL | 106.911 | 107.085 | 106.564 | 107.085 | SL | -19 | -1.07R | 📈 |
| 594 | USDJPY | 17.06.20 09:00 | SELL | 107.236 | 107.419 | 106.869 | 107.419 | SL | -20 | -1.06R | 📈 |
| 595 | USDJPY | 17.06.20 21:00 | SELL | 107.183 | 107.341 | 106.867 | 106.867 | TP | +30 | +1.92R | 📈 |
| 596 | USDJPY | 23.06.20 17:00 | SELL | 106.256 | 106.470 | 105.827 | 106.470 | SL | -23 | -1.06R | 📈 |
| 597 | USDJPY | 26.06.20 14:00 | SELL | 106.873 | 107.020 | 106.578 | 107.020 | SL | -16 | -1.08R | 📈 |
| 598 | USDJPY | 15.07.20 12:00 | SELL | 106.895 | 107.029 | 106.626 | 107.029 | SL | -15 | -1.09R | 📈 |
| 599 | USDJPY | 17.07.20 21:00 | SELL | 107.000 | 107.120 | 106.759 | 107.120 | SL | -13 | -1.10R | 📈 |
| 600 | USDJPY | 21.07.20 17:00 | SELL | 106.995 | 107.146 | 106.692 | 106.692 | TP | +29 | +1.92R | 📈 |
| 601 | USDJPY | 30.07.20 21:00 | SELL | 104.887 | 105.103 | 104.455 | 104.455 | TP | +42 | +1.94R | 📈 |
| 602 | USDJPY | 05.08.20 03:00 | SELL | 105.622 | 105.827 | 105.212 | 105.827 | SL | -22 | -1.06R | 📈 |
| 603 | USDJPY | 21.08.20 07:00 | SELL | 105.667 | 105.822 | 105.357 | 105.822 | SL | -17 | -1.08R | 📈 |
| 604 | USDJPY | 26.08.20 21:00 | SELL | 105.995 | 106.182 | 105.621 | 106.182 | SL | -20 | -1.06R | 📈 |
| 605 | USDJPY | 08.09.20 16:00 | SELL | 105.983 | 106.119 | 105.712 | 106.119 | SL | -15 | -1.09R | 📈 |
| 606 | USDJPY | 14.09.20 08:00 | SELL | 106.046 | 106.141 | 105.855 | 105.855 | TP | +18 | +1.87R | 📈 |
| 607 | USDJPY | 14.10.20 05:00 | SELL | 105.325 | 105.432 | 105.111 | 105.432 | SL | -12 | -1.11R | 📈 |
| 608 | USDJPY | 14.10.20 12:00 | SELL | 105.359 | 105.466 | 105.144 | 105.144 | TP | +20 | +1.89R | 📈 |
| 609 | USDJPY | 16.10.20 09:00 | SELL | 105.242 | 105.357 | 105.012 | 105.357 | SL | -13 | -1.10R | 📈 |
| 610 | USDJPY | 21.10.20 06:00 | SELL | 105.370 | 105.481 | 105.147 | 105.147 | TP | +21 | +1.89R | 📈 |
| 611 | USDJPY | 27.10.20 08:00 | SELL | 104.734 | 104.839 | 104.524 | 104.524 | TP | +20 | +1.89R | 📈 |
| 612 | USDJPY | 29.10.20 09:00 | SELL | 104.339 | 104.467 | 104.082 | 104.082 | TP | +24 | +1.91R | 📈 |
| 613 | USDJPY | 30.10.20 09:00 | SELL | 104.303 | 104.465 | 103.979 | 104.465 | SL | -17 | -1.07R | 📈 |
| 614 | USDJPY | 03.11.20 19:00 | SELL | 104.497 | 104.658 | 104.174 | 104.658 | SL | -17 | -1.07R | 📈 |
| 615 | USDJPY | 19.11.20 19:00 | SELL | 103.847 | 104.026 | 103.489 | 104.026 | SL | -19 | -1.07R | 📈 |
| 616 | USDJPY | 07.12.20 22:00 | SELL | 103.968 | 104.129 | 103.646 | 104.129 | SL | -17 | -1.07R | 📈 |
| 617 | USDJPY | 15.12.20 16:00 | SELL | 103.761 | 103.902 | 103.480 | 103.480 | TP | +27 | +1.92R | 📈 |
| 618 | USDJPY | 28.12.20 09:00 | SELL | 103.442 | 103.562 | 103.202 | 103.562 | SL | -13 | -1.10R | 📈 |
| 619 | USDJPY | 04.01.21 03:00 | SELL | 103.052 | 103.218 | 102.721 | 102.721 | TP | +32 | +1.93R | 📈 |
| 620 | USDJPY | 05.01.21 08:00 | SELL | 102.947 | 103.077 | 102.687 | 102.687 | TP | +25 | +1.91R | 📈 |
| 621 | USDJPY | 14.01.21 05:00 | BUY | 104.027 | 103.847 | 104.387 | 103.847 | SL | -19 | -1.07R | 📈 |
| 622 | USDJPY | 18.01.21 06:00 | SELL | 103.737 | 103.876 | 103.459 | 103.876 | SL | -15 | -1.09R | 📈 |
| 623 | USDJPY | 20.01.21 16:00 | SELL | 103.737 | 103.847 | 103.517 | 103.517 | TP | +21 | +1.89R | 📈 |
| 624 | USDJPY | 26.01.21 17:00 | SELL | 103.580 | 103.683 | 103.374 | 103.683 | SL | -12 | -1.12R | 📈 |
| 625 | USDJPY | 27.01.21 09:00 | SELL | 103.664 | 103.754 | 103.485 | 103.754 | SL | -10 | -1.13R | 📈 |
| 626 | USDJPY | 22.02.21 16:00 | SELL | 105.344 | 105.536 | 104.959 | 104.959 | TP | +37 | +1.94R | 📈 |
| 627 | USDJPY | 23.03.21 06:00 | SELL | 108.698 | 108.824 | 108.446 | 108.446 | TP | +24 | +1.91R | 📈 |
| 628 | USDJPY | 06.04.21 16:00 | SELL | 109.895 | 110.113 | 109.459 | 109.459 | TP | +42 | +1.95R | 📈 |
| 629 | USDJPY | 12.04.21 13:00 | SELL | 109.307 | 109.475 | 108.970 | 109.475 | SL | -18 | -1.07R | 📈 |
| 630 | USDJPY | 13.04.21 13:00 | SELL | 109.332 | 109.508 | 108.981 | 109.508 | SL | -19 | -1.07R | 📈 |
| 631 | USDJPY | 19.04.21 03:00 | SELL | 108.715 | 108.845 | 108.454 | 108.454 | TP | +25 | +1.91R | 📈 |
| 632 | USDJPY | 20.04.21 18:00 | SELL | 108.121 | 108.328 | 107.707 | 107.707 | TP | +40 | +1.94R | 📈 |
| 633 | USDJPY | 23.04.21 23:00 | SELL | 107.885 | 108.066 | 107.522 | 108.066 | SL | -19 | -1.07R | 📈 |
| 634 | USDJPY | 07.05.21 16:00 | SELL | 108.572 | 108.805 | 108.105 | 108.805 | SL | -25 | -1.05R | 📈 |
| 635 | USDJPY | 11.05.21 04:00 | BUY | 108.943 | 108.762 | 109.305 | 108.762 | SL | -19 | -1.07R | 📈 |
| 636 | USDJPY | 11.05.21 15:00 | SELL | 108.588 | 108.766 | 108.231 | 108.766 | SL | -19 | -1.07R | 📈 |
| 637 | USDJPY | 19.05.21 17:00 | SELL | 108.763 | 108.943 | 108.403 | 108.943 | SL | -19 | -1.07R | 📈 |
| 638 | USDJPY | 20.05.21 15:00 | SELL | 108.911 | 109.072 | 108.589 | 108.589 | TP | +31 | +1.93R | 📈 |
| 639 | USDJPY | 26.05.21 00:00 | SELL | 108.738 | 108.891 | 108.431 | 108.891 | SL | -17 | -1.08R | 📈 |
| 640 | USDJPY | 09.06.21 17:00 | SELL | 109.282 | 109.410 | 109.026 | 109.410 | SL | -14 | -1.09R | 📈 |
| 641 | USDJPY | 10.06.21 23:00 | SELL | 109.313 | 109.468 | 109.002 | 109.468 | SL | -17 | -1.08R | 📈 |
| 642 | USDJPY | 14.07.21 17:00 | SELL | 110.072 | 110.224 | 109.767 | 109.767 | TP | +29 | +1.92R | 📈 |
| 643 | USDJPY | 19.07.21 04:00 | SELL | 109.860 | 110.012 | 109.556 | 110.012 | SL | -16 | -1.08R | 📈 |
| 644 | USDJPY | 19.07.21 11:00 | SELL | 109.836 | 109.987 | 109.533 | 109.533 | TP | +29 | +1.92R | 📈 |
| 645 | USDJPY | 02.08.21 14:00 | SELL | 109.507 | 109.646 | 109.229 | 109.229 | TP | +27 | +1.91R | 📈 |
| 646 | USDJPY | 20.08.21 11:00 | SELL | 109.608 | 109.771 | 109.282 | 109.771 | SL | -17 | -1.07R | 📈 |
| 647 | USDJPY | 23.08.21 22:00 | SELL | 109.678 | 109.828 | 109.378 | 109.828 | SL | -16 | -1.08R | 📈 |
| 648 | USDJPY | 24.08.21 14:00 | SELL | 109.707 | 109.838 | 109.445 | 109.445 | TP | +25 | +1.91R | 📈 |
| 649 | USDJPY | 27.08.21 20:00 | SELL | 109.798 | 109.974 | 109.446 | 109.974 | SL | -19 | -1.07R | 📈 |
| 650 | USDJPY | 31.08.21 08:00 | BUY | 109.900 | 109.803 | 110.095 | 109.803 | SL | -11 | -1.12R | 📈 |
| 651 | USDJPY | 31.08.21 16:00 | SELL | 109.705 | 109.834 | 109.448 | 109.834 | SL | -14 | -1.09R | 📈 |
| 652 | USDJPY | 07.09.21 04:00 | SELL | 109.775 | 109.853 | 109.619 | 109.853 | SL | -9 | -1.15R | 📈 |
| 653 | USDJPY | 13.09.21 04:00 | BUY | 109.963 | 109.852 | 110.185 | 109.852 | SL | -12 | -1.11R | 📈 |
| 654 | USDJPY | 14.09.21 18:00 | SELL | 109.651 | 109.786 | 109.382 | 109.382 | TP | +26 | +1.91R | 📈 |
| 655 | USDJPY | 20.09.21 14:00 | SELL | 109.503 | 109.640 | 109.229 | 109.640 | SL | -15 | -1.09R | 📈 |
| 656 | USDJPY | 27.10.21 13:00 | SELL | 113.638 | 113.828 | 113.257 | 113.828 | SL | -20 | -1.06R | 📈 |
| 657 | USDJPY | 04.11.21 17:00 | SELL | 113.591 | 113.816 | 113.141 | 113.816 | SL | -24 | -1.05R | 📈 |
| 658 | USDJPY | 05.11.21 16:00 | SELL | 113.629 | 113.844 | 113.198 | 113.198 | TP | +42 | +1.94R | 📈 |
| 659 | USDJPY | 01.12.21 17:00 | SELL | 112.833 | 113.151 | 112.197 | 113.151 | SL | -33 | -1.04R | 📈 |
| 660 | USDJPY | 02.12.21 15:00 | SELL | 112.814 | 113.096 | 112.249 | 113.096 | SL | -29 | -1.04R | 📈 |
| 661 | USDJPY | 03.12.21 21:00 | SELL | 112.587 | 112.899 | 111.963 | 112.899 | SL | -32 | -1.04R | 📈 |
| 662 | USDJPY | 09.12.21 15:00 | SELL | 113.426 | 113.618 | 113.041 | 113.618 | SL | -20 | -1.06R | 📈 |
| 663 | USDJPY | 10.12.21 19:00 | SELL | 113.361 | 113.561 | 112.962 | 113.561 | SL | -21 | -1.06R | 📈 |
| 664 | USDJPY | 16.12.21 20:00 | SELL | 113.626 | 113.821 | 113.236 | 113.821 | SL | -21 | -1.06R | 📈 |
| 665 | USDJPY | 12.01.22 17:00 | SELL | 115.089 | 115.278 | 114.711 | 114.711 | TP | +37 | +1.94R | 📈 |
| 666 | USDJPY | 19.01.22 08:00 | SELL | 114.249 | 114.456 | 113.835 | 114.456 | SL | -22 | -1.06R | 📈 |
| 667 | USDJPY | 19.01.22 17:00 | SELL | 114.342 | 114.548 | 113.931 | 113.931 | TP | +40 | +1.94R | 📈 |
| 668 | USDJPY | 03.02.22 12:00 | BUY | 114.738 | 114.579 | 115.055 | 115.055 | TP | +31 | +1.92R | 📈 |
| 669 | USDJPY | 24.02.22 06:00 | SELL | 114.690 | 114.893 | 114.283 | 114.893 | SL | -22 | -1.06R | 📈 |
| 670 | USDJPY | 11.05.22 20:00 | SELL | 129.926 | 130.362 | 129.054 | 129.054 | TP | +86 | +1.97R | 📈 |
| 671 | USDJPY | 18.05.22 16:00 | SELL | 128.895 | 129.178 | 128.330 | 128.330 | TP | +55 | +1.96R | 📈 |
| 672 | USDJPY | 20.05.22 19:00 | SELL | 127.858 | 128.289 | 126.997 | 126.997 | TP | +85 | +1.97R | 📈 |
| 673 | USDJPY | 26.05.22 11:00 | SELL | 126.593 | 126.934 | 125.911 | 126.934 | SL | -35 | -1.03R | 📈 |
| 674 | USDJPY | 27.05.22 05:00 | SELL | 126.786 | 127.109 | 126.140 | 127.109 | SL | -34 | -1.04R | 📈 |
| 675 | USDJPY | 24.06.22 21:00 | BUY | 135.357 | 134.923 | 136.224 | 134.923 | SL | -45 | -1.03R | 📈 |
| 676 | USDJPY | 28.07.22 02:00 | SELL | 136.446 | 136.805 | 135.729 | 135.729 | TP | +71 | +1.97R | 📈 |
| 677 | USDJPY | 05.08.22 00:00 | SELL | 132.855 | 133.326 | 131.914 | 133.326 | SL | -48 | -1.02R | 📈 |
| 678 | USDJPY | 05.08.22 13:00 | SELL | 133.055 | 133.501 | 132.163 | 133.501 | SL | -46 | -1.03R | 📈 |
| 679 | USDJPY | 10.08.22 16:00 | SELL | 133.138 | 133.614 | 132.185 | 132.185 | TP | +94 | +1.98R | 📈 |
| 680 | USDJPY | 15.08.22 17:00 | SELL | 132.736 | 133.106 | 131.996 | 133.106 | SL | -38 | -1.03R | 📈 |
| 681 | USDJPY | 13.09.22 16:00 | BUY | 144.404 | 143.735 | 145.742 | 143.735 | SL | -68 | -1.02R | 📈 |
| 682 | USDJPY | 22.09.22 14:00 | SELL | 142.490 | 143.737 | 139.995 | 143.737 | SL | -126 | -1.01R | 📈 |
| 683 | USDJPY | 01.11.22 13:00 | SELL | 147.235 | 147.711 | 146.283 | 147.711 | SL | -49 | -1.02R | 📈 |
| 684 | USDJPY | 03.11.22 05:00 | SELL | 147.358 | 147.923 | 146.227 | 147.923 | SL | -58 | -1.02R | 📈 |
| 685 | USDJPY | 04.11.22 15:00 | SELL | 147.193 | 147.661 | 146.258 | 146.258 | TP | +92 | +1.97R | 📈 |
| 686 | USDJPY | 10.11.22 16:00 | SELL | 143.715 | 144.381 | 142.384 | 142.384 | TP | +132 | +1.98R | 📈 |
| 687 | USDJPY | 15.11.22 11:00 | SELL | 139.505 | 140.091 | 138.334 | 138.334 | TP | +116 | +1.98R | 📈 |
| 688 | USDJPY | 23.11.22 17:00 | SELL | 139.995 | 140.456 | 139.073 | 139.073 | TP | +91 | +1.97R | 📈 |
| 689 | USDJPY | 28.11.22 05:00 | SELL | 138.519 | 138.952 | 137.653 | 137.653 | TP | +85 | +1.97R | 📈 |
| 690 | USDJPY | 29.11.22 10:00 | SELL | 138.290 | 138.794 | 137.282 | 138.794 | SL | -52 | -1.02R | 📈 |
| 691 | USDJPY | 08.12.22 02:00 | SELL | 136.372 | 136.822 | 135.471 | 136.822 | SL | -46 | -1.03R | 📈 |
| 692 | USDJPY | 08.12.22 18:00 | SELL | 136.509 | 136.981 | 135.565 | 136.981 | SL | -48 | -1.02R | 📈 |
| 693 | USDJPY | 13.12.22 16:00 | SELL | 135.132 | 135.743 | 133.911 | 135.743 | SL | -62 | -1.02R | 📈 |
| 694 | USDJPY | 29.12.22 16:00 | SELL | 133.162 | 133.550 | 132.387 | 132.387 | TP | +76 | +1.97R | 📈 |
| 695 | USDJPY | 04.01.23 10:00 | SELL | 130.241 | 130.781 | 129.161 | 130.781 | SL | -55 | -1.02R | 📈 |
| 696 | USDJPY | 06.01.23 21:00 | SELL | 132.093 | 132.796 | 130.686 | 132.796 | SL | -72 | -1.02R | 📈 |
| 697 | USDJPY | 12.01.23 04:00 | SELL | 131.655 | 132.085 | 130.794 | 130.794 | TP | +85 | +1.97R | 📈 |
| 698 | USDJPY | 18.01.23 19:00 | SELL | 128.448 | 129.320 | 126.705 | 129.320 | SL | -88 | -1.01R | 📈 |
| 699 | USDJPY | 30.01.23 09:00 | SELL | 129.583 | 129.974 | 128.801 | 129.974 | SL | -40 | -1.03R | 📈 |
| 700 | USDJPY | 01.02.23 13:00 | SELL | 129.818 | 130.111 | 129.232 | 129.232 | TP | +57 | +1.96R | 📈 |
| 701 | USDJPY | 03.02.23 16:00 | BUY | 129.940 | 129.462 | 130.896 | 130.896 | TP | +94 | +1.98R | 📈 |
| 702 | USDJPY | 09.02.23 03:00 | BUY | 131.506 | 131.151 | 132.216 | 131.151 | SL | -37 | -1.03R | 📈 |
| 703 | USDJPY | 10.03.23 17:00 | SELL | 134.828 | 135.505 | 133.474 | 133.474 | TP | +134 | +1.98R | 📈 |
| 704 | USDJPY | 15.03.23 15:00 | SELL | 132.653 | 133.324 | 131.311 | 133.324 | SL | -68 | -1.02R | 📈 |
| 705 | USDJPY | 17.03.23 09:00 | SELL | 132.863 | 133.376 | 131.837 | 131.837 | TP | +101 | +1.98R | 📈 |
| 706 | USDJPY | 22.03.23 22:00 | SELL | 131.193 | 131.730 | 130.120 | 130.120 | TP | +106 | +1.98R | 📈 |
| 707 | USDJPY | 28.03.23 08:00 | SELL | 130.611 | 130.978 | 129.877 | 130.978 | SL | -38 | -1.03R | 📈 |
| 708 | USDJPY | 14.04.23 18:00 | BUY | 133.458 | 133.041 | 134.292 | 134.292 | TP | +82 | +1.97R | 📈 |
| 709 | USDJPY | 24.04.23 06:00 | BUY | 134.439 | 134.130 | 135.058 | 134.130 | SL | -32 | -1.04R | 📈 |
| 710 | USDJPY | 25.04.23 16:00 | SELL | 133.913 | 134.249 | 133.241 | 133.241 | TP | +66 | +1.96R | 📈 |
| 711 | USDJPY | 27.04.23 16:00 | BUY | 133.897 | 133.521 | 134.649 | 133.521 | SL | -39 | -1.03R | 📈 |
| 712 | USDJPY | 10.05.23 17:00 | SELL | 134.416 | 134.769 | 133.709 | 134.769 | SL | -37 | -1.03R | 📈 |
| 713 | USDJPY | 07.06.23 04:00 | SELL | 139.370 | 139.611 | 138.888 | 139.611 | SL | -25 | -1.05R | 📈 |
| 714 | USDJPY | 08.06.23 17:00 | SELL | 139.003 | 139.352 | 138.306 | 139.352 | SL | -36 | -1.03R | 📈 |
| 715 | USDJPY | 12.06.23 14:00 | SELL | 139.187 | 139.440 | 138.682 | 139.440 | SL | -26 | -1.05R | 📈 |
| 716 | USDJPY | 18.07.23 11:00 | SELL | 138.222 | 138.546 | 137.574 | 138.546 | SL | -34 | -1.04R | 📈 |
| 717 | USDJPY | 27.07.23 18:00 | BUY | 141.245 | 140.781 | 142.174 | 140.781 | SL | -48 | -1.03R | 📈 |
| 718 | USDJPY | 07.08.23 19:00 | BUY | 142.440 | 142.092 | 143.136 | 143.136 | TP | +68 | +1.97R | 📈 |
| 719 | USDJPY | 21.08.23 13:00 | BUY | 145.764 | 145.472 | 146.348 | 146.348 | TP | +57 | +1.96R | 📈 |
| 720 | USDJPY | 30.08.23 16:00 | SELL | 145.864 | 146.179 | 145.234 | 146.179 | SL | -33 | -1.04R | 📈 |
| 721 | USDJPY | 10.10.23 20:00 | SELL | 148.546 | 148.817 | 148.005 | 148.817 | SL | -28 | -1.04R | 📈 |
| 722 | USDJPY | 15.11.23 21:00 | BUY | 151.369 | 151.009 | 152.088 | 151.009 | SL | -37 | -1.03R | 📈 |
| 723 | USDJPY | 22.11.23 02:00 | SELL | 148.136 | 148.524 | 147.360 | 148.524 | SL | -40 | -1.03R | 📈 |
| 724 | USDJPY | 27.11.23 05:00 | SELL | 149.130 | 149.364 | 148.663 | 148.663 | TP | +46 | +1.95R | 📈 |
| 725 | USDJPY | 01.12.23 20:00 | SELL | 146.841 | 147.360 | 145.803 | 147.360 | SL | -53 | -1.02R | 📈 |
| 726 | USDJPY | 05.12.23 10:00 | SELL | 146.828 | 147.184 | 146.116 | 147.184 | SL | -37 | -1.03R | 📈 |
| 727 | USDJPY | 05.12.23 16:00 | SELL | 146.787 | 147.141 | 146.080 | 147.141 | SL | -37 | -1.03R | 📈 |
| 728 | USDJPY | 07.12.23 05:00 | SELL | 146.848 | 147.135 | 146.275 | 146.275 | TP | +56 | +1.96R | 📈 |
| 729 | USDJPY | 13.12.23 17:00 | SELL | 145.240 | 145.609 | 144.503 | 144.503 | TP | +73 | +1.97R | 📈 |
| 730 | USDJPY | 21.12.23 04:00 | SELL | 143.019 | 143.401 | 142.255 | 142.255 | TP | +75 | +1.97R | 📈 |
| 731 | USDJPY | 27.12.23 19:00 | SELL | 142.047 | 142.344 | 141.453 | 141.453 | TP | +58 | +1.96R | 📈 |
| 732 | USDJPY | 29.12.23 19:00 | SELL | 140.905 | 141.328 | 140.058 | 141.328 | SL | -44 | -1.03R | 📈 |
| 733 | USDJPY | 31.01.24 17:00 | SELL | 146.632 | 147.056 | 145.784 | 147.056 | SL | -44 | -1.03R | 📈 |
| 734 | USDJPY | 02.02.24 16:00 | BUY | 147.958 | 147.531 | 148.811 | 148.811 | TP | +84 | +1.97R | 📈 |
| 735 | USDJPY | 08.02.24 04:00 | BUY | 148.283 | 147.992 | 148.865 | 148.865 | TP | +57 | +1.96R | 📈 |
| 736 | USDJPY | 29.02.24 04:00 | SELL | 150.203 | 150.393 | 149.824 | 149.824 | TP | +37 | +1.94R | 📈 |
| 737 | USDJPY | 04.03.24 01:00 | SELL | 150.103 | 150.352 | 149.605 | 150.352 | SL | -26 | -1.05R | 📈 |
| 738 | USDJPY | 05.03.24 17:00 | SELL | 150.087 | 150.275 | 149.711 | 149.711 | TP | +36 | +1.94R | 📈 |
| 739 | USDJPY | 02.05.24 00:00 | SELL | 154.830 | 155.630 | 153.230 | 155.630 | SL | -81 | -1.01R | 📈 |
| 740 | USDJPY | 15.05.24 12:00 | SELL | 155.640 | 155.890 | 155.141 | 155.141 | TP | +49 | +1.95R | 📈 |
| 741 | USDJPY | 31.05.24 18:00 | BUY | 157.153 | 156.805 | 157.850 | 156.805 | SL | -36 | -1.03R | 📈 |
| 742 | USDJPY | 07.06.24 02:00 | SELL | 155.606 | 155.954 | 154.910 | 155.954 | SL | -36 | -1.03R | 📈 |
| 743 | USDJPY | 12.06.24 16:00 | SELL | 156.157 | 156.455 | 155.562 | 156.455 | SL | -31 | -1.04R | 📈 |
| 744 | USDJPY | 08.07.24 17:00 | SELL | 160.650 | 160.965 | 160.020 | 160.965 | SL | -33 | -1.04R | 📈 |
| 745 | USDJPY | 11.07.24 16:00 | SELL | 158.630 | 159.119 | 157.652 | 157.652 | TP | +97 | +1.98R | 📈 |
| 746 | USDJPY | 17.07.24 09:00 | SELL | 157.876 | 158.145 | 157.338 | 157.338 | TP | +53 | +1.96R | 📈 |
| 747 | USDJPY | 22.07.24 11:00 | SELL | 156.801 | 157.199 | 156.005 | 156.005 | TP | +78 | +1.97R | 📈 |
| 748 | USDJPY | 29.07.24 10:00 | SELL | 153.345 | 153.924 | 152.186 | 153.924 | SL | -59 | -1.02R | 📈 |
| 749 | USDJPY | 30.07.24 21:00 | SELL | 153.194 | 153.767 | 152.048 | 153.767 | SL | -59 | -1.02R | 📈 |
| 750 | USDJPY | 13.08.24 20:00 | SELL | 146.727 | 147.160 | 145.861 | 147.160 | SL | -45 | -1.03R | 📈 |
| 751 | USDJPY | 14.08.24 15:00 | SELL | 146.884 | 147.334 | 145.983 | 147.334 | SL | -46 | -1.03R | 📈 |
| 752 | USDJPY | 14.08.24 18:00 | SELL | 146.757 | 147.315 | 145.641 | 147.315 | SL | -57 | -1.02R | 📈 |
| 753 | USDJPY | 21.08.24 17:00 | SELL | 145.738 | 146.197 | 144.820 | 146.197 | SL | -47 | -1.03R | 📈 |
| 754 | USDJPY | 23.08.24 19:00 | SELL | 144.859 | 145.470 | 143.637 | 143.637 | TP | +121 | +1.98R | 📈 |
| 755 | USDJPY | 10.09.24 19:00 | SELL | 142.280 | 142.754 | 141.332 | 141.332 | TP | +94 | +1.98R | 📈 |
| 756 | USDJPY | 12.09.24 23:00 | SELL | 141.859 | 142.421 | 140.734 | 140.734 | TP | +111 | +1.98R | 📈 |
| 757 | USDJPY | 05.11.24 17:00 | SELL | 151.827 | 152.155 | 151.170 | 152.155 | SL | -34 | -1.04R | 📈 |
| 758 | USDJPY | 21.11.24 12:00 | SELL | 154.392 | 154.855 | 153.465 | 154.855 | SL | -48 | -1.03R | 📈 |
| 759 | USDJPY | 22.11.24 12:00 | SELL | 154.493 | 154.965 | 153.548 | 154.965 | SL | -48 | -1.02R | 📈 |
| 760 | USDJPY | 25.11.24 16:00 | SELL | 153.920 | 154.389 | 152.982 | 154.389 | SL | -48 | -1.03R | 📈 |
| 761 | USDJPY | 26.11.24 03:00 | SELL | 154.005 | 154.474 | 153.068 | 153.068 | TP | +93 | +1.97R | 📈 |
| 762 | USDJPY | 02.12.24 10:00 | SELL | 150.245 | 150.745 | 149.245 | 149.245 | TP | +99 | +1.98R | 📈 |
| 763 | USDJPY | 03.12.24 15:00 | SELL | 149.675 | 150.123 | 148.780 | 148.780 | TP | +88 | +1.97R | 📈 |
| 764 | USDJPY | 06.12.24 06:00 | SELL | 149.875 | 150.252 | 149.121 | 150.252 | SL | -39 | -1.03R | 📈 |
| 765 | USDJPY | 06.12.24 17:00 | SELL | 149.663 | 150.131 | 148.726 | 150.131 | SL | -48 | -1.03R | 📈 |
| 766 | USDJPY | 06.01.25 16:00 | SELL | 156.608 | 157.032 | 155.759 | 157.032 | SL | -44 | -1.03R | 📈 |
| 767 | USDJPY | 15.01.25 09:00 | SELL | 157.339 | 157.695 | 156.627 | 156.627 | TP | +70 | +1.97R | 📈 |
| 768 | USDJPY | 20.01.25 22:00 | SELL | 155.629 | 156.040 | 154.808 | 156.040 | SL | -42 | -1.03R | 📈 |
| 769 | USDJPY | 21.01.25 18:00 | SELL | 155.320 | 155.815 | 154.330 | 155.815 | SL | -51 | -1.02R | 📈 |
| 770 | USDJPY | 22.01.25 03:00 | SELL | 155.414 | 155.819 | 154.604 | 155.819 | SL | -42 | -1.03R | 📈 |
| 771 | USDJPY | 27.01.25 01:00 | SELL | 155.778 | 156.254 | 154.825 | 154.825 | TP | +94 | +1.98R | 📈 |
| 772 | USDJPY | 29.01.25 20:00 | SELL | 155.048 | 155.421 | 154.303 | 155.421 | SL | -38 | -1.03R | 📈 |
| 773 | USDJPY | 30.01.25 03:00 | SELL | 154.711 | 155.108 | 153.918 | 153.918 | TP | +78 | +1.97R | 📈 |
| 774 | USDJPY | 04.02.25 20:00 | SELL | 154.259 | 154.689 | 153.399 | 153.399 | TP | +85 | +1.97R | 📈 |
| 775 | USDJPY | 13.02.25 20:00 | SELL | 153.156 | 153.588 | 152.292 | 152.292 | TP | +85 | +1.97R | 📈 |
| 776 | USDJPY | 19.02.25 12:00 | SELL | 151.643 | 151.951 | 151.026 | 151.026 | TP | +60 | +1.96R | 📈 |
| 777 | USDJPY | 21.02.25 17:00 | SELL | 149.806 | 150.257 | 148.904 | 148.904 | TP | +89 | +1.97R | 📈 |
| 778 | USDJPY | 24.02.25 17:00 | SELL | 149.314 | 149.725 | 148.492 | 149.725 | SL | -42 | -1.03R | 📈 |
| 779 | USDJPY | 25.02.25 17:00 | SELL | 149.170 | 149.632 | 148.246 | 149.632 | SL | -47 | -1.03R | 📈 |
| 780 | USDJPY | 26.02.25 21:00 | SELL | 148.914 | 149.367 | 148.008 | 149.367 | SL | -46 | -1.03R | 📈 |
| 781 | USDJPY | 27.02.25 07:00 | SELL | 149.089 | 149.489 | 148.289 | 149.489 | SL | -41 | -1.03R | 📈 |
| 782 | USDJPY | 03.03.25 23:00 | SELL | 149.400 | 149.962 | 148.276 | 148.276 | TP | +111 | +1.98R | 📈 |
| 783 | USDJPY | 05.03.25 16:00 | SELL | 149.012 | 149.584 | 147.869 | 147.869 | TP | +113 | +1.98R | 📈 |
| 784 | USDJPY | 10.03.25 01:00 | SELL | 147.465 | 148.074 | 146.246 | 148.074 | SL | -62 | -1.02R | 📈 |
| 785 | USDJPY | 13.03.25 20:00 | SELL | 147.619 | 148.060 | 146.737 | 148.060 | SL | -45 | -1.03R | 📈 |
| 786 | USDJPY | 21.03.25 05:00 | BUY | 149.063 | 148.728 | 149.733 | 148.728 | SL | -35 | -1.04R | 📈 |
| 787 | USDJPY | 01.04.25 13:00 | SELL | 149.623 | 150.008 | 148.854 | 150.008 | SL | -40 | -1.03R | 📈 |
| 788 | USDJPY | 03.04.25 01:00 | SELL | 148.698 | 149.208 | 147.678 | 147.678 | TP | +101 | +1.98R | 📈 |
| 789 | USDJPY | 07.04.25 01:00 | SELL | 145.604 | 146.610 | 143.593 | 146.610 | SL | -102 | -1.01R | 📈 |
| 790 | USDJPY | 07.04.25 08:00 | SELL | 145.878 | 146.854 | 143.927 | 146.854 | SL | -99 | -1.01R | 📈 |
| 791 | USDJPY | 09.04.25 00:00 | SELL | 146.142 | 146.821 | 144.783 | 144.783 | TP | +135 | +1.98R | 📈 |
| 792 | USDJPY | 15.04.25 14:00 | SELL | 142.843 | 143.364 | 141.801 | 141.801 | TP | +103 | +1.98R | 📈 |
| 793 | USDJPY | 17.04.25 17:00 | SELL | 142.142 | 142.610 | 141.207 | 142.610 | SL | -48 | -1.03R | 📈 |
| 794 | USDJPY | 18.04.25 06:00 | SELL | 142.313 | 142.658 | 141.623 | 141.623 | TP | +68 | +1.97R | 📈 |
| 795 | USDJPY | 19.05.25 02:00 | SELL | 145.163 | 145.574 | 144.341 | 144.341 | TP | +81 | +1.97R | 📈 |
| 796 | USDJPY | 23.05.25 07:00 | SELL | 143.437 | 143.829 | 142.653 | 142.653 | TP | +77 | +1.97R | 📈 |
| 797 | USDJPY | 29.05.25 20:00 | SELL | 144.146 | 144.633 | 143.173 | 143.173 | TP | +96 | +1.98R | 📈 |
| 798 | USDJPY | 04.06.25 20:00 | SELL | 142.642 | 143.139 | 141.648 | 143.139 | SL | -51 | -1.02R | 📈 |
| 799 | USDJPY | 25.06.25 14:00 | BUY | 145.729 | 145.376 | 146.434 | 145.376 | SL | -36 | -1.03R | 📈 |
| 800 | USDJPY | 30.06.25 06:00 | SELL | 144.293 | 144.678 | 143.523 | 143.523 | TP | +76 | +1.97R | 📈 |
| 801 | USDJPY | 05.08.25 18:00 | SELL | 147.448 | 147.831 | 146.681 | 147.831 | SL | -40 | -1.03R | 📈 |
| 802 | USDJPY | 06.08.25 21:00 | SELL | 147.240 | 147.561 | 146.599 | 147.561 | SL | -33 | -1.04R | 📈 |
| 803 | USDJPY | 07.08.25 10:00 | SELL | 146.857 | 147.211 | 146.148 | 147.211 | SL | -37 | -1.03R | 📈 |
| 804 | USDJPY | 08.08.25 01:00 | SELL | 147.018 | 147.384 | 146.286 | 147.384 | SL | -38 | -1.03R | 📈 |
| 805 | USDJPY | 20.08.25 16:00 | SELL | 147.275 | 147.558 | 146.709 | 147.558 | SL | -29 | -1.04R | 📈 |
| 806 | USDJPY | 26.08.25 19:00 | SELL | 147.316 | 147.640 | 146.667 | 147.640 | SL | -34 | -1.04R | 📈 |
| 807 | USDJPY | 28.08.25 00:00 | SELL | 147.362 | 147.632 | 146.823 | 146.823 | TP | +53 | +1.96R | 📈 |
| 808 | USDJPY | 29.08.25 18:00 | SELL | 146.827 | 147.123 | 146.236 | 147.123 | SL | -31 | -1.04R | 📈 |
| 809 | USDJPY | 01.09.25 09:00 | SELL | 146.915 | 147.183 | 146.380 | 147.183 | SL | -28 | -1.04R | 📈 |
| 810 | USDJPY | 11.09.25 20:00 | SELL | 147.055 | 147.359 | 146.446 | 147.359 | SL | -32 | -1.04R | 📈 |
| 811 | USDJPY | 15.09.25 14:00 | SELL | 147.391 | 147.617 | 146.940 | 146.940 | TP | +44 | +1.95R | 📈 |
| 812 | USDJPY | 13.10.25 22:00 | BUY | 152.285 | 151.956 | 152.943 | 151.956 | SL | -34 | -1.04R | 📈 |
| 813 | USDJPY | 29.10.25 16:00 | SELL | 152.002 | 152.368 | 151.271 | 152.368 | SL | -38 | -1.03R | 📈 |
| 814 | USDJPY | 28.11.25 16:00 | SELL | 156.021 | 156.246 | 155.570 | 156.246 | SL | -24 | -1.05R | 📈 |
| 815 | USDJPY | 28.11.25 18:00 | SELL | 156.028 | 156.299 | 155.485 | 155.485 | TP | +53 | +1.96R | 📈 |
| 816 | USDJPY | 03.12.25 13:00 | SELL | 155.524 | 155.748 | 155.076 | 155.076 | TP | +44 | +1.95R | 📈 |
| 817 | USDJPY | 12.12.25 14:00 | BUY | 155.910 | 155.651 | 156.428 | 155.651 | SL | -27 | -1.05R | 📈 |
| 818 | USDJPY | 15.12.25 05:00 | SELL | 155.427 | 155.708 | 154.866 | 154.866 | TP | +55 | +1.96R | 📈 |
| Total: 336 | +1,207 | +45.3R | |||||||||
Todas las operaciones del yen — tanto de la primera versión (818 en 2008–2025) como de Puria 2.0 (1,030 en 2008–2026) — están en el diario en Excel, en hojas separadas.
Errores frecuentes
- Operar la versión clásica con un take profit de 10–20 pips. La prueba muestra que a largo plazo el spread se come todo el resultado.
- Entrar antes del cierre de la barra. La EMA 5 y el MACD «se redibujan» dentro de la vela. La señal solo existe en una barra cerrada.
- Construir las LWMA solo sobre Low. Entonces casi no hay compras. Para las compras en Puria 2.0 las LWMA se construyen sobre High.
- Operar contra la tendencia H4 y semanal. Sin estos filtros hay más operaciones y el resultado es peor.
- Usar un stop fijo con cualquier volatilidad. En el oro el stop pasó de $6 a $35 en 18 años: los pips fijos aquí no funcionan.
- Vender USDJPY durante las intervenciones. En 2026 todas esas ventas cerraron en el stop.
- Operar todos los pares de la tabla del autor. Incluso Puria 2.0 solo se mantiene en positivo en instrumentos con tendencia: el oro y en parte el yen.
- Creer en pruebas de 3 meses. Nuestra antigua prueba de 3–12 meses era positiva, y 17 años de historial mostraron pérdida.
FAQ: preguntas frecuentes sobre el Método Puria
¿Funciona el Método Puria en 2026?
La versión clásica, no: 13,002 operaciones en 2008–2024 dieron −19,276 pips. Puria 2.0 en oro, sí: en 2026 (enero–octubre) +10.6R en 40 operaciones, y las reglas se eligieron antes de 2024. En USDJPY en 2026 solo las compras son positivas (+2.7R); las ventas, negativas.
¿Por qué precisamente el oro?
La señal de Puria es de tendencia, y en los últimos 18 años el oro se ha movido en tendencias largas. Probamos las mismas reglas en 33 instrumentos: la mayoría de los pares de divisas no muestran ventaja. Entre los instrumentos con historial desde 2008, Puria 2.0 es positiva en 2008–2023 solo en el oro y USDJPY, y en 2026 solo el oro siguió en positivo.
¿No es sobreajuste al historial?
Hicimos todo para evitarlo: las reglas se eligieron con 2008–2023, el stop y el take profit se tomaron de la primera versión sin cambios y 2024–2026 se probó «a ciegas». Las 16 combinaciones vecinas de stop y take profit también son positivas. El riesgo no se puede descartar del todo, por eso seguiremos actualizando las estadísticas.
¿Se puede mover el stop a breakeven para que la clásica sea rentable?
Probamos el breakeven tras +8, +10 y +12 pips. En los tres pares el resultado siguió en negativo, más o menos al mismo nivel.
¿El MACD debe confirmar en la misma vela o puede hacerlo después?
La prueba principal es estricta: MACD en la vela del cruce. La variante suave (confirmación dentro de 3 velas) empeora todavía más la versión clásica. Para la primera versión mejorada en USDJPY daba +3,578 pips en lugar de +2,692, pero las LWMA espejo resuelven el mismo problema de forma más simple y honesta.
¿Qué timeframe es mejor?
H1. En M30 hay demasiados cruces falsos; en H4, pocas operaciones y un resultado inestable.
¿Hay un EA para el Método Puria?
No hay un EA listo. La estrategia es mecánica y fácil de automatizar. Para operar a mano hay una plantilla Puria 2.0 para MT4 lista: LWMA 85 y 75 rojas sobre Low (ventas), verdes sobre High (compras), EMA 5 azul, MACD 15/26/1 y ATR 14 para el stop. La EMA 50 naranja solo se ve en H4 y la EMA 20 solo en W1: cambia de timeframe para comprobar la tendencia. El lote se calcula cómodamente con nuestro EA gratuito S4U.PRO Trade Panel.
¿Es una ganancia garantizada?
No. Una prueba es historia, no una promesa. Incluso en el oro hubo un año de −16R y 12 stops seguidos. Opera solo con dinero que puedas permitirte perder y prueba primero la estrategia en una cuenta demo.
Vídeo: el Método Puria probado con operaciones reales
El antiguo vídeo del autor de la estrategia:
Conclusión
El Método Puria en su forma original — M30, stop de 14 pips y take profit de 10–25 pips — no es rentable en el historial largo: pérdida en los cuatro pares probados, −19,276 pips en 17 años. El problema no son los indicadores, sino el take profit pequeño, que se come el spread.
Puria 2.0 — H1, tendencia H4 y semanal, LWMA espejo, stop 1.5 ATR y take profit 2R — ganó +108R en 994 operaciones en oro en 2008–2026, con 14 años positivos de 19. Fijamos las reglas con 2008–2023, y 2026, que no participó en la elección, también es positivo: +10.6R. No son «50 pips al día», sino cerca de +0.1R por operación: modesto, pero comprobado y sin martingala.
En USDJPY la estrategia funcionó hasta 2025, pero en 2026 las ventas contra un yen que se debilitaba — en medio de intervenciones — cerraban en el stop. Nuestra conclusión: hoy el instrumento principal para el Método Puria es el oro; en USDJPY, solo compras y con cautela, nada de ventas. Empieza con una cuenta demo. Si quieres otra estrategia probada en oro, mira FVG en oro (185 operaciones con diario).
Otra estrategia en oro que probamos: la estrategia Kortik («Daga», XAUUSD, W1+D1+H1) probada en 21 años de historia. Las reglas clásicas del autor dieron +112R en 589 operaciones de 2005–2026, y Kortik 2.0 con un stop correcto, +134R; 2026 también en ganancia.
Este artículo tiene fines educativos y no es una recomendación de inversión. Operar en Forex y CFD conlleva un alto riesgo de perder dinero. Los resultados pasados no garantizan beneficios futuros. Datos: historial de cotizaciones de MetaTrader 4 (Alpari, hora del terminal GMT+2/+3) de 2008–2025; 2026 — velas horarias de Yahoo Finance (UTC), oro — futuros COMEX (GC). Las cotizaciones de tu bróker pueden diferir ligeramente.