Contents 14
- Puria Method rules (original)
- How we tested the strategy
- Result: the classic Puria Method loses money
- Puria 2.0: the improved version on gold
- How we made sure it is not curve fitting
- Statistics: 994 gold trades over 2008–2026
- Puria 2.0 trade examples step by step
- Gallery: all gold trades 2024–2026
- How to calculate the lot size on gold
- USDJPY results: why the yen is at the end of the article
- Common mistakes
- FAQ: common questions about the Puria Method
- Video: the Puria Method tested on real trades
- Conclusion
The Puria Method is one of the best-known simple forex strategies: three moving averages and MACD, a small take profit and the promise of “at least 50 pips a day”. We published this article many years ago, and thousands of traders have read it since.
In 2026 we tested the strategy with a program over the whole history. First, strictly by the author’s rules: 13,002 trades on four currency pairs over 2008–2024, spread included. Then we improved it step by step and found a version that works on gold (XAUUSD): a profit over 2008–2025 and a profit in 2026, a year we did not use to choose the rules. Below are the original rules, the honest results of the classic version, Puria 2.0 on gold with every trade, and, separately, what happened on USDJPY.
Puria Method rules (original)
Below are the rules exactly as they have always appeared in this article. These are the rules we tested.
Indicators
Add the following to an H1 or M30 chart (depending on the pair — see the table below):
- Moving Average 1: period 85, method Linear Weighted (LWMA), apply to Low, color red.
- Moving Average 2: period 75, method Linear Weighted, apply to Low, color red.
- Moving Average 3: period 5, method Exponential (EMA), apply to Close, color yellow.
- MACD: fast EMA 15, slow EMA 26, MACD SMA 1.
All indicators come with standard MetaTrader 4 and 5. A ready-made MT4 template is at the end of this section.

Entering a trade
- Buy: the yellow EMA 5 crosses both red LWMAs from below, and MACD confirms — the bar closed above the zero line.
- Sell: the yellow EMA 5 crosses both red LWMAs from above, and the MACD bar closed below zero.
- Stop Loss: 14 pips at most.
- Take Profit: fixed, different for each pair.
Currency pairs, timeframes and take profit
| Pair | Timeframe | Take Profit |
|---|---|---|
| AUDJPY | M30 | 15 pips |
| NZDUSD | H1 | 25 pips |
| USDCAD | H1 | 20 pips |
| EURGBP | H1 | 10 pips |
| USDJPY | M30 | 15 pips |
| GBPUSD | M30 | 20 pips |
| USDCHF | M30 | 10 pips |
| EURCHF | H1 | 15 pips |
| AUDUSD | M30 | 10 pips |
| EURJPY | M30 | 15 pips |
| CHFJPY | H1 | 15 pips |
| CADJPY | M30 | 20 pips |
| EURUSD | M30 | 15 pips |
The author’s idea: “better to take a little every day”. A small take profit is hit often, and the stop, according to the author, “happens very rarely”. Let’s check whether that is true.
- Download the classic MetaTrader 4 template — method_puria.tpl
- Our old manual test from 2018–2019 — here >>
How we tested the strategy
We used to test the strategy by hand in Forex Tester — a few months on each pair. This time we ran it with a program over every bar, with no gaps and no picking of “convenient” trades.
- Data: MetaTrader 4 price history (Alpari), 2008–2024, terminal time.
- Pairs: GBPUSD, EURUSD, USDJPY (M30) and USDCAD (H1) — they have the longest and cleanest history. Timeframes and take profits strictly from the author’s table.
- Signal: on the closed bar EMA 5 is on the other side of both LWMAs, and on the previous bar it was not yet; MACD on the same bar is above zero (for a buy) or below zero (for a sell).
- Entry: at the open of the next bar. Stop 14 pips, take profit from the table. One trade per pair at a time.
- Spread: deducted from every trade — GBPUSD 1.5 pips, EURUSD 1.0, USDJPY 1.2, USDCAD 1.8.
- Accuracy: if one M30 bar touched both the stop and the take profit, we checked on M5 which came first.
Result: the classic Puria Method loses money
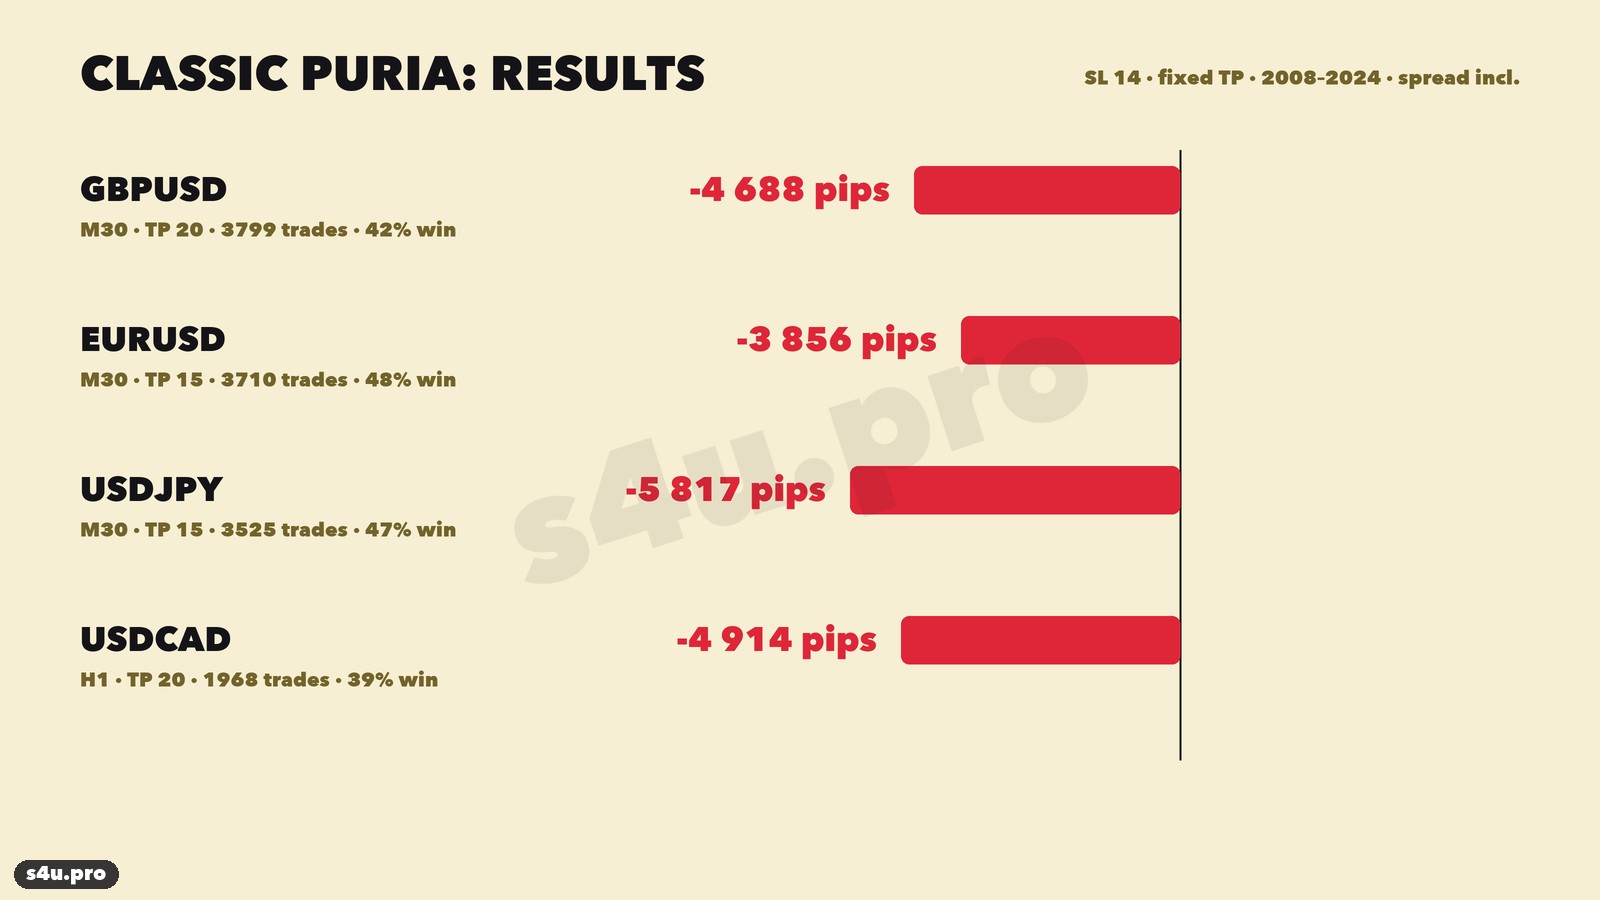
| Pair | TF / take profit | Trades | Winners | Result, pips |
|---|---|---|---|---|
| GBPUSD | M30 / 20 | 3,799 | 42% | −4,688 |
| EURUSD | M30 / 15 | 3,710 | 48% | −3,856 |
| USDJPY | M30 / 15 | 3,525 | 47% | −5,817 |
| USDCAD | H1 / 20 | 1,968 | 39% | −4,914 |
| Total | 13,002 | −19,276 |
Not a single pair ended in profit. The equity curves go down almost in a straight line — these are not “bad years” but a steady loss over the whole history.
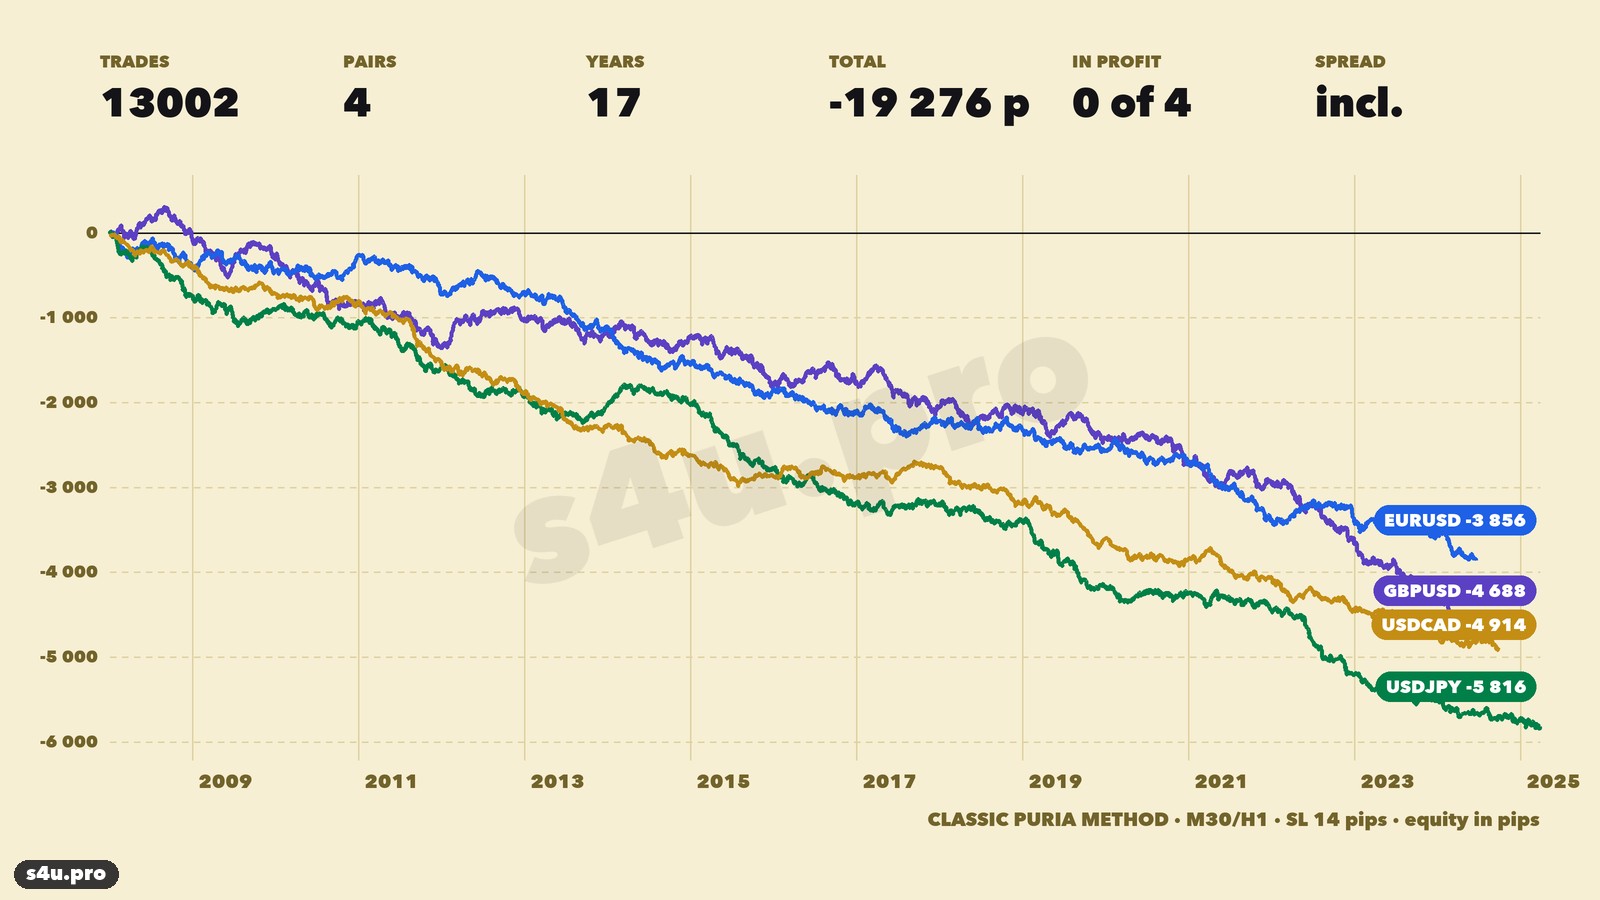
The promise that “the stop happens very rarely” did not hold either: 52–61% of trades closed at the stop. A 14-pip stop on M30 is smaller than the average range of a single GBPUSD candle — normal noise knocks it out.
Why it fails: the spread eats everything
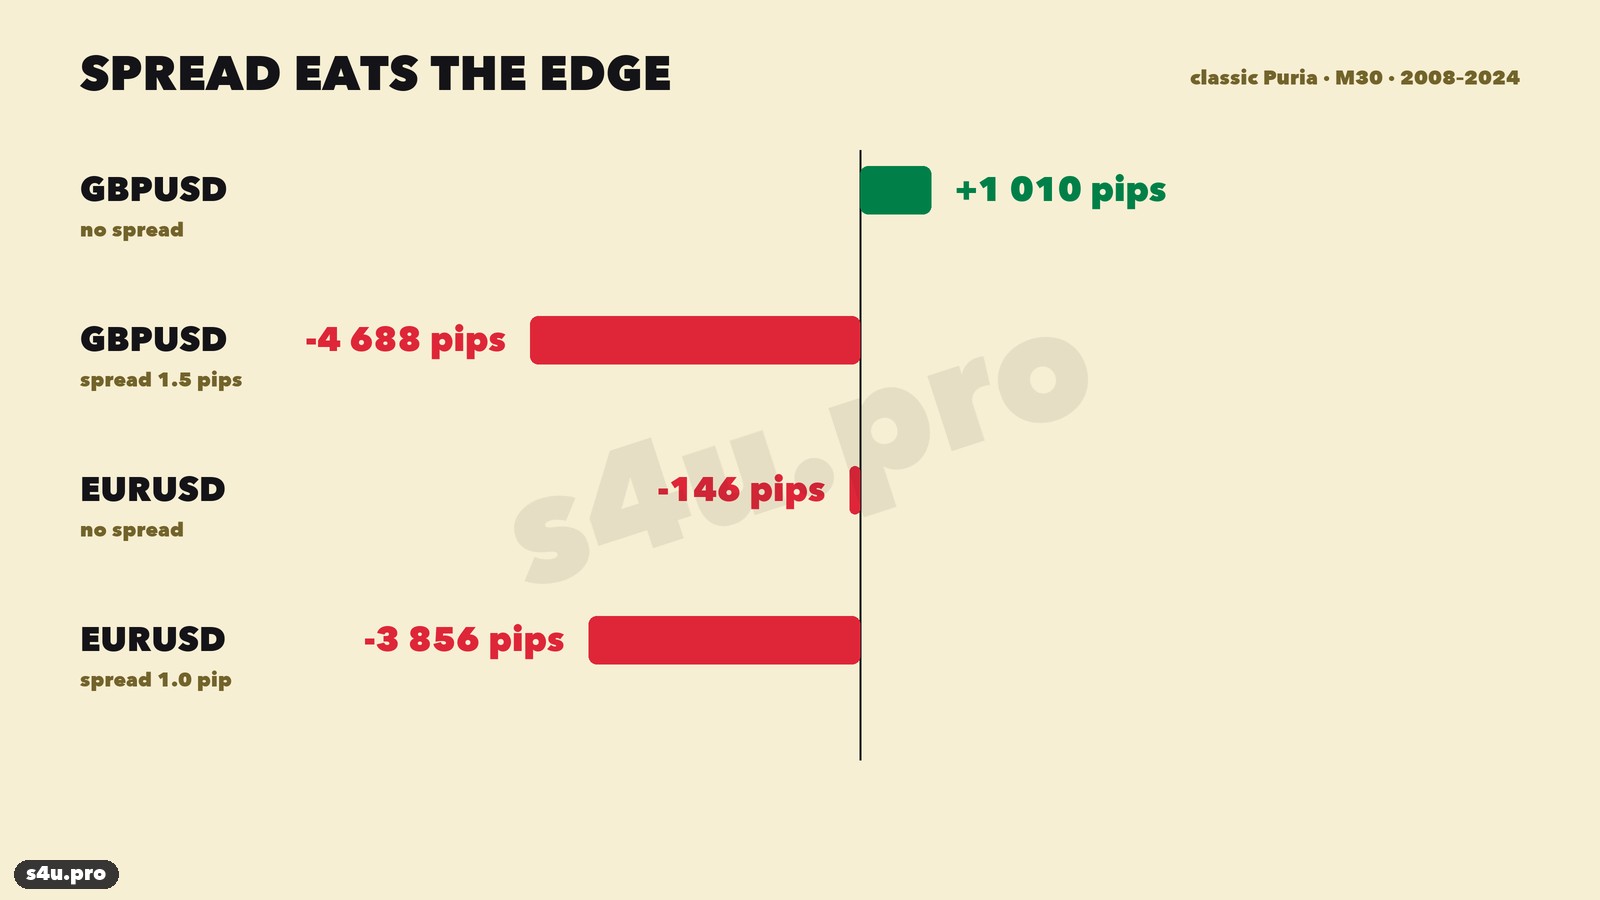
We ran the same test without the spread. GBPUSD then gives +1,010 pips, EURUSD about zero (−146). So the signal itself gives almost no edge, and with a 15–20 pip take profit a 1–1.5 pip spread takes 7–10% of every winning trade and adds as much to every loss. Over thousands of trades this turns zero into a big loss.
What about the old +84% test?
In the manual test of 2018–2019 GBPUSD M30 showed +84% for the year, and losing trades there were “closed at breakeven”. We took the same period (August 2018 – June 2019) and tested two variants: strictly by the rules and with the stop moved to breakeven after +10 pips. Both gave about −100 pips after the spread. Moving to breakeven does not help over the whole history either: −4,234 pips on GBPUSD, −3,998 on EURUSD, −6,036 on USDJPY.
A manual test always risks mistakes: trades get skipped, entries get “adjusted”, the spread is ignored. That is why we now test strategies only with a program and show every trade.
Puria 2.0: the improved version on gold
The signal itself — EMA 5 crossing two LWMAs with MACD confirmation — is a trend signal by nature. A small fixed take profit forces you out before the trend has time to move. We kept the author’s indicators and changed five things. We found the first three earlier, on currency pairs, and the fourth and fifth while working out why the first improved version stopped working on the yen.
- H1 timeframe instead of M30. Fewer false crossings, and the spread becomes a smaller share of the move.
- H4 trend filter. Buy only if the last closed H4 candle closed above EMA 50 on H4. Sell only if it closed below.
- Stop and target based on volatility. Stop Loss = 1.5 × ATR(14) on H1, Take Profit = 2 stops (2R). One trade at a time.
- “Mirrored” LWMAs. For sells the red LWMA 85 and 75 are built on Low, as in the original. For buys — the same LWMAs, but on High.
- Weekly trend filter. Buy only if the last closed week closed above EMA 20 on the weekly chart. Sell only if it closed below.
Download the Puria 2.0 template for MetaTrader 4 — puria_2_0.tpl (XAUUSD H1).
Red LWMA 85 and 75 on Low are for sells, green ones on High are for buys, plus a blue EMA 5, MACD 15/26/1 and ATR 14 for the stop. The orange EMA 50 is shown only on H4 and EMA 20 only on the weekly chart: switch the timeframe to check the trend.
Why “mirrored” LWMAs
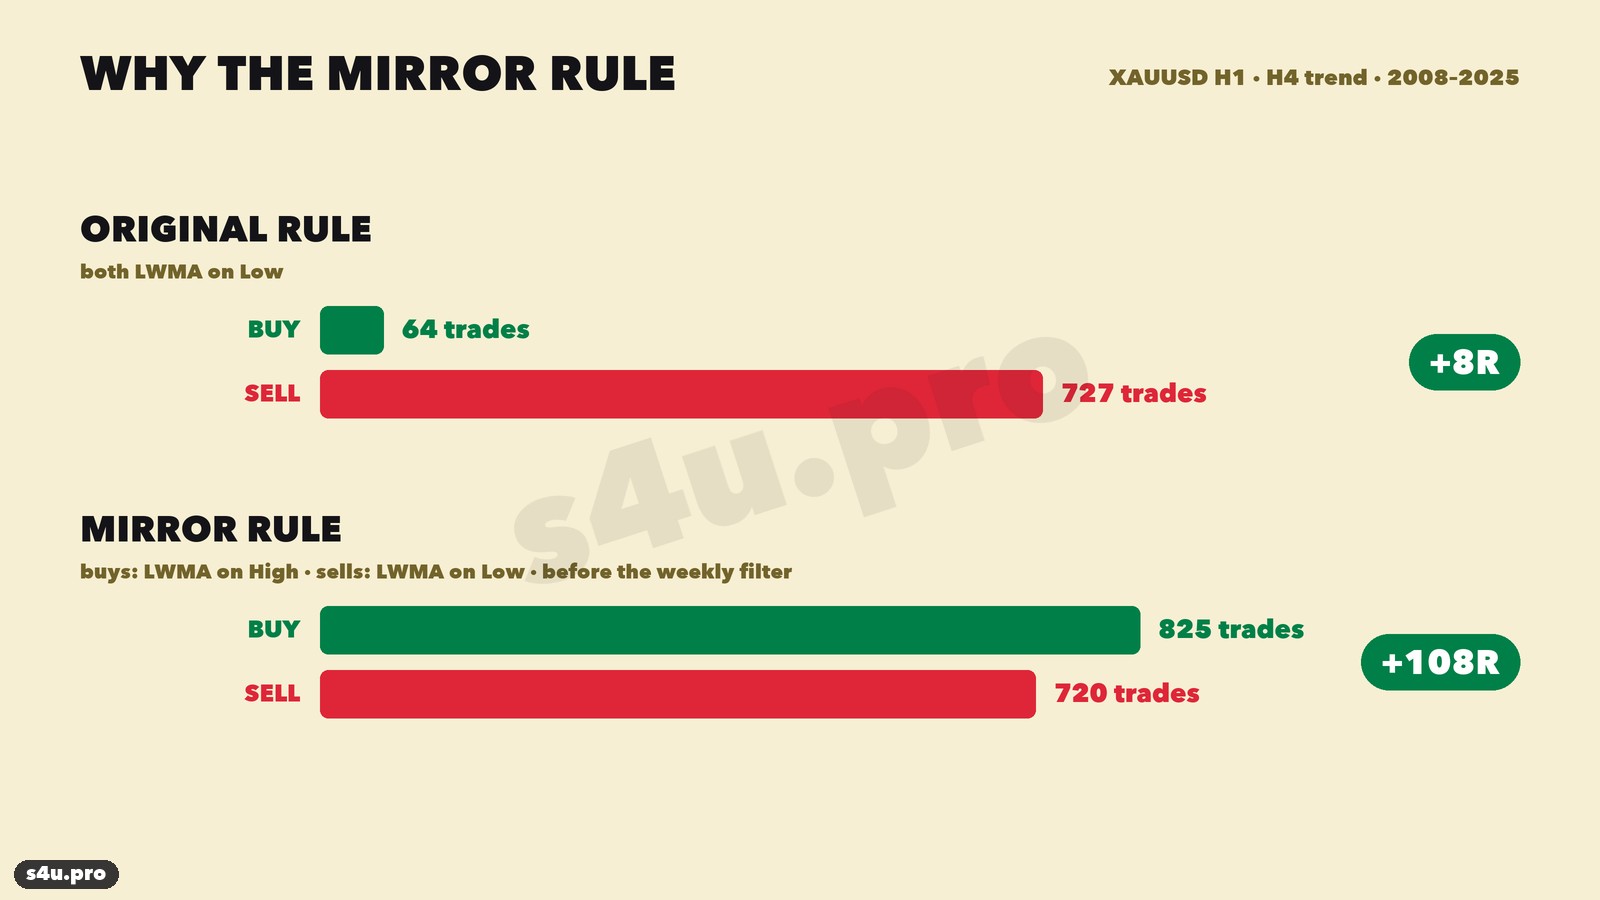
In the original both red lines are built on candle lows (Low). The close is almost always above the low, so EMA 5 crosses these lines upward too early — when MACD is usually still below zero. With the rule “MACD on the same candle” there are almost no buys: on gold over 2008–2025 it is 64 buys versus 727 sells. A strategy that almost only sells is doomed in a rising market.
We simply made the rule symmetrical: for buys EMA 5 must cross LWMAs built on highs (High), just as for sells it crosses LWMAs built on lows. Buys and sells become roughly equal (825 and 720), and the result on gold over 2008–2025 grows from +8R to +108R — even before the weekly filter.
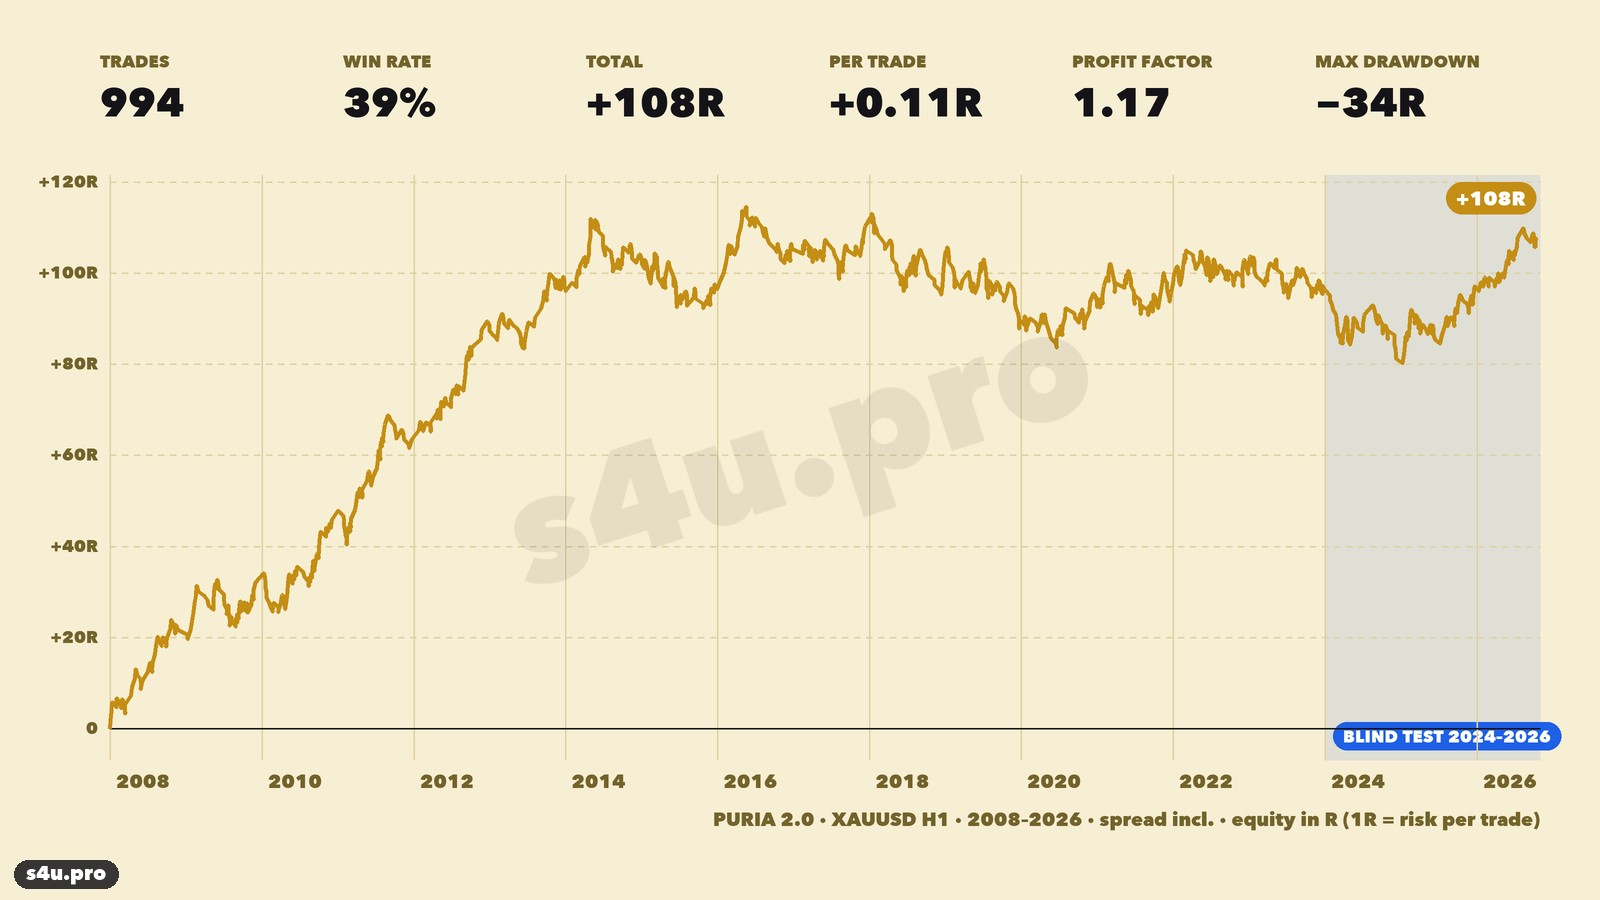
The weekly filter removes trades against the big trend: there are fewer trades (994 instead of 1,600 over 2008–2026), the drawdown falls from −43R to −34R and the profit factor rises from 1.11 to 1.17.
Free EA for MT4 / MT5 + trade journals Get it freeHow we made sure it is not curve fitting
Fitting parameters to history is easy: try a hundred variants and one of them will surely “make money”. So we tested in a way that kept the latest years out of the choice of rules.
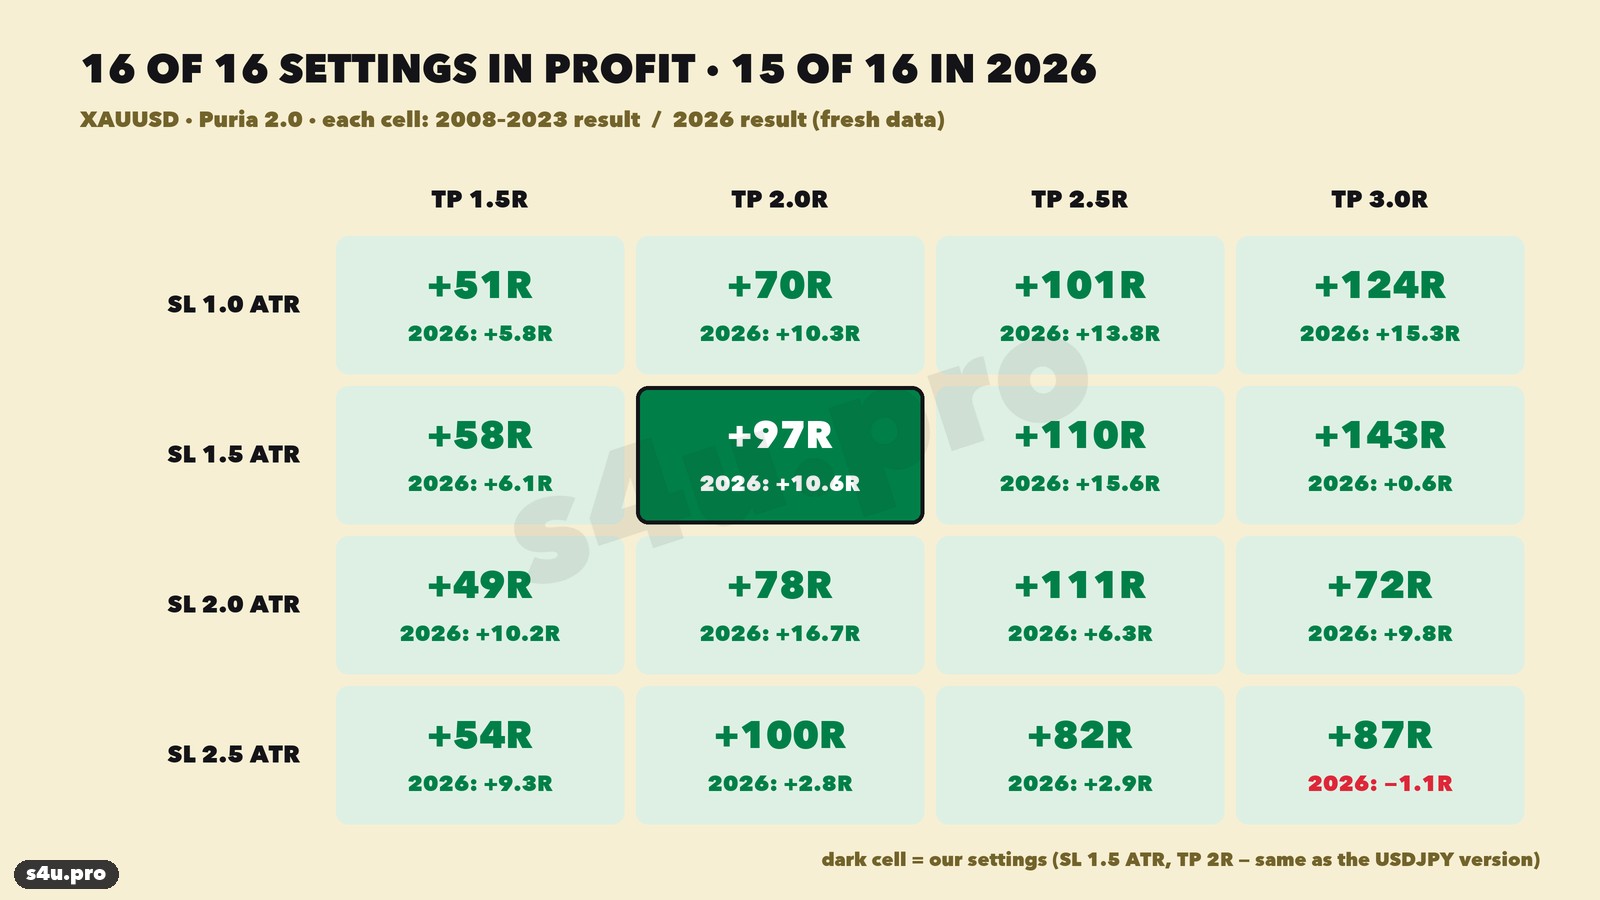
- The rules were chosen on 2008–2023. Stop 1.5 ATR and take profit 2R are the same as in the first improved version for USDJPY; we did not tune them for gold.
- 2024–2026 is a “blind” test. 2024–2025 on Alpari history, 2026 (January–October) on fresh quotes that were not in the main history.
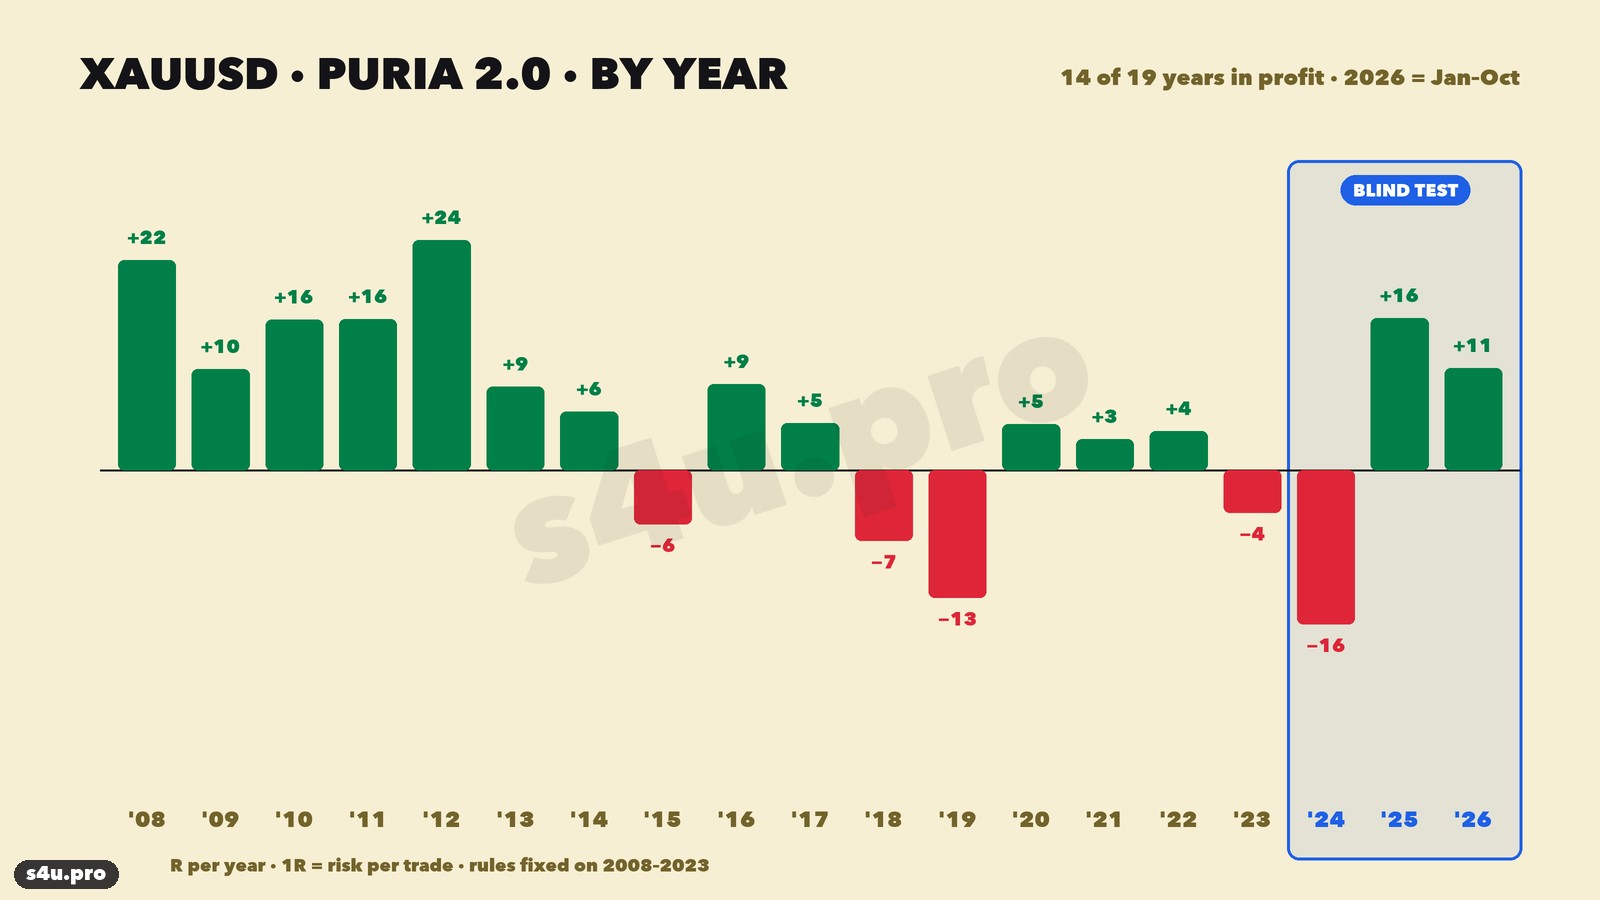
- Blind test result: 2024 −16R, 2025 +15.8R, 2026 +10.6R (40 trades, 17 take profits).
- Neighbouring settings work too. We tested 16 combinations of stop (1–2.5 ATR) and take profit (1.5–3R). All 16 are profitable on 2008–2023, and 15 of 16 are profitable in 2026. So the result does not rest on one “lucky” number.
Statistics: 994 gold trades over 2008–2026
Key numbers
| XAUUSD H1, Puria 2.0 | 2008–2026 | 2008–2023 (rule selection) | 2024–2025 (blind test) | 2026 (blind test) |
|---|---|---|---|---|
| Trades | 994 | 846 | 108 | 40 |
| Winners | 39% | 39% | 34% | 43% |
| Result | +107.7R | +97.3R | −0.2R | +10.6R |
| Profit factor | 1.17 | 1.18 | 1.00 | 1.46 |
| Max drawdown | −34R | −31R | −17R | −4R |
R is the risk of one trade. +107.7R means: if you risk 1% of the account on every trade, the result is about +108% over 19 years without compounding, roughly 5.7% a year. On average +0.11R per trade after the spread. About 50 trades a year — fewer than one a week.
Results by year
14 years out of 19 are profitable. The best year is 2012 (+23.8R), the worst is 2024 (−16R): gold rose all year in a strong trend with sharp short pullbacks, and the strategy kept hitting stops — including 12 in a row. 2025 and 2026 covered this loss.
Buys and sells
Buys made +96.2R (609 trades), sells +11.5R (385 trades). Gold rose for a long time, and most of the profit came from trades with the uptrend. Sells are profitable too, and in 2026 they made more than buys: +8.7R versus +1.9R. We do not recommend switching sells off — that would be fitting to the past.
2026 on gold
| 2026 (January–October), XAUUSD H1 | Value |
|---|---|
| Trades | 40 (16 buys, 24 sells) |
| Take profit hits | 17 (43%) |
| Buys | +1.9R |
| Sells | +8.7R |
| Result | +10.6R, drawdown −4R, no more than 3 stops in a row |
The profit was made over several months, not by one lucky trade. A caveat: the Alpari history ends in December 2025, so 2026 was calculated on gold futures quotes (Yahoo Finance, UTC time). The futures price differs slightly from a broker’s spot price, and H4 and weekly candles are cut by UTC — individual trades at your broker may not match.
What it means in money
Gold has become much more expensive, so the stop in dollars has grown: in 2008 1.5 ATR on H1 was about $6, in 2025 about $16, in 2026 about $35 per ounce. Comparing years in dollars makes no sense, so we count in R and in percent of risk. At 1% risk per trade: 2008–2026 about +108%, 2026 (10 months) about +10.6%.
Puria 2.0 trade examples step by step
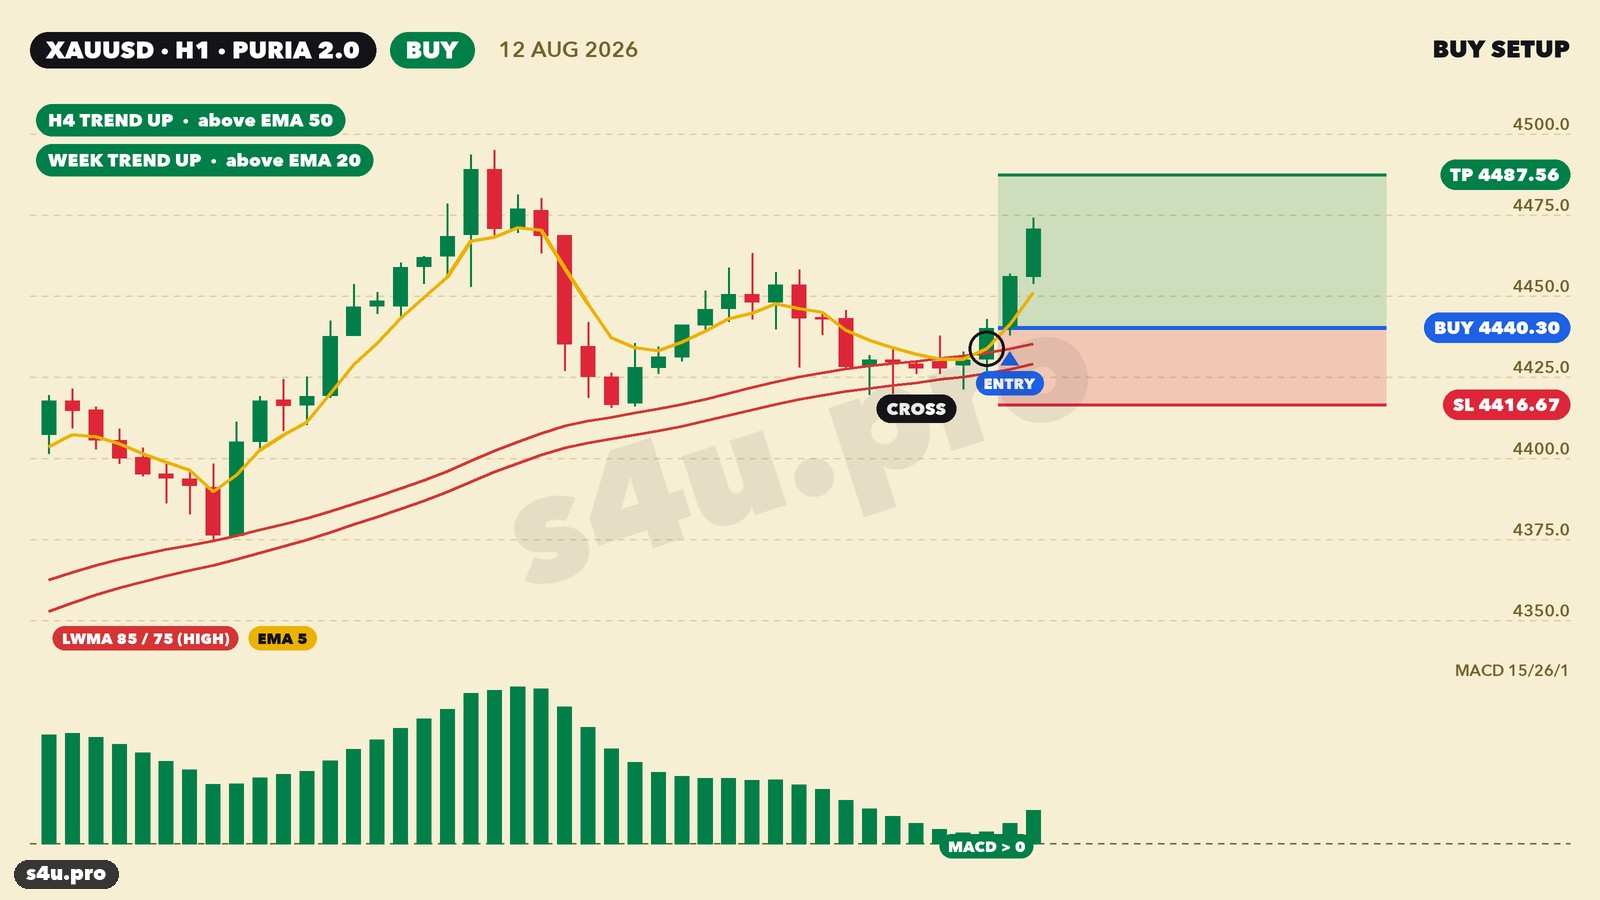
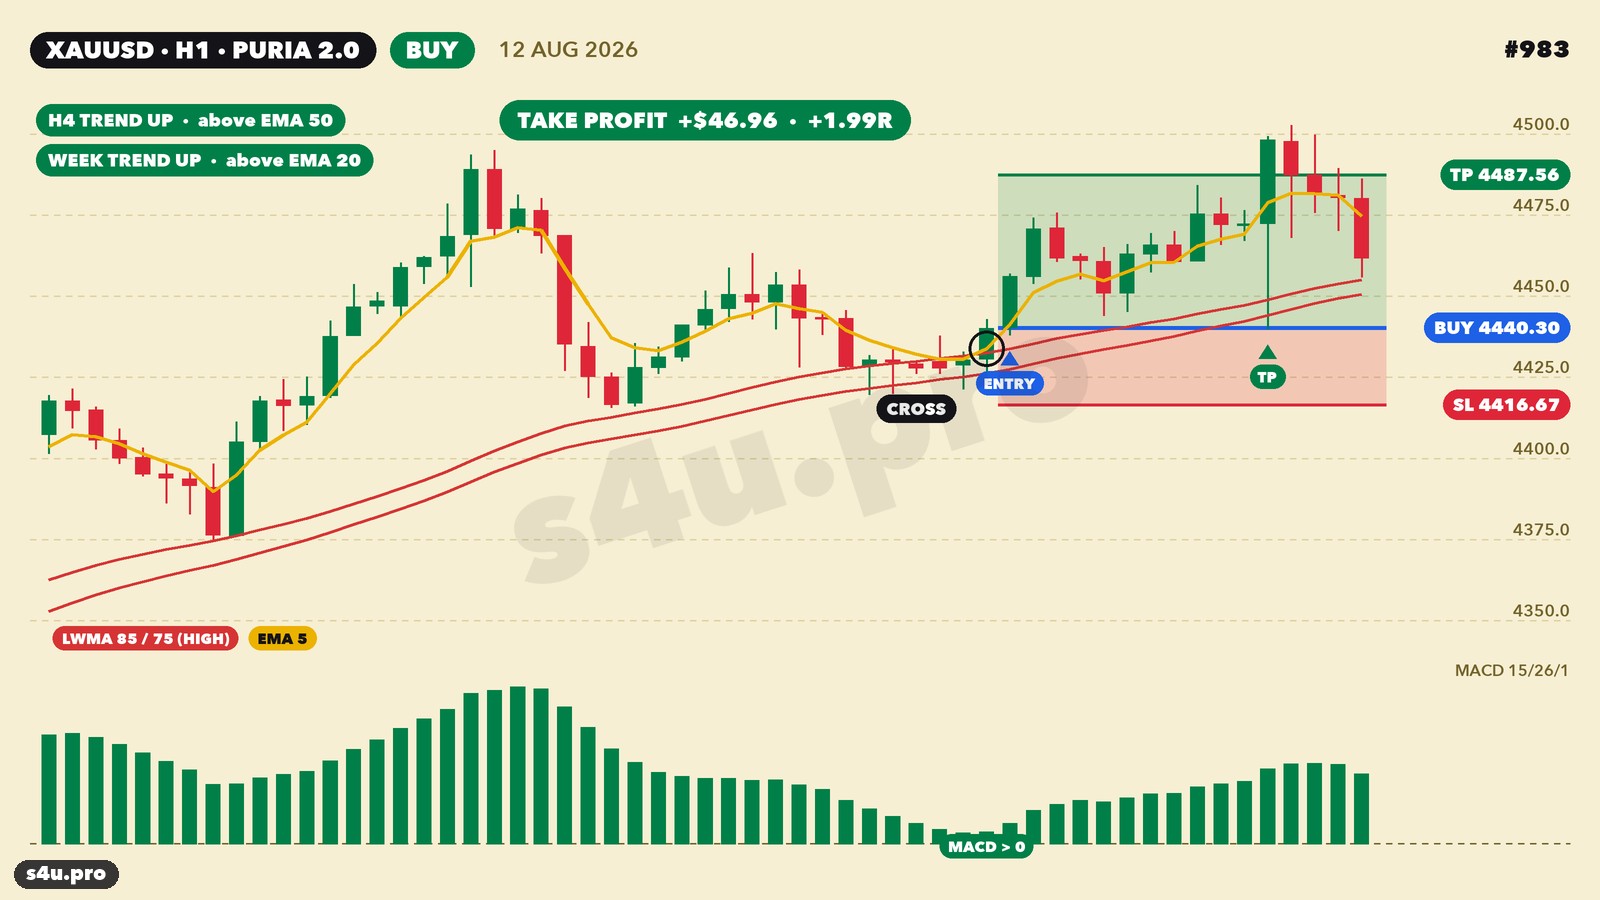
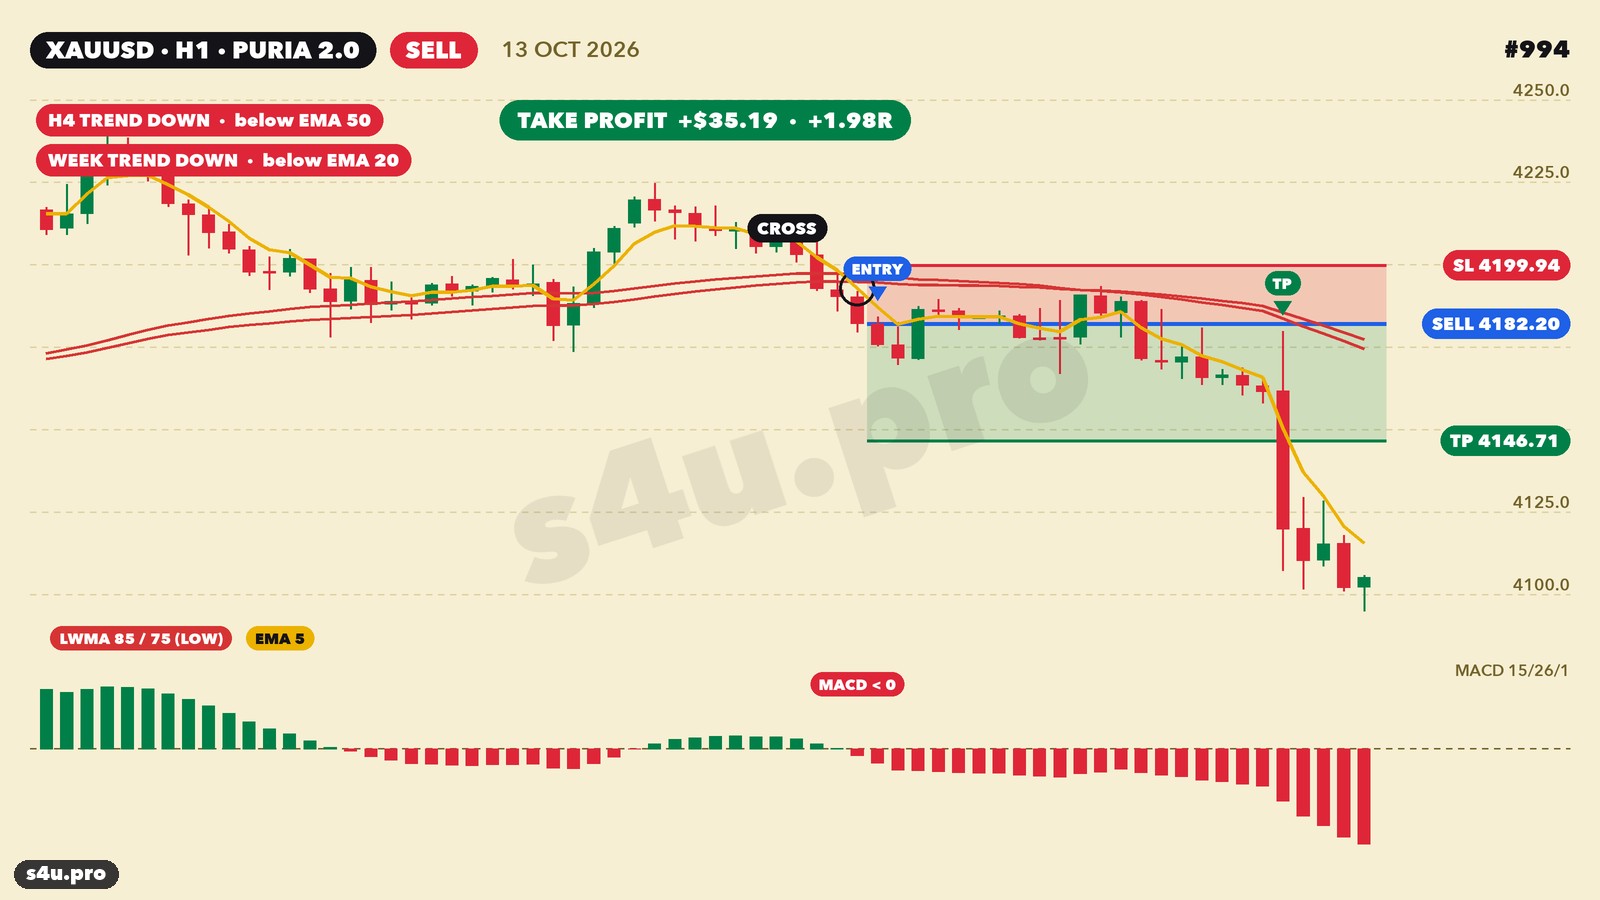
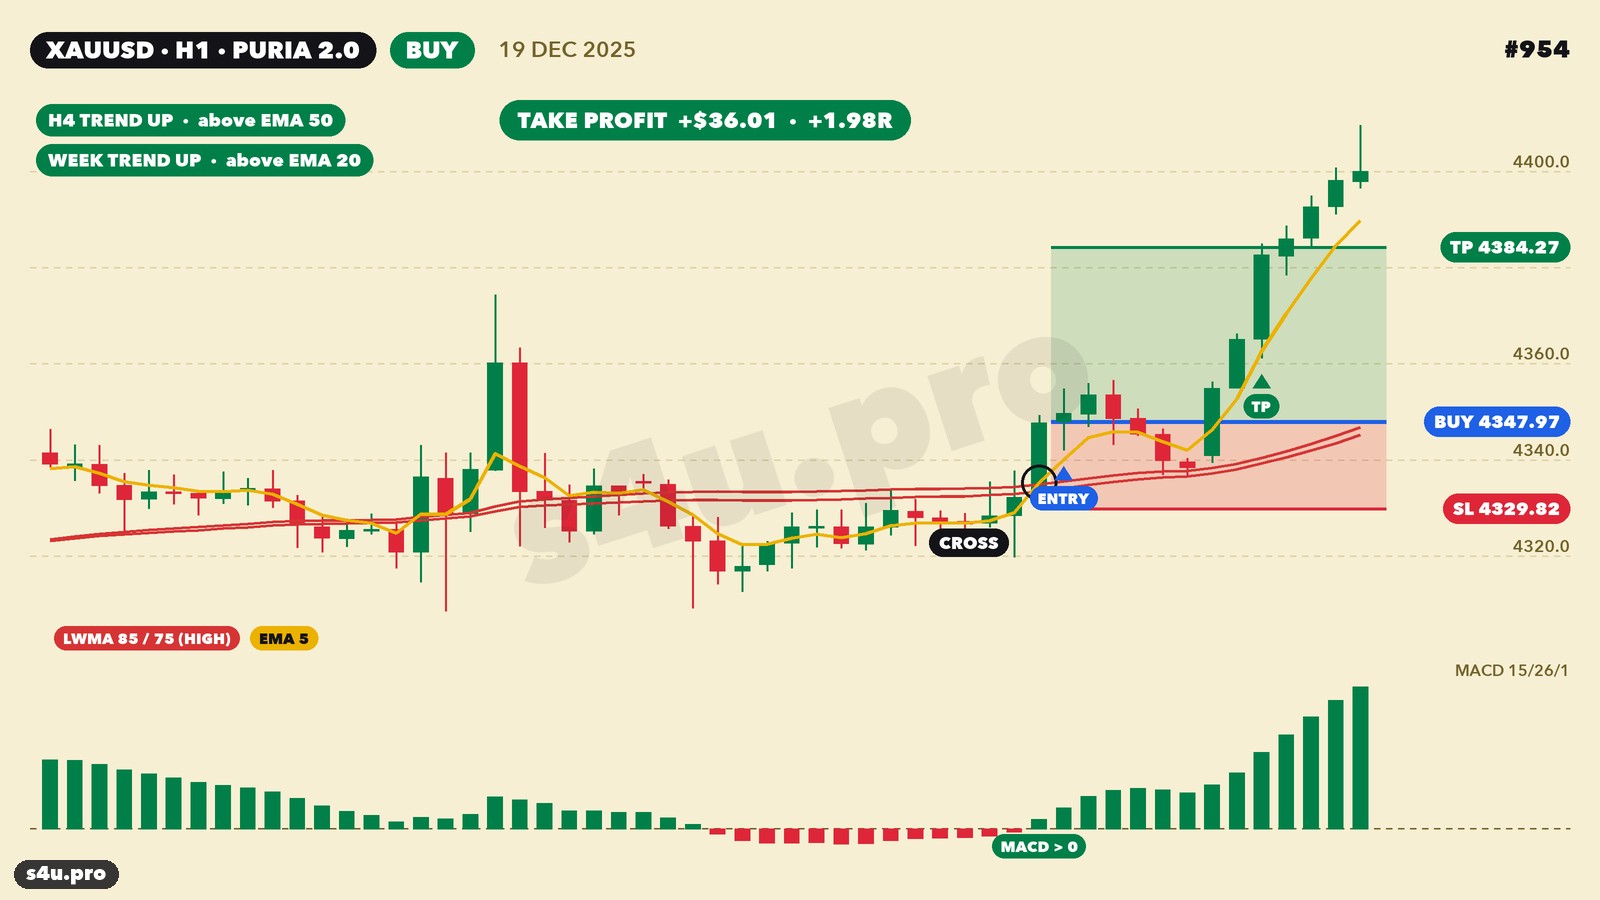
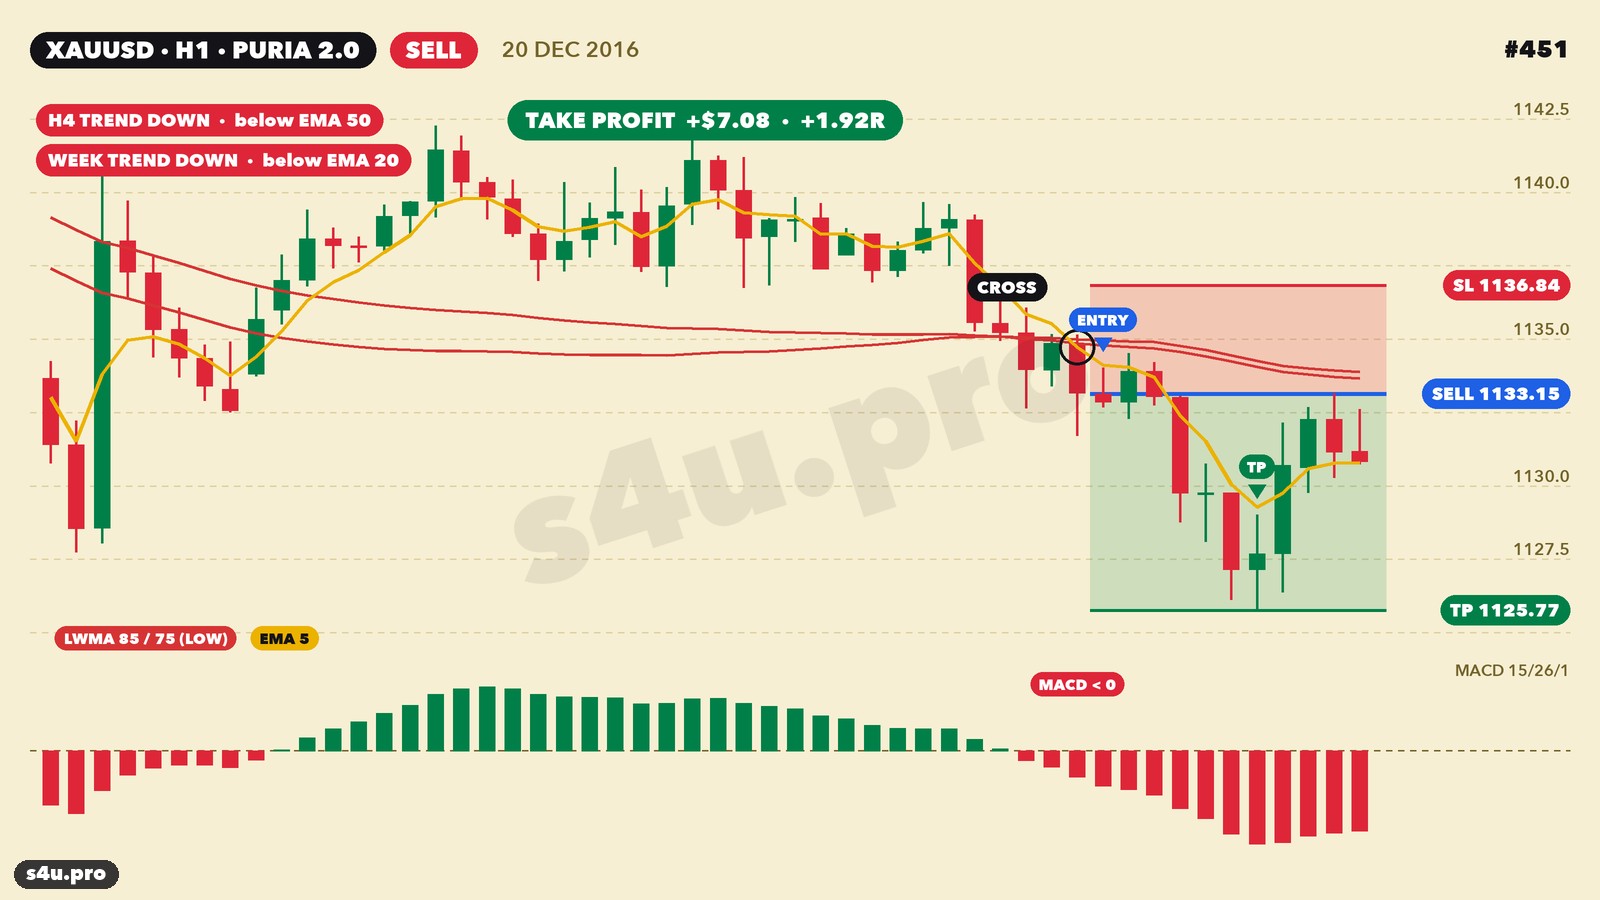
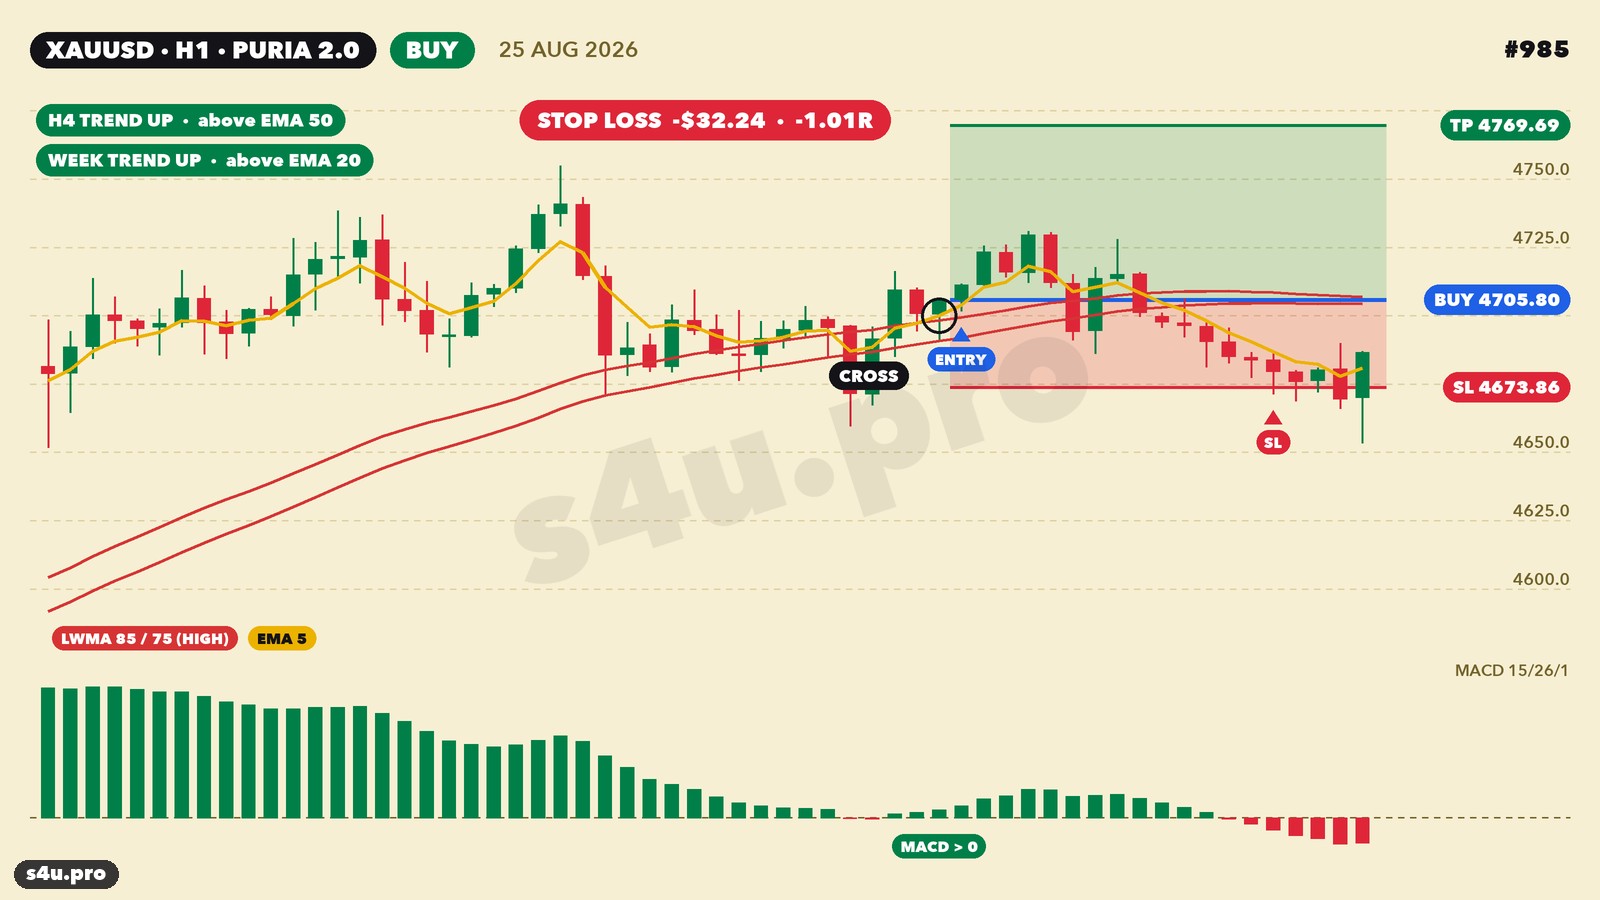
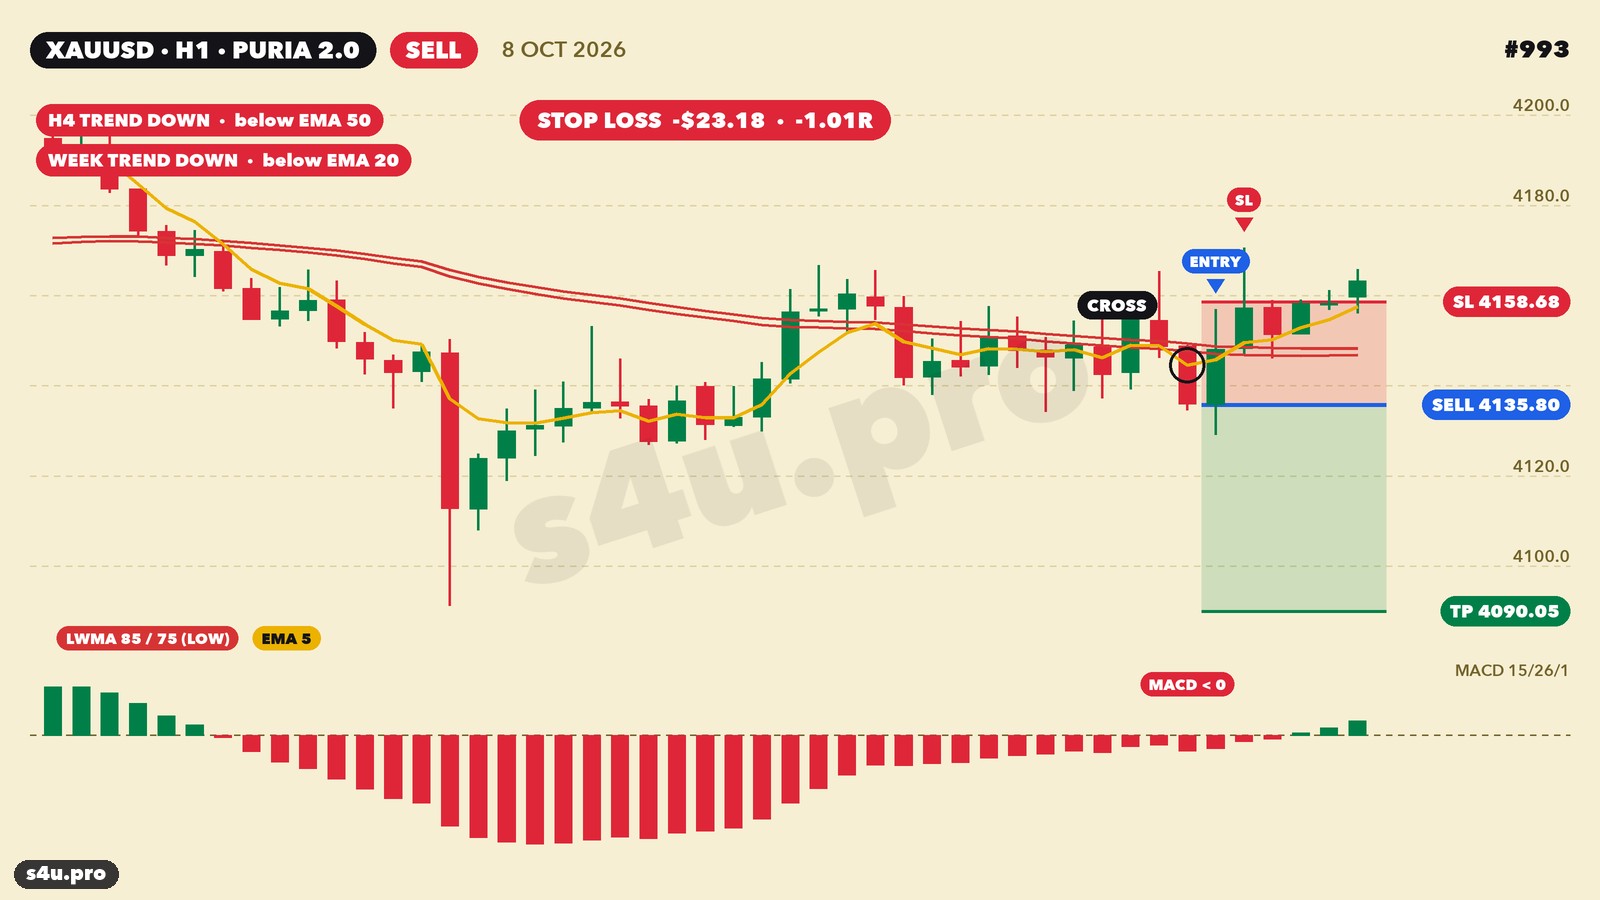
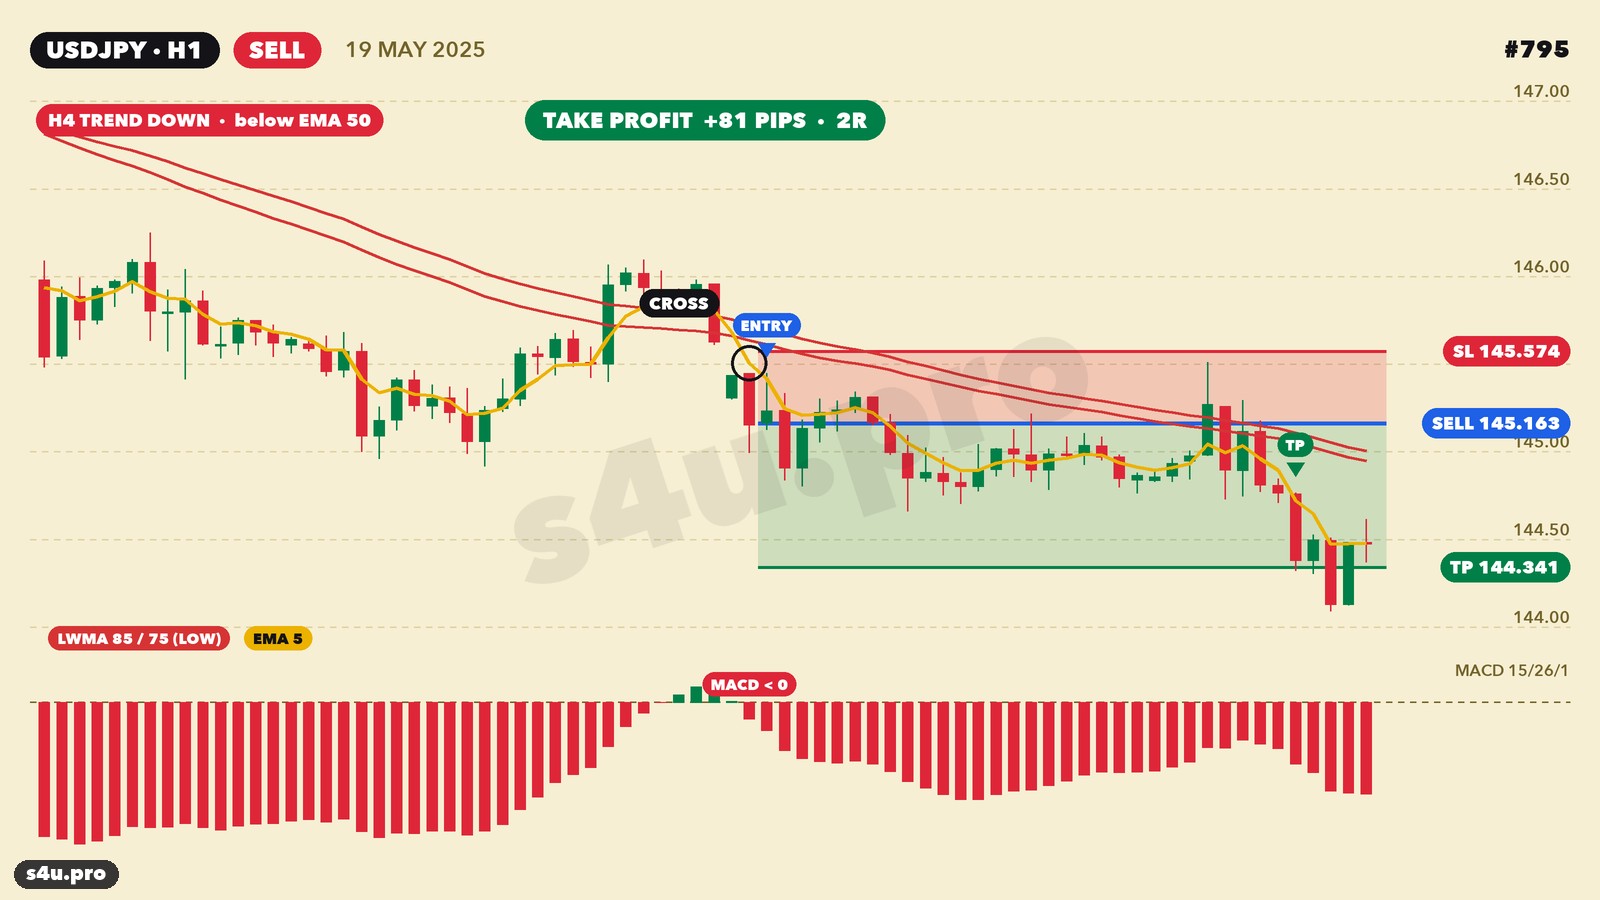
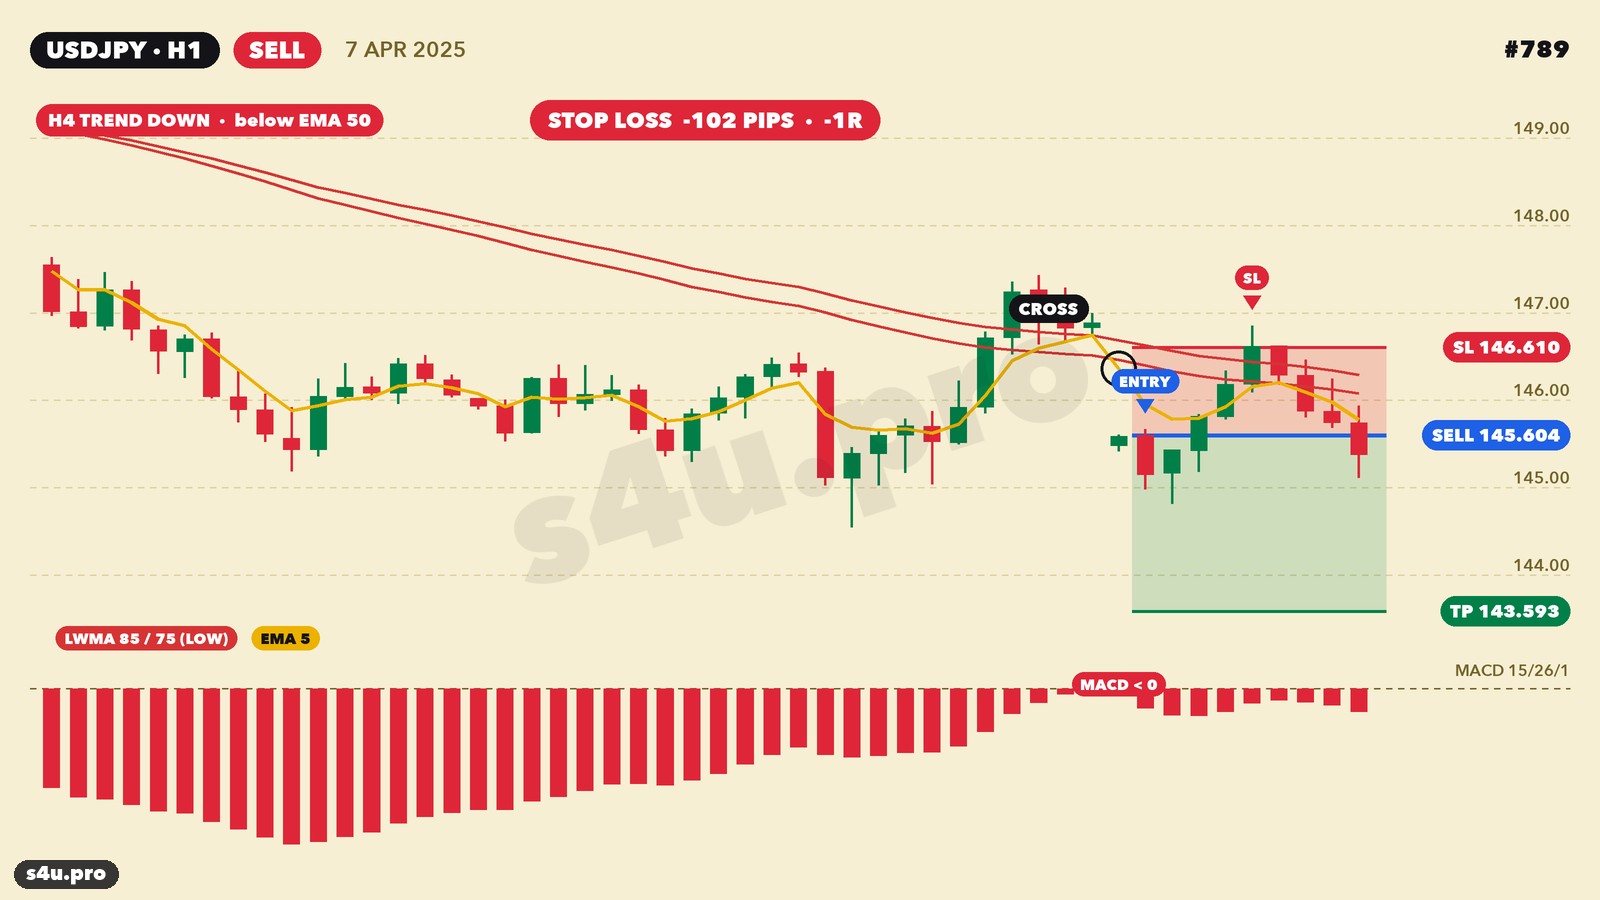
On every chart: the red lines are LWMA 85 and 75 (on High for buys, on Low for sells), the yellow one is EMA 5, the circle is the crossing, MACD is at the bottom. Top left shows the H4 and weekly trend direction. The blue line is the entry, red is the stop, green is the take profit.
Buy: August 2026 — +$47 per ounce
The week and H4 point up. EMA 5 crossed both LWMAs on High from below, MACD is above zero. Stop $24, take profit $47. Price went up right after the entry and closed at the take profit.
Sell: October 2026 — +$35
The week and H4 turned down. EMA 5 crossed the LWMAs on Low from above, MACD is below zero — a sell with the trend, take profit 2R.
Buy: December 2025 — +$36
Sell: December 2016 — +$7
An old trade for comparison: in 2016 gold cost about $1,150 and the stop was only $3.7. The rules are the same — only the size in dollars changes.
And this is what losses look like
August 2026, buy: there was a crossing, but the rise did not continue — price reversed and took the stop.
October 2026, sell: an entry with the downtrend, but price was thrown up above the stop.
Six trades out of ten close at the stop — this is normal for a strategy with a 2R take profit. The profit comes from the 39% where the take profit is twice the stop.
Gallery: all gold trades 2024–2026
Here are all 148 Puria 2.0 trades on gold for the blind test period — no selection, winners and losers alike. 2024–2025 are Alpari quotes, 2026 are GC futures quotes. Filter by result, direction and year, and click a picture to open the chart.
Trade table 2024–2026
| # | Market | Opened | Side | Entry | Stop | Target | Exit | Result | $ per oz | R | Chart |
|---|---|---|---|---|---|---|---|---|---|---|---|
| 847 | XAUUSD | 02.01.24 12:00 | BUY | 2077.04 | 2070.81 | 2089.50 | 2070.81 | SL | -6.53 | -1.05R | |
| 848 | XAUUSD | 23.01.24 08:00 | BUY | 2030.62 | 2025.07 | 2041.72 | 2025.07 | SL | -5.85 | -1.05R | |
| 849 | XAUUSD | 24.01.24 01:00 | BUY | 2029.18 | 2023.08 | 2041.39 | 2023.08 | SL | -6.40 | -1.05R | |
| 850 | XAUUSD | 01.02.24 18:00 | BUY | 2051.77 | 2042.63 | 2070.05 | 2042.63 | SL | -9.44 | -1.03R | |
| 851 | XAUUSD | 06.02.24 21:00 | BUY | 2036.37 | 2029.73 | 2049.65 | 2029.73 | SL | -6.94 | -1.04R | |
| 852 | XAUUSD | 22.02.24 05:00 | BUY | 2027.59 | 2023.22 | 2036.33 | 2023.22 | SL | -4.67 | -1.07R | |
| 853 | XAUUSD | 23.02.24 19:00 | BUY | 2038.23 | 2031.90 | 2050.90 | 2031.90 | SL | -6.63 | -1.05R | |
| 854 | XAUUSD | 27.02.24 04:00 | BUY | 2033.51 | 2029.11 | 2042.31 | 2029.11 | SL | -4.70 | -1.07R | |
| 855 | XAUUSD | 29.02.24 01:00 | BUY | 2035.14 | 2030.58 | 2044.26 | 2030.58 | SL | -4.86 | -1.07R | |
| 856 | XAUUSD | 29.02.24 16:00 | BUY | 2047.43 | 2041.70 | 2058.88 | 2041.70 | SL | -6.03 | -1.05R | |
| 857 | XAUUSD | 13.03.24 21:00 | BUY | 2174.75 | 2167.29 | 2189.67 | 2167.29 | SL | -7.76 | -1.04R | |
| 858 | XAUUSD | 15.03.24 12:00 | BUY | 2171.65 | 2165.97 | 2183.01 | 2165.97 | SL | -5.98 | -1.05R | |
| 859 | XAUUSD | 20.03.24 21:00 | BUY | 2181.82 | 2173.45 | 2198.55 | 2198.55 | TP | +16.43 | +1.96R | |
| 860 | XAUUSD | 22.03.24 03:00 | BUY | 2184.91 | 2175.64 | 2203.46 | 2175.64 | SL | -9.57 | -1.03R | |
| 861 | XAUUSD | 26.03.24 12:00 | BUY | 2190.84 | 2183.25 | 2206.02 | 2183.25 | SL | -7.89 | -1.04R | |
| 862 | XAUUSD | 27.03.24 10:00 | BUY | 2180.40 | 2173.50 | 2194.20 | 2194.20 | TP | +13.50 | +1.96R | |
| 863 | XAUUSD | 05.04.24 17:00 | BUY | 2299.70 | 2287.26 | 2324.58 | 2324.58 | TP | +24.58 | +1.98R | |
| 864 | XAUUSD | 11.04.24 21:00 | BUY | 2356.20 | 2343.31 | 2381.98 | 2381.98 | TP | +25.48 | +1.98R | |
| 865 | XAUUSD | 15.04.24 23:00 | BUY | 2386.08 | 2366.60 | 2425.05 | 2366.60 | SL | -19.78 | -1.01R | |
| 866 | XAUUSD | 16.04.24 19:00 | BUY | 2385.85 | 2369.48 | 2418.58 | 2369.48 | SL | -16.67 | -1.02R | |
| 867 | XAUUSD | 18.04.24 20:00 | BUY | 2387.79 | 2375.75 | 2411.87 | 2375.75 | SL | -12.34 | -1.02R | |
| 868 | XAUUSD | 19.04.24 05:00 | BUY | 2409.19 | 2395.56 | 2436.46 | 2395.56 | SL | -13.93 | -1.02R | |
| 869 | XAUUSD | 19.04.24 19:00 | BUY | 2394.75 | 2380.03 | 2424.18 | 2380.03 | SL | -15.02 | -1.02R | |
| 870 | XAUUSD | 29.04.24 20:00 | BUY | 2342.90 | 2332.10 | 2364.49 | 2332.10 | SL | -11.10 | -1.03R | |
| 871 | XAUUSD | 09.05.24 17:00 | BUY | 2324.11 | 2314.85 | 2342.64 | 2342.64 | TP | +18.23 | +1.97R | |
| 872 | XAUUSD | 14.05.24 21:00 | BUY | 2355.68 | 2346.42 | 2374.20 | 2374.20 | TP | +18.22 | +1.97R | |
| 873 | XAUUSD | 17.05.24 10:00 | BUY | 2385.81 | 2378.61 | 2400.21 | 2400.21 | TP | +14.10 | +1.96R | |
| 874 | XAUUSD | 31.05.24 16:00 | BUY | 2354.77 | 2346.49 | 2371.34 | 2346.49 | SL | -8.58 | -1.04R | |
| 875 | XAUUSD | 03.06.24 20:00 | BUY | 2349.09 | 2338.65 | 2369.98 | 2338.65 | SL | -10.74 | -1.03R | |
| 876 | XAUUSD | 02.07.24 11:00 | BUY | 2330.87 | 2324.01 | 2344.59 | 2324.01 | SL | -7.16 | -1.04R | |
| 877 | XAUUSD | 03.07.24 08:00 | BUY | 2334.48 | 2327.97 | 2347.50 | 2347.50 | TP | +12.72 | +1.95R | |
| 878 | XAUUSD | 10.07.24 11:00 | BUY | 2372.65 | 2365.99 | 2385.97 | 2385.97 | TP | +13.02 | +1.96R | |
| 879 | XAUUSD | 16.08.24 13:00 | BUY | 2463.34 | 2455.08 | 2479.85 | 2479.85 | TP | +16.21 | +1.96R | |
| 880 | XAUUSD | 23.08.24 19:00 | BUY | 2510.00 | 2499.98 | 2530.03 | 2499.98 | SL | -10.31 | -1.03R | |
| 881 | XAUUSD | 29.08.24 09:00 | BUY | 2518.77 | 2511.28 | 2533.76 | 2511.28 | SL | -7.79 | -1.04R | |
| 882 | XAUUSD | 30.08.24 12:00 | BUY | 2522.95 | 2514.95 | 2538.94 | 2514.95 | SL | -8.30 | -1.04R | |
| 883 | XAUUSD | 10.09.24 16:00 | BUY | 2514.03 | 2506.94 | 2528.22 | 2506.94 | SL | -7.39 | -1.04R | |
| 884 | XAUUSD | 12.09.24 08:00 | BUY | 2517.18 | 2510.76 | 2530.03 | 2530.03 | TP | +12.55 | +1.95R | |
| 885 | XAUUSD | 19.09.24 12:00 | BUY | 2584.93 | 2573.05 | 2608.68 | 2573.05 | SL | -12.18 | -1.02R | |
| 886 | XAUUSD | 01.10.24 17:00 | BUY | 2667.00 | 2657.23 | 2686.53 | 2657.23 | SL | -10.07 | -1.03R | |
| 887 | XAUUSD | 03.10.24 01:00 | BUY | 2657.97 | 2648.34 | 2677.23 | 2648.34 | SL | -9.93 | -1.03R | |
| 888 | XAUUSD | 04.10.24 05:00 | BUY | 2658.31 | 2650.34 | 2674.24 | 2650.34 | SL | -8.27 | -1.04R | |
| 889 | XAUUSD | 15.10.24 19:00 | BUY | 2664.70 | 2654.58 | 2684.94 | 2684.94 | TP | +19.93 | +1.97R | |
| 890 | XAUUSD | 24.10.24 16:00 | BUY | 2739.09 | 2731.07 | 2755.13 | 2731.07 | SL | -8.32 | -1.04R | |
| 891 | XAUUSD | 25.10.24 20:00 | BUY | 2739.19 | 2729.76 | 2758.05 | 2729.76 | SL | -9.73 | -1.03R | |
| 892 | XAUUSD | 28.10.24 09:00 | BUY | 2740.73 | 2731.36 | 2759.47 | 2731.36 | SL | -9.67 | -1.03R | |
| 893 | XAUUSD | 28.10.24 16:00 | BUY | 2740.85 | 2731.24 | 2760.08 | 2760.08 | TP | +18.93 | +1.97R | |
| 894 | XAUUSD | 27.11.24 16:00 | BUY | 2656.20 | 2645.27 | 2678.06 | 2645.27 | SL | -11.23 | -1.03R | |
| 895 | XAUUSD | 28.11.24 13:00 | BUY | 2647.59 | 2637.92 | 2666.92 | 2637.92 | SL | -9.97 | -1.03R | |
| 896 | XAUUSD | 29.11.24 05:00 | BUY | 2657.43 | 2647.71 | 2676.87 | 2647.71 | SL | -10.02 | -1.03R | |
| 897 | XAUUSD | 04.12.24 08:00 | BUY | 2649.79 | 2641.41 | 2666.56 | 2641.41 | SL | -8.68 | -1.04R | |
| 898 | XAUUSD | 04.12.24 18:00 | BUY | 2655.06 | 2644.79 | 2675.61 | 2644.79 | SL | -10.57 | -1.03R | |
| 899 | XAUUSD | 05.12.24 08:00 | BUY | 2653.05 | 2644.44 | 2670.27 | 2644.44 | SL | -8.91 | -1.03R | |
| 900 | XAUUSD | 07.01.25 15:00 | BUY | 2651.39 | 2643.03 | 2668.10 | 2643.03 | SL | -8.65 | -1.04R | |
| 901 | XAUUSD | 15.01.25 09:00 | BUY | 2681.07 | 2673.75 | 2695.71 | 2695.71 | TP | +14.34 | +1.96R | |
| 902 | XAUUSD | 21.01.25 04:00 | BUY | 2718.09 | 2707.81 | 2738.65 | 2738.65 | TP | +20.25 | +1.97R | |
| 903 | XAUUSD | 23.01.25 20:00 | BUY | 2757.75 | 2747.89 | 2777.47 | 2777.47 | TP | +19.42 | +1.97R | |
| 904 | XAUUSD | 28.01.25 21:00 | BUY | 2762.19 | 2754.44 | 2777.69 | 2754.44 | SL | -8.05 | -1.04R | |
| 905 | XAUUSD | 30.01.25 03:00 | BUY | 2762.06 | 2754.32 | 2777.53 | 2777.53 | TP | +15.17 | +1.96R | |
| 906 | XAUUSD | 07.02.25 05:00 | BUY | 2868.76 | 2858.87 | 2888.54 | 2858.87 | SL | -10.19 | -1.03R | |
| 907 | XAUUSD | 10.02.25 04:00 | BUY | 2871.97 | 2860.16 | 2895.59 | 2895.59 | TP | +23.32 | +1.98R | |
| 908 | XAUUSD | 13.02.25 02:00 | BUY | 2905.80 | 2893.52 | 2930.36 | 2930.36 | TP | +24.27 | +1.98R | |
| 909 | XAUUSD | 18.02.25 11:00 | BUY | 2912.41 | 2903.30 | 2930.63 | 2930.63 | TP | +17.92 | +1.97R | |
| 910 | XAUUSD | 24.02.25 11:00 | BUY | 2946.32 | 2934.27 | 2970.42 | 2934.27 | SL | -12.35 | -1.02R | |
| 911 | XAUUSD | 07.03.25 12:00 | BUY | 2921.55 | 2910.77 | 2943.11 | 2910.77 | SL | -11.08 | -1.03R | |
| 912 | XAUUSD | 07.03.25 17:00 | BUY | 2926.84 | 2913.77 | 2952.97 | 2913.77 | SL | -13.37 | -1.02R | |
| 913 | XAUUSD | 11.03.25 14:00 | BUY | 2913.56 | 2902.83 | 2935.01 | 2935.01 | TP | +21.15 | +1.97R | |
| 914 | XAUUSD | 20.03.25 21:00 | BUY | 3043.30 | 3032.08 | 3065.74 | 3032.08 | SL | -11.52 | -1.03R | |
| 915 | XAUUSD | 26.03.25 10:00 | BUY | 3030.46 | 3021.74 | 3047.90 | 3021.74 | SL | -9.02 | -1.03R | |
| 916 | XAUUSD | 26.03.25 14:00 | BUY | 3027.69 | 3018.29 | 3046.49 | 3018.29 | SL | -9.70 | -1.03R | |
| 917 | XAUUSD | 27.03.25 05:00 | BUY | 3031.61 | 3023.09 | 3048.64 | 3048.64 | TP | +16.73 | +1.97R | |
| 918 | XAUUSD | 02.04.25 05:00 | BUY | 3133.02 | 3118.90 | 3161.25 | 3118.90 | SL | -14.42 | -1.02R | |
| 919 | XAUUSD | 02.04.25 12:00 | BUY | 3131.39 | 3117.13 | 3159.91 | 3117.13 | SL | -14.56 | -1.02R | |
| 920 | XAUUSD | 03.04.25 02:00 | BUY | 3145.83 | 3126.97 | 3183.55 | 3126.97 | SL | -19.16 | -1.02R | |
| 921 | XAUUSD | 15.04.25 06:00 | BUY | 3224.20 | 3206.81 | 3258.97 | 3258.97 | TP | +34.47 | +1.98R | |
| 922 | XAUUSD | 28.04.25 20:00 | BUY | 3336.78 | 3311.36 | 3387.61 | 3311.36 | SL | -25.72 | -1.01R | |
| 923 | XAUUSD | 08.05.25 05:00 | BUY | 3408.69 | 3385.18 | 3455.71 | 3385.18 | SL | -23.81 | -1.01R | |
| 924 | XAUUSD | 23.05.25 09:00 | BUY | 3323.99 | 3304.90 | 3362.18 | 3362.18 | TP | +37.89 | +1.98R | |
| 925 | XAUUSD | 26.05.25 19:00 | BUY | 3337.81 | 3324.10 | 3365.22 | 3324.10 | SL | -14.01 | -1.02R | |
| 926 | XAUUSD | 29.05.25 19:00 | BUY | 3321.48 | 3302.09 | 3360.27 | 3302.09 | SL | -19.69 | -1.01R | |
| 927 | XAUUSD | 02.06.25 04:00 | BUY | 3311.20 | 3293.51 | 3346.58 | 3346.58 | TP | +35.08 | +1.98R | |
| 928 | XAUUSD | 04.06.25 12:00 | BUY | 3363.03 | 3347.75 | 3393.60 | 3347.75 | SL | -15.58 | -1.02R | |
| 929 | XAUUSD | 04.06.25 18:00 | BUY | 3377.50 | 3358.93 | 3414.65 | 3358.93 | SL | -18.87 | -1.02R | |
| 930 | XAUUSD | 10.06.25 17:00 | BUY | 3343.79 | 3329.22 | 3372.94 | 3329.22 | SL | -14.87 | -1.02R | |
| 931 | XAUUSD | 08.07.25 02:00 | BUY | 3339.88 | 3327.68 | 3364.28 | 3327.68 | SL | -12.50 | -1.02R | |
| 932 | XAUUSD | 18.07.25 12:00 | BUY | 3347.63 | 3336.98 | 3368.93 | 3368.93 | TP | +21.00 | +1.97R | |
| 933 | XAUUSD | 01.08.25 16:00 | BUY | 3341.11 | 3325.18 | 3372.96 | 3372.96 | TP | +31.55 | +1.98R | |
| 934 | XAUUSD | 07.08.25 06:00 | BUY | 3379.43 | 3368.56 | 3401.17 | 3401.17 | TP | +21.44 | +1.97R | |
| 935 | XAUUSD | 08.08.25 22:00 | BUY | 3395.62 | 3376.21 | 3434.44 | 3376.21 | SL | -19.71 | -1.01R | |
| 936 | XAUUSD | 14.08.25 04:00 | BUY | 3369.29 | 3358.36 | 3391.14 | 3358.36 | SL | -11.22 | -1.03R | |
| 937 | XAUUSD | 27.08.25 18:00 | BUY | 3386.32 | 3376.39 | 3406.18 | 3406.18 | TP | +19.56 | +1.97R | |
| 938 | XAUUSD | 10.09.25 06:00 | BUY | 3636.04 | 3619.56 | 3669.00 | 3619.56 | SL | -16.78 | -1.02R | |
| 939 | XAUUSD | 12.09.25 07:00 | BUY | 3652.85 | 3640.32 | 3677.92 | 3640.32 | SL | -12.83 | -1.02R | |
| 940 | XAUUSD | 15.09.25 17:00 | BUY | 3657.24 | 3644.80 | 3682.12 | 3682.12 | TP | +24.58 | +1.98R | |
| 941 | XAUUSD | 19.09.25 21:00 | BUY | 3678.80 | 3663.90 | 3708.61 | 3708.61 | TP | +29.51 | +1.98R | |
| 942 | XAUUSD | 26.09.25 18:00 | BUY | 3778.77 | 3761.37 | 3813.57 | 3761.37 | SL | -17.70 | -1.02R | |
| 943 | XAUUSD | 03.10.25 17:00 | BUY | 3883.31 | 3865.80 | 3918.33 | 3918.33 | TP | +34.72 | +1.98R | |
| 944 | XAUUSD | 13.10.25 02:00 | BUY | 4042.09 | 4010.44 | 4105.40 | 4105.40 | TP | +63.01 | +1.99R | |
| 945 | XAUUSD | 20.10.25 17:00 | BUY | 4300.48 | 4259.23 | 4382.98 | 4259.23 | SL | -41.55 | -1.01R | |
| 946 | XAUUSD | 14.11.25 05:00 | BUY | 4206.96 | 4177.19 | 4266.50 | 4177.19 | SL | -30.07 | -1.01R | |
| 947 | XAUUSD | 19.11.25 08:00 | BUY | 4095.39 | 4068.87 | 4148.43 | 4068.87 | SL | -26.82 | -1.01R | |
| 948 | XAUUSD | 21.11.25 21:00 | BUY | 4082.81 | 4050.02 | 4148.39 | 4050.02 | SL | -33.09 | -1.01R | |
| 949 | XAUUSD | 27.11.25 10:00 | BUY | 4160.02 | 4142.84 | 4194.39 | 4194.39 | TP | +34.07 | +1.98R | |
| 950 | XAUUSD | 05.12.25 08:00 | BUY | 4220.71 | 4204.54 | 4253.04 | 4253.04 | TP | +32.03 | +1.98R | |
| 951 | XAUUSD | 09.12.25 22:00 | BUY | 4212.13 | 4194.02 | 4248.36 | 4194.02 | SL | -18.41 | -1.02R | |
| 952 | XAUUSD | 10.12.25 23:00 | BUY | 4229.66 | 4210.08 | 4268.82 | 4210.08 | SL | -19.88 | -1.01R | |
| 953 | XAUUSD | 17.12.25 04:00 | BUY | 4326.52 | 4305.57 | 4368.42 | 4368.42 | TP | +41.60 | +1.99R | |
| 954 | XAUUSD | 19.12.25 18:00 | BUY | 4347.97 | 4329.82 | 4384.27 | 4384.27 | TP | +36.01 | +1.98R | |
| 955 | XAUUSD | 08.01.26 23:00 | BUY | 4489.30 | 4465.23 | 4537.45 | 4465.23 | SL | -24.37 | -1.01R | |
| 956 | XAUUSD | 20.01.26 06:00 | BUY | 4720.70 | 4682.37 | 4797.35 | 4797.35 | TP | +76.35 | +1.99R | |
| 957 | XAUUSD | 29.01.26 23:00 | BUY | 5410.00 | 5290.67 | 5648.66 | 5290.67 | SL | -119.63 | -1.00R | |
| 958 | XAUUSD | 06.02.26 16:00 | BUY | 4967.80 | 4888.65 | 5126.09 | 5126.09 | TP | +157.99 | +2.00R | |
| 959 | XAUUSD | 18.02.26 16:00 | BUY | 5018.90 | 4982.33 | 5092.04 | 4982.33 | SL | -36.87 | -1.01R | |
| 960 | XAUUSD | 25.02.26 04:00 | BUY | 5200.10 | 5160.52 | 5279.26 | 5160.52 | SL | -39.88 | -1.01R | |
| 961 | XAUUSD | 27.02.26 14:00 | BUY | 5240.80 | 5210.59 | 5301.22 | 5301.22 | TP | +60.12 | +1.99R | |
| 962 | XAUUSD | 24.03.26 13:00 | SELL | 4379.00 | 4468.94 | 4199.12 | 4468.94 | SL | -90.24 | -1.00R | |
| 963 | XAUUSD | 26.03.26 09:00 | SELL | 4425.40 | 4482.01 | 4312.17 | 4482.01 | SL | -56.91 | -1.00R | |
| 964 | XAUUSD | 07.04.26 22:00 | BUY | 4747.20 | 4700.66 | 4840.28 | 4840.28 | TP | +92.78 | +1.99R | |
| 965 | XAUUSD | 09.04.26 14:00 | BUY | 4790.00 | 4752.02 | 4865.95 | 4752.02 | SL | -38.28 | -1.01R | |
| 966 | XAUUSD | 14.04.26 01:00 | BUY | 4792.70 | 4761.50 | 4855.09 | 4855.09 | TP | +62.09 | +1.99R | |
| 967 | XAUUSD | 16.04.26 00:00 | BUY | 4845.40 | 4818.59 | 4899.02 | 4818.59 | SL | -27.11 | -1.01R | |
| 968 | XAUUSD | 17.04.26 14:00 | BUY | 4903.30 | 4870.86 | 4968.18 | 4870.86 | SL | -32.74 | -1.01R | |
| 969 | XAUUSD | 04.05.26 09:00 | SELL | 4587.90 | 4615.70 | 4532.30 | 4532.30 | TP | +55.30 | +1.99R | |
| 970 | XAUUSD | 11.05.26 16:00 | BUY | 4742.00 | 4708.03 | 4809.93 | 4708.03 | SL | -34.27 | -1.01R | |
| 971 | XAUUSD | 19.05.26 03:00 | SELL | 4549.90 | 4581.76 | 4486.17 | 4486.17 | TP | +63.43 | +1.99R | |
| 972 | XAUUSD | 26.05.26 17:00 | SELL | 4504.90 | 4531.91 | 4450.88 | 4450.88 | TP | +53.72 | +1.99R | |
| 973 | XAUUSD | 01.06.26 14:00 | SELL | 4479.10 | 4509.37 | 4418.56 | 4509.37 | SL | -30.57 | -1.01R | |
| 974 | XAUUSD | 02.06.26 18:00 | SELL | 4514.30 | 4538.09 | 4466.71 | 4466.71 | TP | +47.29 | +1.99R | |
| 975 | XAUUSD | 05.06.26 02:00 | SELL | 4473.40 | 4499.05 | 4422.11 | 4499.05 | SL | -25.95 | -1.01R | |
| 976 | XAUUSD | 05.06.26 13:00 | SELL | 4432.00 | 4460.88 | 4374.24 | 4374.24 | TP | +57.46 | +1.99R | |
| 977 | XAUUSD | 17.06.26 20:00 | SELL | 4254.20 | 4294.72 | 4173.16 | 4294.72 | SL | -40.82 | -1.01R | |
| 978 | XAUUSD | 26.06.26 03:00 | SELL | 4005.90 | 4039.67 | 3938.37 | 4039.67 | SL | -34.07 | -1.01R | |
| 979 | XAUUSD | 29.06.26 18:00 | SELL | 4035.70 | 4063.79 | 3979.52 | 3979.52 | TP | +55.88 | +1.99R | |
| 980 | XAUUSD | 30.06.26 23:00 | SELL | 4026.50 | 4053.33 | 3972.85 | 4053.33 | SL | -27.13 | -1.01R | |
| 981 | XAUUSD | 12.07.26 23:00 | SELL | 4084.00 | 4108.10 | 4035.81 | 4035.81 | TP | +47.89 | +1.99R | |
| 982 | XAUUSD | 16.07.26 06:00 | SELL | 4032.40 | 4055.87 | 3985.46 | 3985.46 | TP | +46.64 | +1.99R | |
| 983 | XAUUSD | 12.08.26 01:00 | BUY | 4440.30 | 4416.67 | 4487.56 | 4487.56 | TP | +46.96 | +1.99R | |
| 984 | XAUUSD | 17.08.26 01:00 | BUY | 4457.10 | 4432.85 | 4505.59 | 4432.85 | SL | -24.55 | -1.01R | |
| 985 | XAUUSD | 25.08.26 18:00 | BUY | 4705.80 | 4673.86 | 4769.69 | 4673.86 | SL | -32.24 | -1.01R | |
| 986 | XAUUSD | 16.09.26 22:00 | SELL | 4301.40 | 4340.43 | 4223.33 | 4340.43 | SL | -39.33 | -1.01R | |
| 987 | XAUUSD | 28.09.26 00:00 | SELL | 4294.20 | 4319.01 | 4244.58 | 4244.58 | TP | +49.32 | +1.99R | |
| 988 | XAUUSD | 30.09.26 19:00 | SELL | 4182.80 | 4206.47 | 4135.46 | 4206.47 | SL | -23.97 | -1.01R | |
| 989 | XAUUSD | 02.10.26 16:00 | SELL | 4156.20 | 4190.94 | 4086.71 | 4190.94 | SL | -35.04 | -1.01R | |
| 990 | XAUUSD | 05.10.26 14:00 | SELL | 4163.00 | 4188.59 | 4111.82 | 4188.59 | SL | -25.89 | -1.01R | |
| 991 | XAUUSD | 07.10.26 06:00 | SELL | 4154.80 | 4173.34 | 4117.71 | 4117.71 | TP | +36.79 | +1.98R | |
| 992 | XAUUSD | 08.10.26 06:00 | SELL | 4141.90 | 4163.60 | 4098.49 | 4163.60 | SL | -22.00 | -1.01R | |
| 993 | XAUUSD | 08.10.26 16:00 | SELL | 4135.80 | 4158.68 | 4090.05 | 4158.68 | SL | -23.18 | -1.01R | |
| 994 | XAUUSD | 13.10.26 16:00 | SELL | 4182.20 | 4199.94 | 4146.71 | 4146.71 | TP | +35.19 | +1.98R | |
| Total: 148 | +148.06 | +10.5R | |||||||||
- Click “Download the Excel journal via the bot” and tap “Start” in Telegram.
- Used the bot before and there is no “Start” button? Just send the bot the message /start.
- Not subscribed to @strategy4you yet — the bot will ask you to subscribe: subscribe and tap “✅ I’ve subscribed”. Already subscribed — the bot goes straight to the next step.
- The bot sends a “Get the EA for free” button — tap it to open the bonus page.
- On the page find the “📊 Strategy trade journals” block and click “Download Excel”.
How to calculate the lot size on gold
The stop in Puria 2.0 is different every time, so the lot has to be recalculated for each trade. On XAUUSD 1 lot = 100 ounces: a $1 price move gives $100 on 1 lot or $1 on 0.01 lot. Formula: lot = (account × risk %) / (stop in dollars × 100).
Example: account $5,000, 1% risk = $50, stop $35. Lot = 50 / (35 × 100) ≈ 0.014 → 0.01. With a $35 stop and a minimum lot of 0.01, a 1% risk is possible only from a $3,500 account. With a smaller account the risk per trade will be above 1% — keep this in mind.
USDJPY results: why the yen is at the end of the article
We found the first improved version on the yen, and until 2025 it looked better than any other pair. We are not removing these results — they honestly show how a strategy can stop working. But we moved them to the end because 2026 turned out negative on the yen, and the main reason is interventions and sharp moves of the yen.
First improved version (H1 + H4 trend + stop 1.5 ATR + take profit 2R)
This is Puria 2.0 without the last two steps: LWMAs on Low for both sides, no weekly filter. Test period 2008–2025, spread deducted.
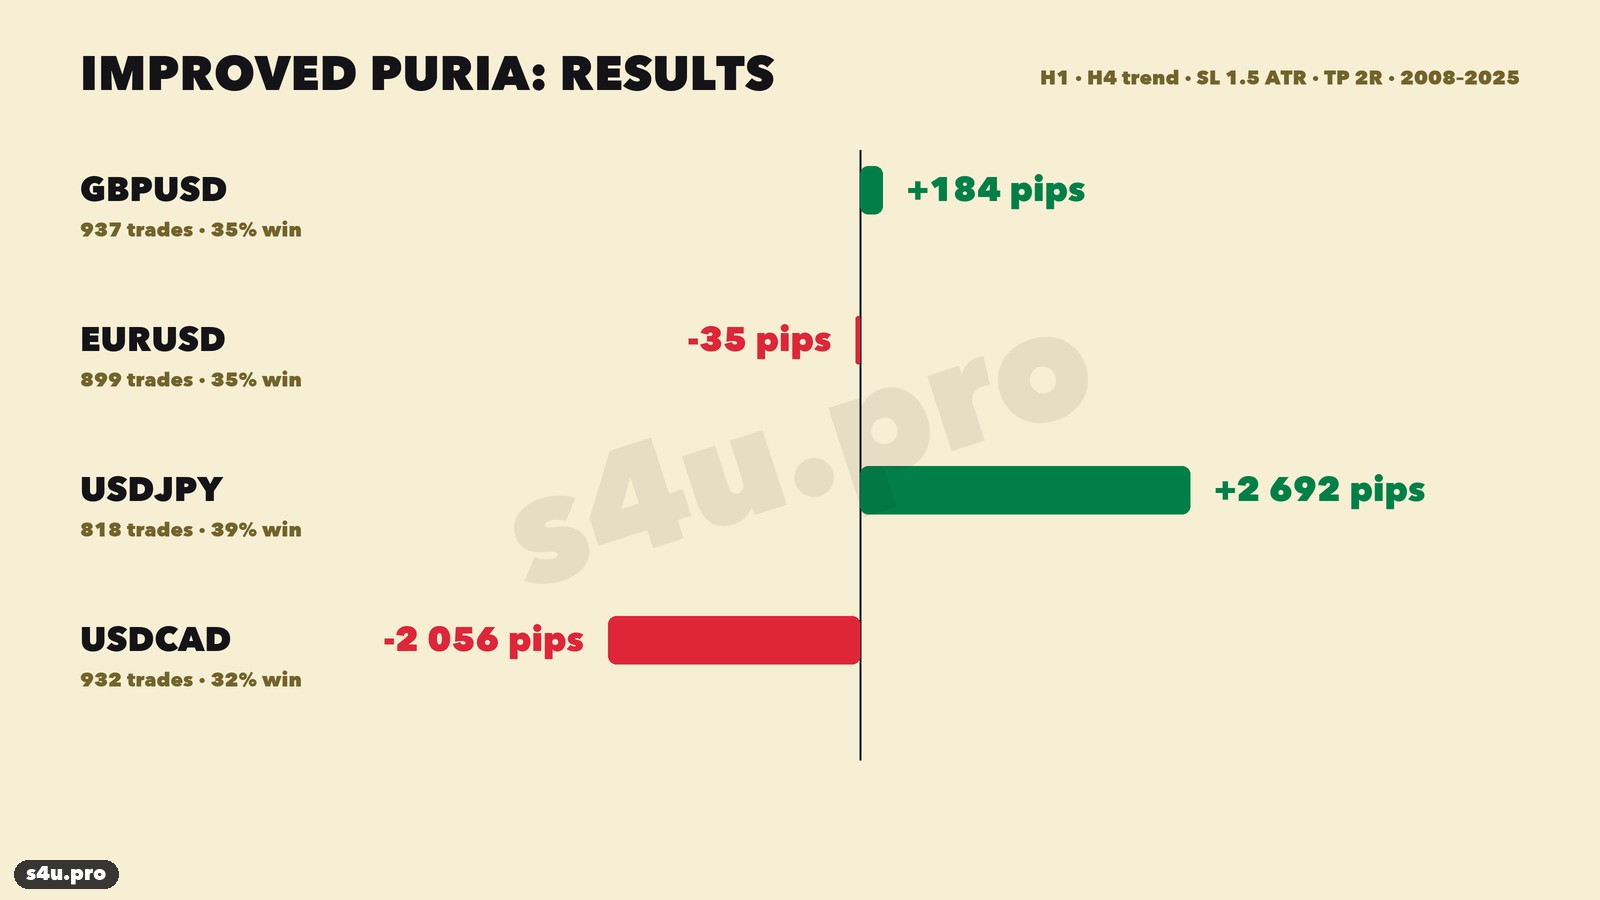
| Pair | Classic, pips | Improved: trades | Winners | Improved, pips |
|---|---|---|---|---|
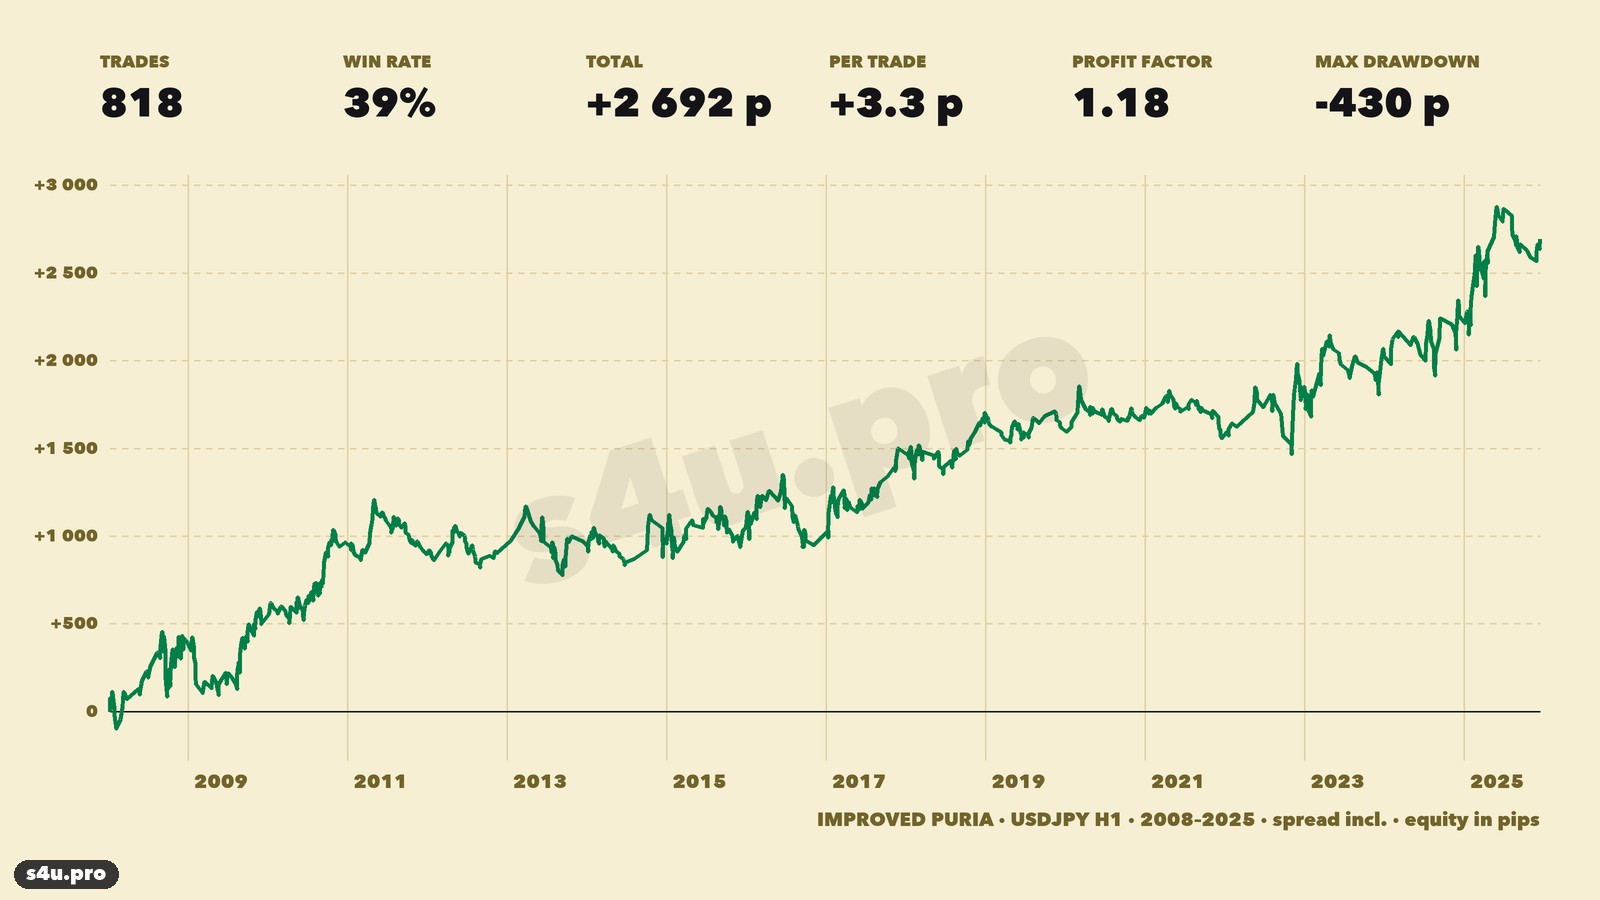
| USDJPY | −5,817 | 818 | 39% | +2,692 |
| GBPUSD | −4,688 | 937 | 35% | +184 |
| EURUSD | −3,856 | 899 | 35% | −35 |
| USDCAD | −4,914 | 932 | 32% | −2,056 |
On USDJPY: +2,692 pips on 818 trades over 2008–2025, profit factor 1.18, drawdown −430 pips, 14 profitable years out of 18. The rules were chosen on 2008–2017, and 2018–2025 was profitable too (+1,207 pips). Almost all the profit came from sells (+2,860), buys gave −168: with LWMAs on Low there were only 55 buys against 763 sells.
2026: −341 pips
On fresh USDJPY H1 quotes for January–October 2026 the same rules gave 17 trades, 3 take profits and −341 pips. 16 of the 17 trades were sells, together −303 pips.
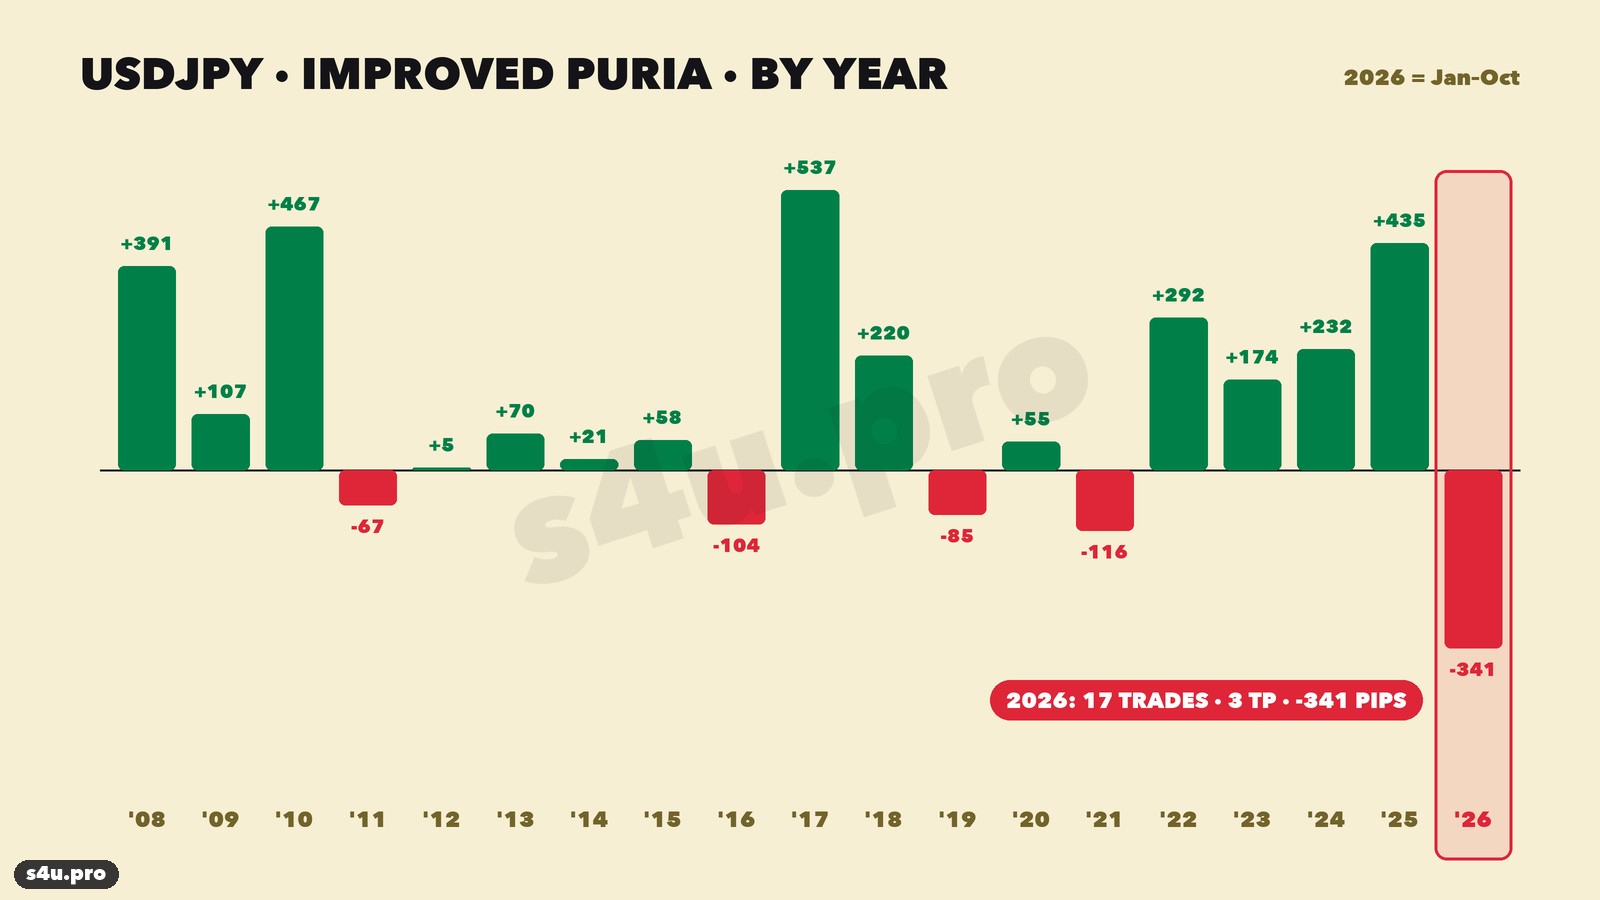
What happened: in 2026 the yen kept weakening, USDJPY held around 155–162, and sharp drops in the rate — including those around currency interventions — turned the H4 trend down. The filter saw a “downtrend”, the strategy sold, and the market soon came back up and hit the stop. Conclusion: selling USDJPY on this signal is not tradable right now.
Puria 2.0 on USDJPY: buys work
With the Puria 2.0 rules (mirrored LWMAs + weekly trend) the yen is profitable over the long history too: +79.9R on 1,030 trades over 2008–2026, 11 profitable years out of 19. Over 2008–2025 buys made +43.8R and sells +41.7R. In the 2024–2025 blind test: +18R.
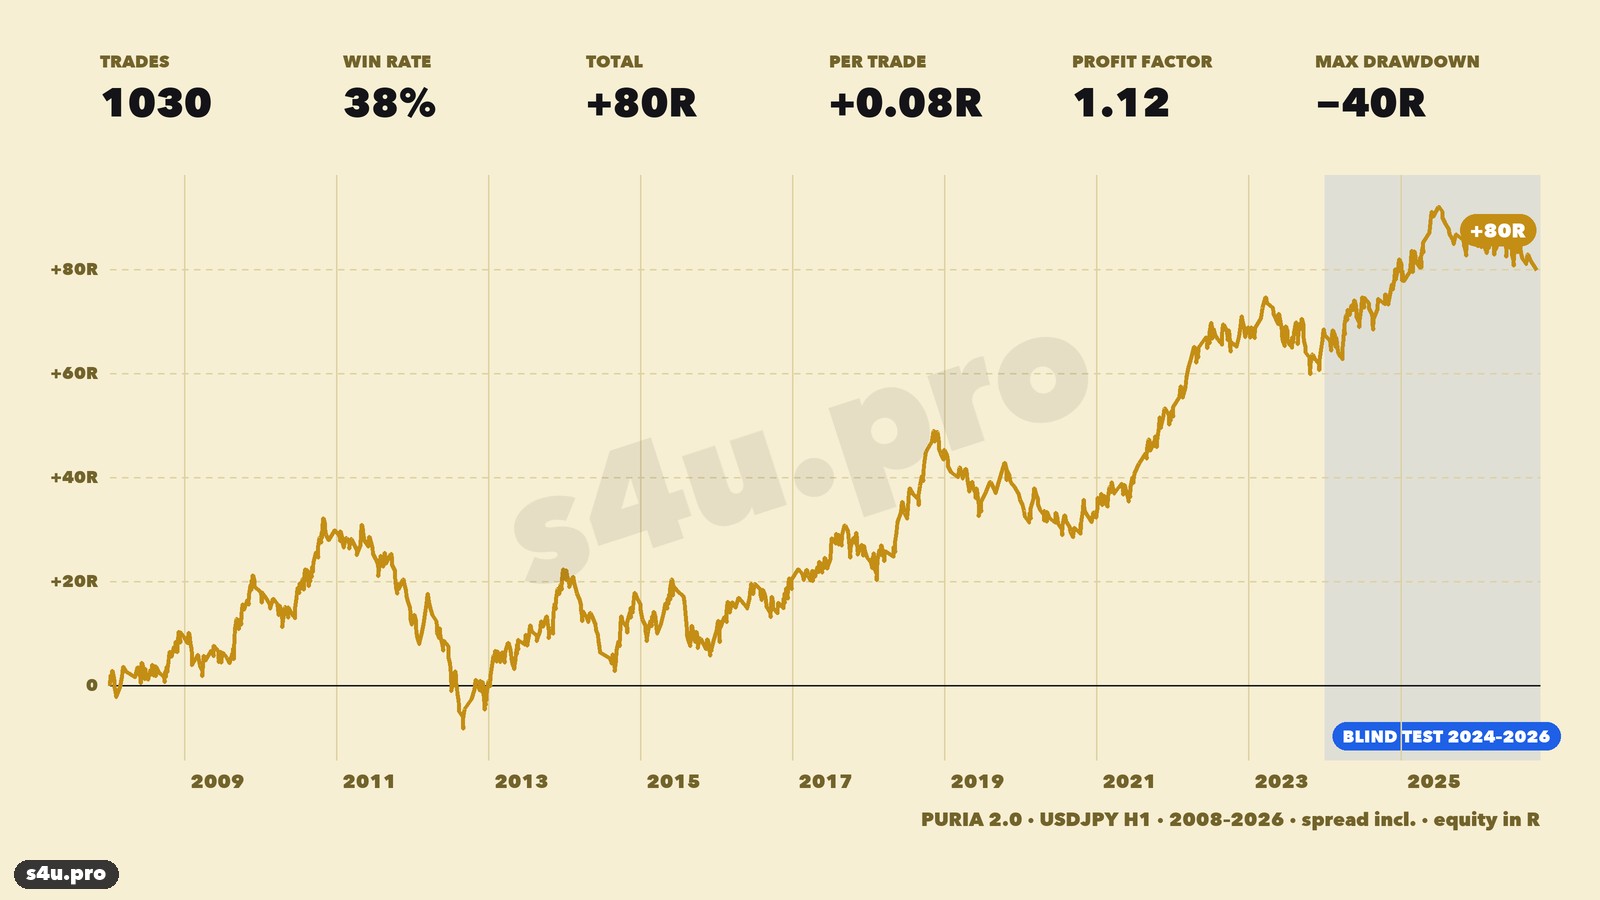
But 2026 is negative here as well: −5.6R on 51 trades. Split by direction, the picture is very clear:
| USDJPY, 2026 | Trades | Take profits | Result |
|---|---|---|---|
| First improved version | 17 (16 sells) | 3 | −341 pips |
| Puria 2.0 — buys | 43 | 16 | +50 pips (+2.7R) |
| Puria 2.0 — sells | 8 | 0 | −325 pips (−8.3R) |
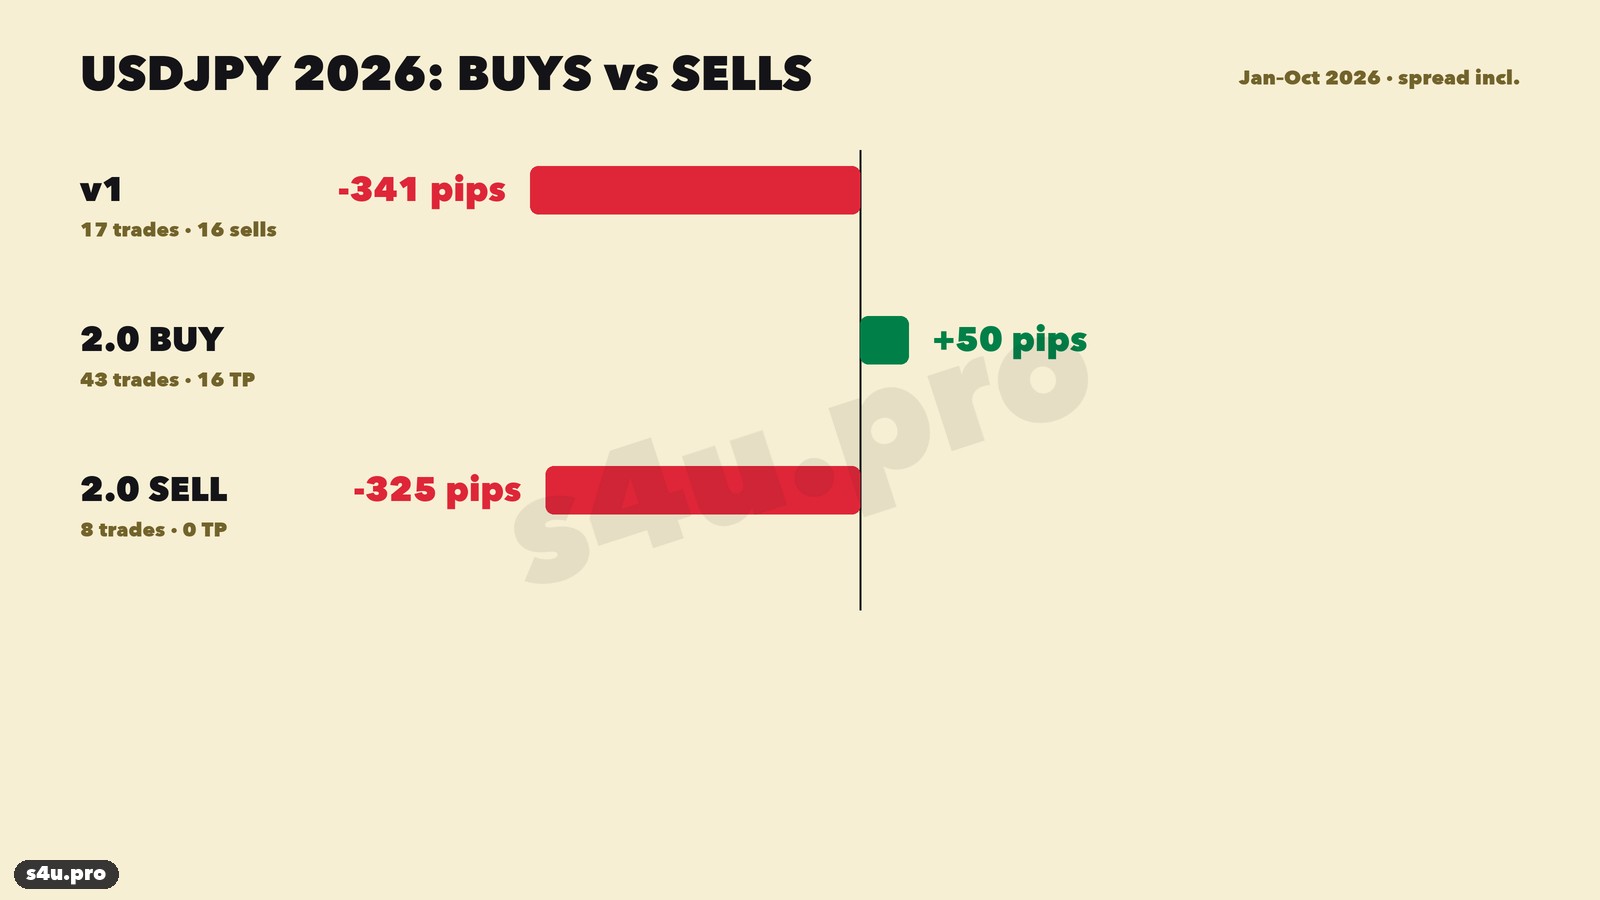
The whole 2026 loss on the yen comes from sells against the weakening yen. All 8 sells closed at the stop. Buys with the trend stayed profitable, if only slightly.
Should you trade USDJPY with the Puria Method?
- Sells — no. As long as interventions and sharp yen reversals are possible, sells on this signal get stopped out again and again.
- Puria 2.0 buys — worth considering as an addition to gold, but with lower risk and on a demo first: their 2026 profit is small.
- The first improved version on the yen (LWMAs on Low, almost only sells) — do not trade it.
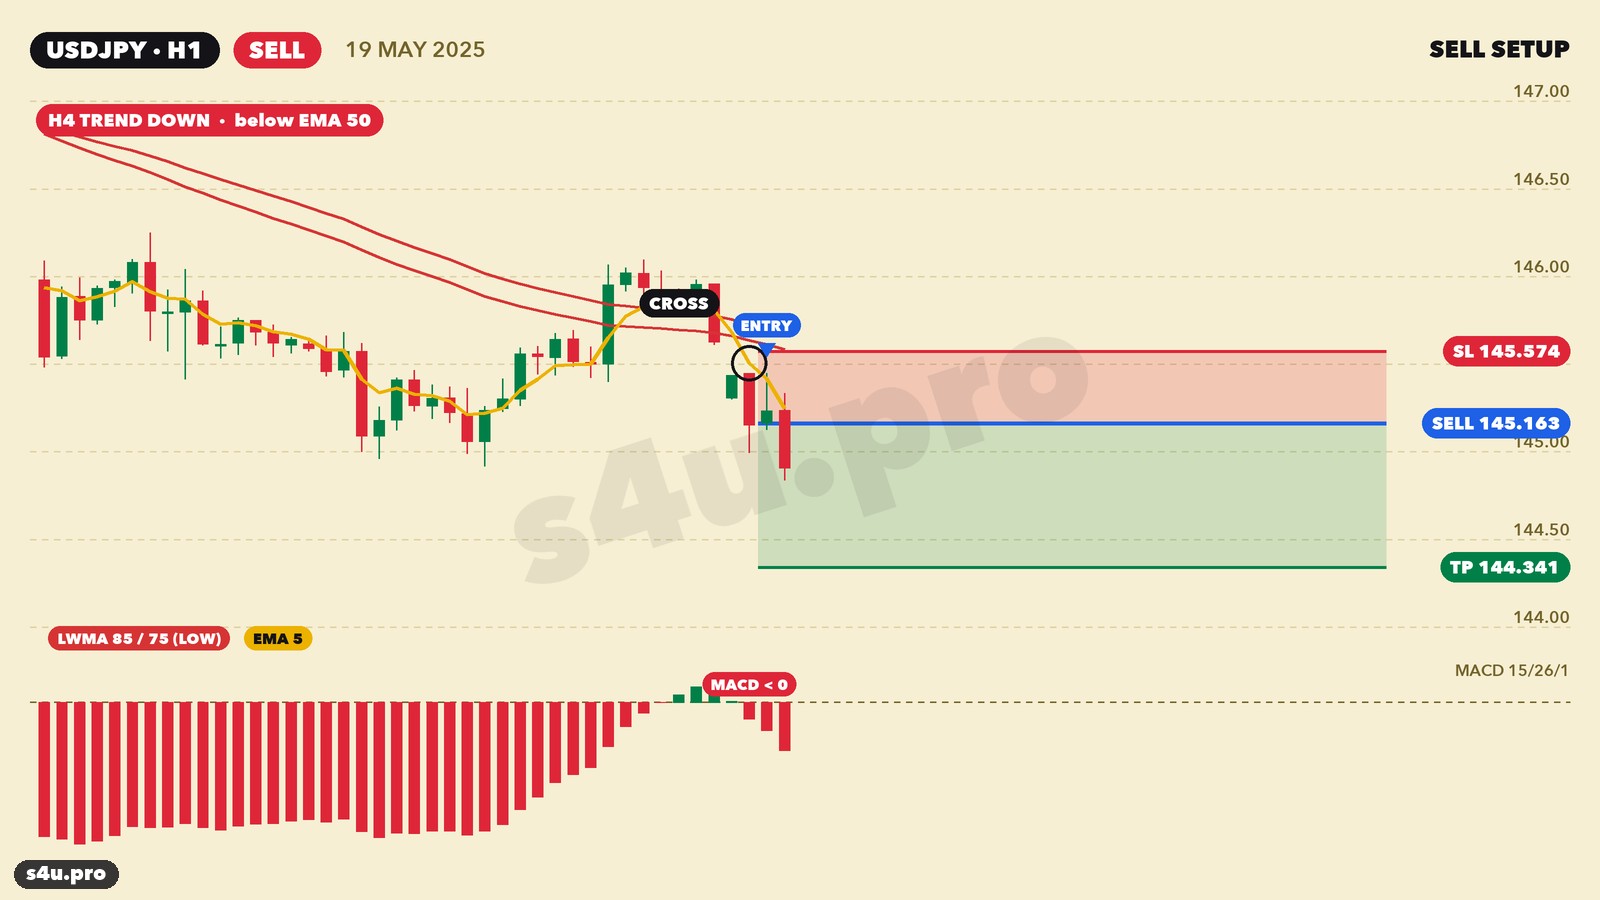
An example of a winning sell with the first version — May 2025, +81 pips, and a losing one — April 2025, a 101-pip stop during the market panic:
Gallery: all USDJPY trades 2018–2025 (first improved version)
Here are all 336 trades of the first improved version on the yen over 2018–2025 — the “blind” test period of that version, with no selection. Filter by result, direction and year, and click a picture to open the chart. The 17 trades of 2026 were calculated on other quotes (Yahoo) and are not in the gallery — their result is in the table above.
USDJPY trade table 2018–2025
| # | Market | Opened | Side | Entry | Stop | Target | Exit | Result | Pips | R | Chart |
|---|---|---|---|---|---|---|---|---|---|---|---|
| 483 | USDJPY | 09.01.18 04:00 | SELL | 112.655 | 112.841 | 112.283 | 112.841 | SL | -20 | -1.06R | 📈 |
| 484 | USDJPY | 16.01.18 11:00 | SELL | 110.646 | 110.873 | 110.193 | 110.873 | SL | -24 | -1.05R | 📈 |
| 485 | USDJPY | 16.01.18 18:00 | SELL | 110.674 | 110.901 | 110.220 | 110.220 | TP | +44 | +1.95R | 📈 |
| 486 | USDJPY | 19.01.18 09:00 | SELL | 110.779 | 111.028 | 110.280 | 111.028 | SL | -26 | -1.05R | 📈 |
| 487 | USDJPY | 23.01.18 13:00 | SELL | 110.638 | 110.905 | 110.103 | 110.103 | TP | +52 | +1.96R | 📈 |
| 488 | USDJPY | 26.01.18 11:00 | SELL | 108.932 | 109.276 | 108.243 | 109.276 | SL | -36 | -1.03R | 📈 |
| 489 | USDJPY | 26.01.18 17:00 | SELL | 108.699 | 109.126 | 107.845 | 109.126 | SL | -44 | -1.03R | 📈 |
| 490 | USDJPY | 30.01.18 08:00 | SELL | 108.680 | 108.969 | 108.102 | 108.969 | SL | -30 | -1.04R | 📈 |
| 491 | USDJPY | 07.02.18 08:00 | SELL | 109.160 | 109.502 | 108.476 | 109.502 | SL | -35 | -1.03R | 📈 |
| 492 | USDJPY | 08.02.18 20:00 | SELL | 108.670 | 109.042 | 107.925 | 109.042 | SL | -38 | -1.03R | 📈 |
| 493 | USDJPY | 09.02.18 14:00 | SELL | 109.043 | 109.383 | 108.363 | 108.363 | TP | +67 | +1.97R | 📈 |
| 494 | USDJPY | 13.02.18 06:00 | SELL | 108.575 | 108.794 | 108.137 | 108.137 | TP | +43 | +1.95R | 📈 |
| 495 | USDJPY | 22.02.18 15:00 | SELL | 107.036 | 107.321 | 106.467 | 106.467 | TP | +56 | +1.96R | 📈 |
| 496 | USDJPY | 28.02.18 18:00 | SELL | 106.711 | 106.983 | 106.167 | 106.983 | SL | -28 | -1.04R | 📈 |
| 497 | USDJPY | 01.03.18 21:00 | SELL | 106.487 | 106.757 | 105.948 | 105.948 | TP | +53 | +1.96R | 📈 |
| 498 | USDJPY | 07.03.18 02:00 | SELL | 105.575 | 105.883 | 104.960 | 105.883 | SL | -32 | -1.04R | 📈 |
| 499 | USDJPY | 14.03.18 00:00 | SELL | 106.454 | 106.718 | 105.926 | 106.718 | SL | -28 | -1.04R | 📈 |
| 500 | USDJPY | 16.03.18 04:00 | SELL | 105.992 | 106.245 | 105.485 | 106.245 | SL | -27 | -1.05R | 📈 |
| 501 | USDJPY | 21.03.18 22:00 | SELL | 105.907 | 106.164 | 105.394 | 105.394 | TP | +50 | +1.95R | 📈 |
| 502 | USDJPY | 07.05.18 12:00 | BUY | 109.290 | 109.095 | 109.681 | 109.095 | SL | -21 | -1.06R | 📈 |
| 503 | USDJPY | 07.05.18 23:00 | SELL | 109.039 | 109.223 | 108.670 | 109.223 | SL | -20 | -1.06R | 📈 |
| 504 | USDJPY | 28.05.18 15:00 | SELL | 109.343 | 109.557 | 108.914 | 108.914 | TP | +42 | +1.94R | 📈 |
| 505 | USDJPY | 31.05.18 05:00 | SELL | 108.571 | 108.817 | 108.078 | 108.817 | SL | -26 | -1.05R | 📈 |
| 506 | USDJPY | 31.05.18 10:00 | SELL | 108.619 | 108.865 | 108.128 | 108.865 | SL | -26 | -1.05R | 📈 |
| 507 | USDJPY | 31.05.18 18:00 | SELL | 108.623 | 108.908 | 108.053 | 108.908 | SL | -30 | -1.04R | 📈 |
| 508 | USDJPY | 20.06.18 09:00 | BUY | 110.210 | 110.006 | 110.617 | 110.006 | SL | -22 | -1.06R | 📈 |
| 509 | USDJPY | 21.06.18 20:00 | SELL | 109.950 | 110.191 | 109.469 | 110.191 | SL | -25 | -1.05R | 📈 |
| 510 | USDJPY | 22.06.18 18:00 | SELL | 109.892 | 110.100 | 109.476 | 109.476 | TP | +40 | +1.94R | 📈 |
| 511 | USDJPY | 25.07.18 14:00 | SELL | 111.097 | 111.278 | 110.735 | 110.735 | TP | +35 | +1.93R | 📈 |
| 512 | USDJPY | 27.07.18 20:00 | SELL | 110.839 | 111.025 | 110.467 | 111.025 | SL | -20 | -1.06R | 📈 |
| 513 | USDJPY | 31.07.18 07:00 | SELL | 110.873 | 111.054 | 110.511 | 111.054 | SL | -19 | -1.07R | 📈 |
| 514 | USDJPY | 03.08.18 16:00 | SELL | 111.449 | 111.620 | 111.106 | 111.106 | TP | +33 | +1.93R | 📈 |
| 515 | USDJPY | 07.08.18 03:00 | SELL | 111.328 | 111.445 | 111.094 | 111.094 | TP | +22 | +1.90R | 📈 |
| 516 | USDJPY | 08.08.18 10:00 | SELL | 111.102 | 111.230 | 110.846 | 110.846 | TP | +24 | +1.91R | 📈 |
| 517 | USDJPY | 09.08.18 17:00 | SELL | 110.964 | 111.120 | 110.653 | 111.120 | SL | -17 | -1.08R | 📈 |
| 518 | USDJPY | 10.08.18 05:00 | SELL | 110.935 | 111.102 | 110.600 | 111.102 | SL | -18 | -1.07R | 📈 |
| 519 | USDJPY | 10.08.18 17:00 | SELL | 110.768 | 111.034 | 110.236 | 110.236 | TP | +52 | +1.96R | 📈 |
| 520 | USDJPY | 15.08.18 18:00 | SELL | 110.435 | 110.666 | 109.972 | 110.666 | SL | -24 | -1.05R | 📈 |
| 521 | USDJPY | 16.08.18 16:00 | SELL | 110.642 | 110.859 | 110.209 | 110.859 | SL | -23 | -1.05R | 📈 |
| 522 | USDJPY | 17.08.18 11:00 | SELL | 110.702 | 110.865 | 110.377 | 110.377 | TP | +31 | +1.93R | 📈 |
| 523 | USDJPY | 20.08.18 16:00 | SELL | 110.431 | 110.587 | 110.118 | 110.118 | TP | +30 | +1.92R | 📈 |
| 524 | USDJPY | 22.08.18 02:00 | SELL | 110.074 | 110.278 | 109.665 | 110.278 | SL | -22 | -1.06R | 📈 |
| 525 | USDJPY | 03.09.18 04:00 | SELL | 110.988 | 111.176 | 110.613 | 111.176 | SL | -20 | -1.06R | 📈 |
| 526 | USDJPY | 10.10.18 17:00 | SELL | 112.911 | 113.103 | 112.527 | 112.527 | TP | +37 | +1.94R | 📈 |
| 527 | USDJPY | 12.10.18 12:00 | SELL | 112.253 | 112.496 | 111.767 | 111.767 | TP | +47 | +1.95R | 📈 |
| 528 | USDJPY | 18.10.18 21:00 | SELL | 112.043 | 112.257 | 111.615 | 112.257 | SL | -23 | -1.06R | 📈 |
| 529 | USDJPY | 26.10.18 08:00 | SELL | 112.213 | 112.427 | 111.785 | 111.785 | TP | +42 | +1.94R | 📈 |
| 530 | USDJPY | 16.11.18 04:00 | SELL | 113.447 | 113.656 | 113.030 | 113.030 | TP | +41 | +1.94R | 📈 |
| 531 | USDJPY | 23.11.18 11:00 | SELL | 112.858 | 112.954 | 112.665 | 112.665 | TP | +18 | +1.88R | 📈 |
| 532 | USDJPY | 04.12.18 05:00 | SELL | 113.312 | 113.469 | 112.999 | 112.999 | TP | +30 | +1.92R | 📈 |
| 533 | USDJPY | 07.12.18 19:00 | SELL | 112.593 | 112.794 | 112.191 | 112.794 | SL | -21 | -1.06R | 📈 |
| 534 | USDJPY | 20.12.18 07:00 | SELL | 112.245 | 112.479 | 111.776 | 111.776 | TP | +46 | +1.95R | 📈 |
| 535 | USDJPY | 27.12.18 17:00 | SELL | 110.666 | 110.931 | 110.137 | 110.931 | SL | -28 | -1.04R | 📈 |
| 536 | USDJPY | 28.12.18 06:00 | SELL | 110.550 | 110.844 | 109.961 | 109.961 | TP | +58 | +1.96R | 📈 |
| 537 | USDJPY | 09.01.19 18:00 | SELL | 108.182 | 108.436 | 107.674 | 108.436 | SL | -27 | -1.05R | 📈 |
| 538 | USDJPY | 14.01.19 07:00 | SELL | 108.110 | 108.300 | 107.730 | 108.300 | SL | -20 | -1.06R | 📈 |
| 539 | USDJPY | 15.01.19 01:00 | SELL | 108.151 | 108.314 | 107.824 | 108.314 | SL | -18 | -1.07R | 📈 |
| 540 | USDJPY | 30.01.19 05:00 | SELL | 109.270 | 109.428 | 108.953 | 109.428 | SL | -17 | -1.08R | 📈 |
| 541 | USDJPY | 18.02.19 11:00 | BUY | 110.575 | 110.455 | 110.816 | 110.455 | SL | -13 | -1.10R | 📈 |
| 542 | USDJPY | 13.03.19 21:00 | SELL | 111.026 | 111.175 | 110.729 | 111.175 | SL | -16 | -1.08R | 📈 |
| 543 | USDJPY | 14.03.19 02:00 | SELL | 111.205 | 111.363 | 110.890 | 111.363 | SL | -17 | -1.08R | 📈 |
| 544 | USDJPY | 28.03.19 05:00 | SELL | 110.167 | 110.387 | 109.726 | 110.387 | SL | -23 | -1.05R | 📈 |
| 545 | USDJPY | 23.04.19 04:00 | SELL | 111.695 | 111.773 | 111.538 | 111.773 | SL | -9 | -1.15R | 📈 |
| 546 | USDJPY | 23.04.19 20:00 | SELL | 111.786 | 111.893 | 111.572 | 111.893 | SL | -12 | -1.11R | 📈 |
| 547 | USDJPY | 25.04.19 16:00 | SELL | 111.809 | 111.956 | 111.515 | 111.515 | TP | +28 | +1.92R | 📈 |
| 548 | USDJPY | 30.04.19 05:00 | SELL | 111.570 | 111.670 | 111.370 | 111.370 | TP | +19 | +1.88R | 📈 |
| 549 | USDJPY | 01.05.19 12:00 | SELL | 111.413 | 111.516 | 111.206 | 111.206 | TP | +19 | +1.88R | 📈 |
| 550 | USDJPY | 03.05.19 18:00 | SELL | 111.223 | 111.346 | 110.978 | 110.978 | TP | +23 | +1.90R | 📈 |
| 551 | USDJPY | 13.05.19 11:00 | SELL | 109.638 | 109.813 | 109.288 | 109.288 | TP | +34 | +1.93R | 📈 |
| 552 | USDJPY | 15.05.19 13:00 | SELL | 109.337 | 109.499 | 109.012 | 109.499 | SL | -17 | -1.07R | 📈 |
| 553 | USDJPY | 28.05.19 12:00 | SELL | 109.223 | 109.361 | 108.947 | 109.361 | SL | -15 | -1.09R | 📈 |
| 554 | USDJPY | 29.05.19 00:00 | SELL | 109.365 | 109.521 | 109.052 | 109.521 | SL | -17 | -1.08R | 📈 |
| 555 | USDJPY | 31.05.19 04:00 | SELL | 109.264 | 109.444 | 108.904 | 108.904 | TP | +35 | +1.93R | 📈 |
| 556 | USDJPY | 04.06.19 22:00 | SELL | 108.053 | 108.285 | 107.589 | 108.285 | SL | -24 | -1.05R | 📈 |
| 557 | USDJPY | 07.06.19 18:00 | SELL | 108.012 | 108.236 | 107.564 | 108.236 | SL | -24 | -1.05R | 📈 |
| 558 | USDJPY | 12.06.19 09:00 | SELL | 108.396 | 108.518 | 108.152 | 108.518 | SL | -13 | -1.10R | 📈 |
| 559 | USDJPY | 13.06.19 05:00 | SELL | 108.292 | 108.435 | 108.007 | 108.435 | SL | -15 | -1.08R | 📈 |
| 560 | USDJPY | 13.06.19 22:00 | SELL | 108.315 | 108.462 | 108.021 | 108.462 | SL | -16 | -1.08R | 📈 |
| 561 | USDJPY | 19.06.19 09:00 | SELL | 108.342 | 108.494 | 108.038 | 108.038 | TP | +29 | +1.92R | 📈 |
| 562 | USDJPY | 24.06.19 12:00 | SELL | 107.364 | 107.522 | 107.048 | 107.522 | SL | -17 | -1.08R | 📈 |
| 563 | USDJPY | 24.06.19 21:00 | SELL | 107.323 | 107.484 | 107.002 | 107.002 | TP | +31 | +1.93R | 📈 |
| 564 | USDJPY | 12.07.19 01:00 | BUY | 108.476 | 108.325 | 108.778 | 108.325 | SL | -16 | -1.08R | 📈 |
| 565 | USDJPY | 16.07.19 16:00 | BUY | 108.190 | 108.037 | 108.495 | 108.037 | SL | -16 | -1.08R | 📈 |
| 566 | USDJPY | 18.07.19 00:00 | SELL | 107.935 | 108.070 | 107.664 | 107.664 | TP | +26 | +1.91R | 📈 |
| 567 | USDJPY | 31.07.19 22:00 | BUY | 108.772 | 108.610 | 109.095 | 109.095 | TP | +31 | +1.93R | 📈 |
| 568 | USDJPY | 07.08.19 07:00 | SELL | 106.058 | 106.356 | 105.463 | 105.463 | TP | +58 | +1.96R | 📈 |
| 569 | USDJPY | 20.08.19 16:00 | SELL | 106.268 | 106.411 | 105.982 | 106.411 | SL | -15 | -1.08R | 📈 |
| 570 | USDJPY | 02.09.19 21:00 | SELL | 106.146 | 106.301 | 105.837 | 106.301 | SL | -17 | -1.08R | 📈 |
| 571 | USDJPY | 01.10.19 20:00 | SELL | 107.687 | 107.910 | 107.242 | 107.242 | TP | +43 | +1.95R | 📈 |
| 572 | USDJPY | 13.11.19 12:00 | SELL | 108.891 | 109.027 | 108.619 | 108.619 | TP | +26 | +1.91R | 📈 |
| 573 | USDJPY | 18.11.19 20:00 | SELL | 108.581 | 108.729 | 108.286 | 108.729 | SL | -16 | -1.08R | 📈 |
| 574 | USDJPY | 19.11.19 18:00 | SELL | 108.488 | 108.637 | 108.189 | 108.637 | SL | -16 | -1.08R | 📈 |
| 575 | USDJPY | 21.11.19 02:00 | SELL | 108.468 | 108.651 | 108.102 | 108.651 | SL | -19 | -1.07R | 📈 |
| 576 | USDJPY | 06.12.19 05:00 | SELL | 108.672 | 108.795 | 108.426 | 108.795 | SL | -13 | -1.10R | 📈 |
| 577 | USDJPY | 06.12.19 19:00 | SELL | 108.657 | 108.808 | 108.355 | 108.808 | SL | -16 | -1.08R | 📈 |
| 578 | USDJPY | 11.12.19 23:00 | SELL | 108.539 | 108.655 | 108.306 | 108.655 | SL | -13 | -1.10R | 📈 |
| 579 | USDJPY | 08.01.20 03:00 | SELL | 107.860 | 108.099 | 107.381 | 108.099 | SL | -25 | -1.05R | 📈 |
| 580 | USDJPY | 30.01.20 03:00 | SELL | 108.962 | 109.112 | 108.663 | 108.663 | TP | +29 | +1.92R | 📈 |
| 581 | USDJPY | 31.01.20 17:00 | SELL | 108.751 | 108.906 | 108.441 | 108.441 | TP | +30 | +1.92R | 📈 |
| 582 | USDJPY | 26.02.20 19:00 | SELL | 110.362 | 110.637 | 109.812 | 109.812 | TP | +54 | +1.96R | 📈 |
| 583 | USDJPY | 03.03.20 05:00 | SELL | 107.950 | 108.418 | 107.015 | 107.015 | TP | +92 | +1.97R | 📈 |
| 584 | USDJPY | 05.03.20 06:00 | SELL | 107.313 | 107.595 | 106.749 | 106.749 | TP | +55 | +1.96R | 📈 |
| 585 | USDJPY | 12.03.20 05:00 | SELL | 103.378 | 104.112 | 101.910 | 104.112 | SL | -75 | -1.02R | 📈 |
| 586 | USDJPY | 31.03.20 20:00 | SELL | 107.769 | 108.272 | 106.762 | 108.272 | SL | -52 | -1.02R | 📈 |
| 587 | USDJPY | 21.04.20 07:00 | SELL | 107.544 | 107.751 | 107.130 | 107.751 | SL | -22 | -1.06R | 📈 |
| 588 | USDJPY | 23.04.20 14:00 | SELL | 107.547 | 107.699 | 107.243 | 107.699 | SL | -16 | -1.08R | 📈 |
| 589 | USDJPY | 23.04.20 20:00 | SELL | 107.513 | 107.763 | 107.012 | 107.012 | TP | +49 | +1.95R | 📈 |
| 590 | USDJPY | 04.05.20 06:00 | SELL | 106.695 | 106.902 | 106.282 | 106.902 | SL | -22 | -1.06R | 📈 |
| 591 | USDJPY | 04.05.20 23:00 | SELL | 106.687 | 106.859 | 106.343 | 106.859 | SL | -18 | -1.07R | 📈 |
| 592 | USDJPY | 05.05.20 17:00 | SELL | 106.580 | 106.753 | 106.233 | 106.233 | TP | +33 | +1.93R | 📈 |
| 593 | USDJPY | 15.05.20 16:00 | SELL | 106.911 | 107.085 | 106.564 | 107.085 | SL | -19 | -1.07R | 📈 |
| 594 | USDJPY | 17.06.20 09:00 | SELL | 107.236 | 107.419 | 106.869 | 107.419 | SL | -20 | -1.06R | 📈 |
| 595 | USDJPY | 17.06.20 21:00 | SELL | 107.183 | 107.341 | 106.867 | 106.867 | TP | +30 | +1.92R | 📈 |
| 596 | USDJPY | 23.06.20 17:00 | SELL | 106.256 | 106.470 | 105.827 | 106.470 | SL | -23 | -1.06R | 📈 |
| 597 | USDJPY | 26.06.20 14:00 | SELL | 106.873 | 107.020 | 106.578 | 107.020 | SL | -16 | -1.08R | 📈 |
| 598 | USDJPY | 15.07.20 12:00 | SELL | 106.895 | 107.029 | 106.626 | 107.029 | SL | -15 | -1.09R | 📈 |
| 599 | USDJPY | 17.07.20 21:00 | SELL | 107.000 | 107.120 | 106.759 | 107.120 | SL | -13 | -1.10R | 📈 |
| 600 | USDJPY | 21.07.20 17:00 | SELL | 106.995 | 107.146 | 106.692 | 106.692 | TP | +29 | +1.92R | 📈 |
| 601 | USDJPY | 30.07.20 21:00 | SELL | 104.887 | 105.103 | 104.455 | 104.455 | TP | +42 | +1.94R | 📈 |
| 602 | USDJPY | 05.08.20 03:00 | SELL | 105.622 | 105.827 | 105.212 | 105.827 | SL | -22 | -1.06R | 📈 |
| 603 | USDJPY | 21.08.20 07:00 | SELL | 105.667 | 105.822 | 105.357 | 105.822 | SL | -17 | -1.08R | 📈 |
| 604 | USDJPY | 26.08.20 21:00 | SELL | 105.995 | 106.182 | 105.621 | 106.182 | SL | -20 | -1.06R | 📈 |
| 605 | USDJPY | 08.09.20 16:00 | SELL | 105.983 | 106.119 | 105.712 | 106.119 | SL | -15 | -1.09R | 📈 |
| 606 | USDJPY | 14.09.20 08:00 | SELL | 106.046 | 106.141 | 105.855 | 105.855 | TP | +18 | +1.87R | 📈 |
| 607 | USDJPY | 14.10.20 05:00 | SELL | 105.325 | 105.432 | 105.111 | 105.432 | SL | -12 | -1.11R | 📈 |
| 608 | USDJPY | 14.10.20 12:00 | SELL | 105.359 | 105.466 | 105.144 | 105.144 | TP | +20 | +1.89R | 📈 |
| 609 | USDJPY | 16.10.20 09:00 | SELL | 105.242 | 105.357 | 105.012 | 105.357 | SL | -13 | -1.10R | 📈 |
| 610 | USDJPY | 21.10.20 06:00 | SELL | 105.370 | 105.481 | 105.147 | 105.147 | TP | +21 | +1.89R | 📈 |
| 611 | USDJPY | 27.10.20 08:00 | SELL | 104.734 | 104.839 | 104.524 | 104.524 | TP | +20 | +1.89R | 📈 |
| 612 | USDJPY | 29.10.20 09:00 | SELL | 104.339 | 104.467 | 104.082 | 104.082 | TP | +24 | +1.91R | 📈 |
| 613 | USDJPY | 30.10.20 09:00 | SELL | 104.303 | 104.465 | 103.979 | 104.465 | SL | -17 | -1.07R | 📈 |
| 614 | USDJPY | 03.11.20 19:00 | SELL | 104.497 | 104.658 | 104.174 | 104.658 | SL | -17 | -1.07R | 📈 |
| 615 | USDJPY | 19.11.20 19:00 | SELL | 103.847 | 104.026 | 103.489 | 104.026 | SL | -19 | -1.07R | 📈 |
| 616 | USDJPY | 07.12.20 22:00 | SELL | 103.968 | 104.129 | 103.646 | 104.129 | SL | -17 | -1.07R | 📈 |
| 617 | USDJPY | 15.12.20 16:00 | SELL | 103.761 | 103.902 | 103.480 | 103.480 | TP | +27 | +1.92R | 📈 |
| 618 | USDJPY | 28.12.20 09:00 | SELL | 103.442 | 103.562 | 103.202 | 103.562 | SL | -13 | -1.10R | 📈 |
| 619 | USDJPY | 04.01.21 03:00 | SELL | 103.052 | 103.218 | 102.721 | 102.721 | TP | +32 | +1.93R | 📈 |
| 620 | USDJPY | 05.01.21 08:00 | SELL | 102.947 | 103.077 | 102.687 | 102.687 | TP | +25 | +1.91R | 📈 |
| 621 | USDJPY | 14.01.21 05:00 | BUY | 104.027 | 103.847 | 104.387 | 103.847 | SL | -19 | -1.07R | 📈 |
| 622 | USDJPY | 18.01.21 06:00 | SELL | 103.737 | 103.876 | 103.459 | 103.876 | SL | -15 | -1.09R | 📈 |
| 623 | USDJPY | 20.01.21 16:00 | SELL | 103.737 | 103.847 | 103.517 | 103.517 | TP | +21 | +1.89R | 📈 |
| 624 | USDJPY | 26.01.21 17:00 | SELL | 103.580 | 103.683 | 103.374 | 103.683 | SL | -12 | -1.12R | 📈 |
| 625 | USDJPY | 27.01.21 09:00 | SELL | 103.664 | 103.754 | 103.485 | 103.754 | SL | -10 | -1.13R | 📈 |
| 626 | USDJPY | 22.02.21 16:00 | SELL | 105.344 | 105.536 | 104.959 | 104.959 | TP | +37 | +1.94R | 📈 |
| 627 | USDJPY | 23.03.21 06:00 | SELL | 108.698 | 108.824 | 108.446 | 108.446 | TP | +24 | +1.91R | 📈 |
| 628 | USDJPY | 06.04.21 16:00 | SELL | 109.895 | 110.113 | 109.459 | 109.459 | TP | +42 | +1.95R | 📈 |
| 629 | USDJPY | 12.04.21 13:00 | SELL | 109.307 | 109.475 | 108.970 | 109.475 | SL | -18 | -1.07R | 📈 |
| 630 | USDJPY | 13.04.21 13:00 | SELL | 109.332 | 109.508 | 108.981 | 109.508 | SL | -19 | -1.07R | 📈 |
| 631 | USDJPY | 19.04.21 03:00 | SELL | 108.715 | 108.845 | 108.454 | 108.454 | TP | +25 | +1.91R | 📈 |
| 632 | USDJPY | 20.04.21 18:00 | SELL | 108.121 | 108.328 | 107.707 | 107.707 | TP | +40 | +1.94R | 📈 |
| 633 | USDJPY | 23.04.21 23:00 | SELL | 107.885 | 108.066 | 107.522 | 108.066 | SL | -19 | -1.07R | 📈 |
| 634 | USDJPY | 07.05.21 16:00 | SELL | 108.572 | 108.805 | 108.105 | 108.805 | SL | -25 | -1.05R | 📈 |
| 635 | USDJPY | 11.05.21 04:00 | BUY | 108.943 | 108.762 | 109.305 | 108.762 | SL | -19 | -1.07R | 📈 |
| 636 | USDJPY | 11.05.21 15:00 | SELL | 108.588 | 108.766 | 108.231 | 108.766 | SL | -19 | -1.07R | 📈 |
| 637 | USDJPY | 19.05.21 17:00 | SELL | 108.763 | 108.943 | 108.403 | 108.943 | SL | -19 | -1.07R | 📈 |
| 638 | USDJPY | 20.05.21 15:00 | SELL | 108.911 | 109.072 | 108.589 | 108.589 | TP | +31 | +1.93R | 📈 |
| 639 | USDJPY | 26.05.21 00:00 | SELL | 108.738 | 108.891 | 108.431 | 108.891 | SL | -17 | -1.08R | 📈 |
| 640 | USDJPY | 09.06.21 17:00 | SELL | 109.282 | 109.410 | 109.026 | 109.410 | SL | -14 | -1.09R | 📈 |
| 641 | USDJPY | 10.06.21 23:00 | SELL | 109.313 | 109.468 | 109.002 | 109.468 | SL | -17 | -1.08R | 📈 |
| 642 | USDJPY | 14.07.21 17:00 | SELL | 110.072 | 110.224 | 109.767 | 109.767 | TP | +29 | +1.92R | 📈 |
| 643 | USDJPY | 19.07.21 04:00 | SELL | 109.860 | 110.012 | 109.556 | 110.012 | SL | -16 | -1.08R | 📈 |
| 644 | USDJPY | 19.07.21 11:00 | SELL | 109.836 | 109.987 | 109.533 | 109.533 | TP | +29 | +1.92R | 📈 |
| 645 | USDJPY | 02.08.21 14:00 | SELL | 109.507 | 109.646 | 109.229 | 109.229 | TP | +27 | +1.91R | 📈 |
| 646 | USDJPY | 20.08.21 11:00 | SELL | 109.608 | 109.771 | 109.282 | 109.771 | SL | -17 | -1.07R | 📈 |
| 647 | USDJPY | 23.08.21 22:00 | SELL | 109.678 | 109.828 | 109.378 | 109.828 | SL | -16 | -1.08R | 📈 |
| 648 | USDJPY | 24.08.21 14:00 | SELL | 109.707 | 109.838 | 109.445 | 109.445 | TP | +25 | +1.91R | 📈 |
| 649 | USDJPY | 27.08.21 20:00 | SELL | 109.798 | 109.974 | 109.446 | 109.974 | SL | -19 | -1.07R | 📈 |
| 650 | USDJPY | 31.08.21 08:00 | BUY | 109.900 | 109.803 | 110.095 | 109.803 | SL | -11 | -1.12R | 📈 |
| 651 | USDJPY | 31.08.21 16:00 | SELL | 109.705 | 109.834 | 109.448 | 109.834 | SL | -14 | -1.09R | 📈 |
| 652 | USDJPY | 07.09.21 04:00 | SELL | 109.775 | 109.853 | 109.619 | 109.853 | SL | -9 | -1.15R | 📈 |
| 653 | USDJPY | 13.09.21 04:00 | BUY | 109.963 | 109.852 | 110.185 | 109.852 | SL | -12 | -1.11R | 📈 |
| 654 | USDJPY | 14.09.21 18:00 | SELL | 109.651 | 109.786 | 109.382 | 109.382 | TP | +26 | +1.91R | 📈 |
| 655 | USDJPY | 20.09.21 14:00 | SELL | 109.503 | 109.640 | 109.229 | 109.640 | SL | -15 | -1.09R | 📈 |
| 656 | USDJPY | 27.10.21 13:00 | SELL | 113.638 | 113.828 | 113.257 | 113.828 | SL | -20 | -1.06R | 📈 |
| 657 | USDJPY | 04.11.21 17:00 | SELL | 113.591 | 113.816 | 113.141 | 113.816 | SL | -24 | -1.05R | 📈 |
| 658 | USDJPY | 05.11.21 16:00 | SELL | 113.629 | 113.844 | 113.198 | 113.198 | TP | +42 | +1.94R | 📈 |
| 659 | USDJPY | 01.12.21 17:00 | SELL | 112.833 | 113.151 | 112.197 | 113.151 | SL | -33 | -1.04R | 📈 |
| 660 | USDJPY | 02.12.21 15:00 | SELL | 112.814 | 113.096 | 112.249 | 113.096 | SL | -29 | -1.04R | 📈 |
| 661 | USDJPY | 03.12.21 21:00 | SELL | 112.587 | 112.899 | 111.963 | 112.899 | SL | -32 | -1.04R | 📈 |
| 662 | USDJPY | 09.12.21 15:00 | SELL | 113.426 | 113.618 | 113.041 | 113.618 | SL | -20 | -1.06R | 📈 |
| 663 | USDJPY | 10.12.21 19:00 | SELL | 113.361 | 113.561 | 112.962 | 113.561 | SL | -21 | -1.06R | 📈 |
| 664 | USDJPY | 16.12.21 20:00 | SELL | 113.626 | 113.821 | 113.236 | 113.821 | SL | -21 | -1.06R | 📈 |
| 665 | USDJPY | 12.01.22 17:00 | SELL | 115.089 | 115.278 | 114.711 | 114.711 | TP | +37 | +1.94R | 📈 |
| 666 | USDJPY | 19.01.22 08:00 | SELL | 114.249 | 114.456 | 113.835 | 114.456 | SL | -22 | -1.06R | 📈 |
| 667 | USDJPY | 19.01.22 17:00 | SELL | 114.342 | 114.548 | 113.931 | 113.931 | TP | +40 | +1.94R | 📈 |
| 668 | USDJPY | 03.02.22 12:00 | BUY | 114.738 | 114.579 | 115.055 | 115.055 | TP | +31 | +1.92R | 📈 |
| 669 | USDJPY | 24.02.22 06:00 | SELL | 114.690 | 114.893 | 114.283 | 114.893 | SL | -22 | -1.06R | 📈 |
| 670 | USDJPY | 11.05.22 20:00 | SELL | 129.926 | 130.362 | 129.054 | 129.054 | TP | +86 | +1.97R | 📈 |
| 671 | USDJPY | 18.05.22 16:00 | SELL | 128.895 | 129.178 | 128.330 | 128.330 | TP | +55 | +1.96R | 📈 |
| 672 | USDJPY | 20.05.22 19:00 | SELL | 127.858 | 128.289 | 126.997 | 126.997 | TP | +85 | +1.97R | 📈 |
| 673 | USDJPY | 26.05.22 11:00 | SELL | 126.593 | 126.934 | 125.911 | 126.934 | SL | -35 | -1.03R | 📈 |
| 674 | USDJPY | 27.05.22 05:00 | SELL | 126.786 | 127.109 | 126.140 | 127.109 | SL | -34 | -1.04R | 📈 |
| 675 | USDJPY | 24.06.22 21:00 | BUY | 135.357 | 134.923 | 136.224 | 134.923 | SL | -45 | -1.03R | 📈 |
| 676 | USDJPY | 28.07.22 02:00 | SELL | 136.446 | 136.805 | 135.729 | 135.729 | TP | +71 | +1.97R | 📈 |
| 677 | USDJPY | 05.08.22 00:00 | SELL | 132.855 | 133.326 | 131.914 | 133.326 | SL | -48 | -1.02R | 📈 |
| 678 | USDJPY | 05.08.22 13:00 | SELL | 133.055 | 133.501 | 132.163 | 133.501 | SL | -46 | -1.03R | 📈 |
| 679 | USDJPY | 10.08.22 16:00 | SELL | 133.138 | 133.614 | 132.185 | 132.185 | TP | +94 | +1.98R | 📈 |
| 680 | USDJPY | 15.08.22 17:00 | SELL | 132.736 | 133.106 | 131.996 | 133.106 | SL | -38 | -1.03R | 📈 |
| 681 | USDJPY | 13.09.22 16:00 | BUY | 144.404 | 143.735 | 145.742 | 143.735 | SL | -68 | -1.02R | 📈 |
| 682 | USDJPY | 22.09.22 14:00 | SELL | 142.490 | 143.737 | 139.995 | 143.737 | SL | -126 | -1.01R | 📈 |
| 683 | USDJPY | 01.11.22 13:00 | SELL | 147.235 | 147.711 | 146.283 | 147.711 | SL | -49 | -1.02R | 📈 |
| 684 | USDJPY | 03.11.22 05:00 | SELL | 147.358 | 147.923 | 146.227 | 147.923 | SL | -58 | -1.02R | 📈 |
| 685 | USDJPY | 04.11.22 15:00 | SELL | 147.193 | 147.661 | 146.258 | 146.258 | TP | +92 | +1.97R | 📈 |
| 686 | USDJPY | 10.11.22 16:00 | SELL | 143.715 | 144.381 | 142.384 | 142.384 | TP | +132 | +1.98R | 📈 |
| 687 | USDJPY | 15.11.22 11:00 | SELL | 139.505 | 140.091 | 138.334 | 138.334 | TP | +116 | +1.98R | 📈 |
| 688 | USDJPY | 23.11.22 17:00 | SELL | 139.995 | 140.456 | 139.073 | 139.073 | TP | +91 | +1.97R | 📈 |
| 689 | USDJPY | 28.11.22 05:00 | SELL | 138.519 | 138.952 | 137.653 | 137.653 | TP | +85 | +1.97R | 📈 |
| 690 | USDJPY | 29.11.22 10:00 | SELL | 138.290 | 138.794 | 137.282 | 138.794 | SL | -52 | -1.02R | 📈 |
| 691 | USDJPY | 08.12.22 02:00 | SELL | 136.372 | 136.822 | 135.471 | 136.822 | SL | -46 | -1.03R | 📈 |
| 692 | USDJPY | 08.12.22 18:00 | SELL | 136.509 | 136.981 | 135.565 | 136.981 | SL | -48 | -1.02R | 📈 |
| 693 | USDJPY | 13.12.22 16:00 | SELL | 135.132 | 135.743 | 133.911 | 135.743 | SL | -62 | -1.02R | 📈 |
| 694 | USDJPY | 29.12.22 16:00 | SELL | 133.162 | 133.550 | 132.387 | 132.387 | TP | +76 | +1.97R | 📈 |
| 695 | USDJPY | 04.01.23 10:00 | SELL | 130.241 | 130.781 | 129.161 | 130.781 | SL | -55 | -1.02R | 📈 |
| 696 | USDJPY | 06.01.23 21:00 | SELL | 132.093 | 132.796 | 130.686 | 132.796 | SL | -72 | -1.02R | 📈 |
| 697 | USDJPY | 12.01.23 04:00 | SELL | 131.655 | 132.085 | 130.794 | 130.794 | TP | +85 | +1.97R | 📈 |
| 698 | USDJPY | 18.01.23 19:00 | SELL | 128.448 | 129.320 | 126.705 | 129.320 | SL | -88 | -1.01R | 📈 |
| 699 | USDJPY | 30.01.23 09:00 | SELL | 129.583 | 129.974 | 128.801 | 129.974 | SL | -40 | -1.03R | 📈 |
| 700 | USDJPY | 01.02.23 13:00 | SELL | 129.818 | 130.111 | 129.232 | 129.232 | TP | +57 | +1.96R | 📈 |
| 701 | USDJPY | 03.02.23 16:00 | BUY | 129.940 | 129.462 | 130.896 | 130.896 | TP | +94 | +1.98R | 📈 |
| 702 | USDJPY | 09.02.23 03:00 | BUY | 131.506 | 131.151 | 132.216 | 131.151 | SL | -37 | -1.03R | 📈 |
| 703 | USDJPY | 10.03.23 17:00 | SELL | 134.828 | 135.505 | 133.474 | 133.474 | TP | +134 | +1.98R | 📈 |
| 704 | USDJPY | 15.03.23 15:00 | SELL | 132.653 | 133.324 | 131.311 | 133.324 | SL | -68 | -1.02R | 📈 |
| 705 | USDJPY | 17.03.23 09:00 | SELL | 132.863 | 133.376 | 131.837 | 131.837 | TP | +101 | +1.98R | 📈 |
| 706 | USDJPY | 22.03.23 22:00 | SELL | 131.193 | 131.730 | 130.120 | 130.120 | TP | +106 | +1.98R | 📈 |
| 707 | USDJPY | 28.03.23 08:00 | SELL | 130.611 | 130.978 | 129.877 | 130.978 | SL | -38 | -1.03R | 📈 |
| 708 | USDJPY | 14.04.23 18:00 | BUY | 133.458 | 133.041 | 134.292 | 134.292 | TP | +82 | +1.97R | 📈 |
| 709 | USDJPY | 24.04.23 06:00 | BUY | 134.439 | 134.130 | 135.058 | 134.130 | SL | -32 | -1.04R | 📈 |
| 710 | USDJPY | 25.04.23 16:00 | SELL | 133.913 | 134.249 | 133.241 | 133.241 | TP | +66 | +1.96R | 📈 |
| 711 | USDJPY | 27.04.23 16:00 | BUY | 133.897 | 133.521 | 134.649 | 133.521 | SL | -39 | -1.03R | 📈 |
| 712 | USDJPY | 10.05.23 17:00 | SELL | 134.416 | 134.769 | 133.709 | 134.769 | SL | -37 | -1.03R | 📈 |
| 713 | USDJPY | 07.06.23 04:00 | SELL | 139.370 | 139.611 | 138.888 | 139.611 | SL | -25 | -1.05R | 📈 |
| 714 | USDJPY | 08.06.23 17:00 | SELL | 139.003 | 139.352 | 138.306 | 139.352 | SL | -36 | -1.03R | 📈 |
| 715 | USDJPY | 12.06.23 14:00 | SELL | 139.187 | 139.440 | 138.682 | 139.440 | SL | -26 | -1.05R | 📈 |
| 716 | USDJPY | 18.07.23 11:00 | SELL | 138.222 | 138.546 | 137.574 | 138.546 | SL | -34 | -1.04R | 📈 |
| 717 | USDJPY | 27.07.23 18:00 | BUY | 141.245 | 140.781 | 142.174 | 140.781 | SL | -48 | -1.03R | 📈 |
| 718 | USDJPY | 07.08.23 19:00 | BUY | 142.440 | 142.092 | 143.136 | 143.136 | TP | +68 | +1.97R | 📈 |
| 719 | USDJPY | 21.08.23 13:00 | BUY | 145.764 | 145.472 | 146.348 | 146.348 | TP | +57 | +1.96R | 📈 |
| 720 | USDJPY | 30.08.23 16:00 | SELL | 145.864 | 146.179 | 145.234 | 146.179 | SL | -33 | -1.04R | 📈 |
| 721 | USDJPY | 10.10.23 20:00 | SELL | 148.546 | 148.817 | 148.005 | 148.817 | SL | -28 | -1.04R | 📈 |
| 722 | USDJPY | 15.11.23 21:00 | BUY | 151.369 | 151.009 | 152.088 | 151.009 | SL | -37 | -1.03R | 📈 |
| 723 | USDJPY | 22.11.23 02:00 | SELL | 148.136 | 148.524 | 147.360 | 148.524 | SL | -40 | -1.03R | 📈 |
| 724 | USDJPY | 27.11.23 05:00 | SELL | 149.130 | 149.364 | 148.663 | 148.663 | TP | +46 | +1.95R | 📈 |
| 725 | USDJPY | 01.12.23 20:00 | SELL | 146.841 | 147.360 | 145.803 | 147.360 | SL | -53 | -1.02R | 📈 |
| 726 | USDJPY | 05.12.23 10:00 | SELL | 146.828 | 147.184 | 146.116 | 147.184 | SL | -37 | -1.03R | 📈 |
| 727 | USDJPY | 05.12.23 16:00 | SELL | 146.787 | 147.141 | 146.080 | 147.141 | SL | -37 | -1.03R | 📈 |
| 728 | USDJPY | 07.12.23 05:00 | SELL | 146.848 | 147.135 | 146.275 | 146.275 | TP | +56 | +1.96R | 📈 |
| 729 | USDJPY | 13.12.23 17:00 | SELL | 145.240 | 145.609 | 144.503 | 144.503 | TP | +73 | +1.97R | 📈 |
| 730 | USDJPY | 21.12.23 04:00 | SELL | 143.019 | 143.401 | 142.255 | 142.255 | TP | +75 | +1.97R | 📈 |
| 731 | USDJPY | 27.12.23 19:00 | SELL | 142.047 | 142.344 | 141.453 | 141.453 | TP | +58 | +1.96R | 📈 |
| 732 | USDJPY | 29.12.23 19:00 | SELL | 140.905 | 141.328 | 140.058 | 141.328 | SL | -44 | -1.03R | 📈 |
| 733 | USDJPY | 31.01.24 17:00 | SELL | 146.632 | 147.056 | 145.784 | 147.056 | SL | -44 | -1.03R | 📈 |
| 734 | USDJPY | 02.02.24 16:00 | BUY | 147.958 | 147.531 | 148.811 | 148.811 | TP | +84 | +1.97R | 📈 |
| 735 | USDJPY | 08.02.24 04:00 | BUY | 148.283 | 147.992 | 148.865 | 148.865 | TP | +57 | +1.96R | 📈 |
| 736 | USDJPY | 29.02.24 04:00 | SELL | 150.203 | 150.393 | 149.824 | 149.824 | TP | +37 | +1.94R | 📈 |
| 737 | USDJPY | 04.03.24 01:00 | SELL | 150.103 | 150.352 | 149.605 | 150.352 | SL | -26 | -1.05R | 📈 |
| 738 | USDJPY | 05.03.24 17:00 | SELL | 150.087 | 150.275 | 149.711 | 149.711 | TP | +36 | +1.94R | 📈 |
| 739 | USDJPY | 02.05.24 00:00 | SELL | 154.830 | 155.630 | 153.230 | 155.630 | SL | -81 | -1.01R | 📈 |
| 740 | USDJPY | 15.05.24 12:00 | SELL | 155.640 | 155.890 | 155.141 | 155.141 | TP | +49 | +1.95R | 📈 |
| 741 | USDJPY | 31.05.24 18:00 | BUY | 157.153 | 156.805 | 157.850 | 156.805 | SL | -36 | -1.03R | 📈 |
| 742 | USDJPY | 07.06.24 02:00 | SELL | 155.606 | 155.954 | 154.910 | 155.954 | SL | -36 | -1.03R | 📈 |
| 743 | USDJPY | 12.06.24 16:00 | SELL | 156.157 | 156.455 | 155.562 | 156.455 | SL | -31 | -1.04R | 📈 |
| 744 | USDJPY | 08.07.24 17:00 | SELL | 160.650 | 160.965 | 160.020 | 160.965 | SL | -33 | -1.04R | 📈 |
| 745 | USDJPY | 11.07.24 16:00 | SELL | 158.630 | 159.119 | 157.652 | 157.652 | TP | +97 | +1.98R | 📈 |
| 746 | USDJPY | 17.07.24 09:00 | SELL | 157.876 | 158.145 | 157.338 | 157.338 | TP | +53 | +1.96R | 📈 |
| 747 | USDJPY | 22.07.24 11:00 | SELL | 156.801 | 157.199 | 156.005 | 156.005 | TP | +78 | +1.97R | 📈 |
| 748 | USDJPY | 29.07.24 10:00 | SELL | 153.345 | 153.924 | 152.186 | 153.924 | SL | -59 | -1.02R | 📈 |
| 749 | USDJPY | 30.07.24 21:00 | SELL | 153.194 | 153.767 | 152.048 | 153.767 | SL | -59 | -1.02R | 📈 |
| 750 | USDJPY | 13.08.24 20:00 | SELL | 146.727 | 147.160 | 145.861 | 147.160 | SL | -45 | -1.03R | 📈 |
| 751 | USDJPY | 14.08.24 15:00 | SELL | 146.884 | 147.334 | 145.983 | 147.334 | SL | -46 | -1.03R | 📈 |
| 752 | USDJPY | 14.08.24 18:00 | SELL | 146.757 | 147.315 | 145.641 | 147.315 | SL | -57 | -1.02R | 📈 |
| 753 | USDJPY | 21.08.24 17:00 | SELL | 145.738 | 146.197 | 144.820 | 146.197 | SL | -47 | -1.03R | 📈 |
| 754 | USDJPY | 23.08.24 19:00 | SELL | 144.859 | 145.470 | 143.637 | 143.637 | TP | +121 | +1.98R | 📈 |
| 755 | USDJPY | 10.09.24 19:00 | SELL | 142.280 | 142.754 | 141.332 | 141.332 | TP | +94 | +1.98R | 📈 |
| 756 | USDJPY | 12.09.24 23:00 | SELL | 141.859 | 142.421 | 140.734 | 140.734 | TP | +111 | +1.98R | 📈 |
| 757 | USDJPY | 05.11.24 17:00 | SELL | 151.827 | 152.155 | 151.170 | 152.155 | SL | -34 | -1.04R | 📈 |
| 758 | USDJPY | 21.11.24 12:00 | SELL | 154.392 | 154.855 | 153.465 | 154.855 | SL | -48 | -1.03R | 📈 |
| 759 | USDJPY | 22.11.24 12:00 | SELL | 154.493 | 154.965 | 153.548 | 154.965 | SL | -48 | -1.02R | 📈 |
| 760 | USDJPY | 25.11.24 16:00 | SELL | 153.920 | 154.389 | 152.982 | 154.389 | SL | -48 | -1.03R | 📈 |
| 761 | USDJPY | 26.11.24 03:00 | SELL | 154.005 | 154.474 | 153.068 | 153.068 | TP | +93 | +1.97R | 📈 |
| 762 | USDJPY | 02.12.24 10:00 | SELL | 150.245 | 150.745 | 149.245 | 149.245 | TP | +99 | +1.98R | 📈 |
| 763 | USDJPY | 03.12.24 15:00 | SELL | 149.675 | 150.123 | 148.780 | 148.780 | TP | +88 | +1.97R | 📈 |
| 764 | USDJPY | 06.12.24 06:00 | SELL | 149.875 | 150.252 | 149.121 | 150.252 | SL | -39 | -1.03R | 📈 |
| 765 | USDJPY | 06.12.24 17:00 | SELL | 149.663 | 150.131 | 148.726 | 150.131 | SL | -48 | -1.03R | 📈 |
| 766 | USDJPY | 06.01.25 16:00 | SELL | 156.608 | 157.032 | 155.759 | 157.032 | SL | -44 | -1.03R | 📈 |
| 767 | USDJPY | 15.01.25 09:00 | SELL | 157.339 | 157.695 | 156.627 | 156.627 | TP | +70 | +1.97R | 📈 |
| 768 | USDJPY | 20.01.25 22:00 | SELL | 155.629 | 156.040 | 154.808 | 156.040 | SL | -42 | -1.03R | 📈 |
| 769 | USDJPY | 21.01.25 18:00 | SELL | 155.320 | 155.815 | 154.330 | 155.815 | SL | -51 | -1.02R | 📈 |
| 770 | USDJPY | 22.01.25 03:00 | SELL | 155.414 | 155.819 | 154.604 | 155.819 | SL | -42 | -1.03R | 📈 |
| 771 | USDJPY | 27.01.25 01:00 | SELL | 155.778 | 156.254 | 154.825 | 154.825 | TP | +94 | +1.98R | 📈 |
| 772 | USDJPY | 29.01.25 20:00 | SELL | 155.048 | 155.421 | 154.303 | 155.421 | SL | -38 | -1.03R | 📈 |
| 773 | USDJPY | 30.01.25 03:00 | SELL | 154.711 | 155.108 | 153.918 | 153.918 | TP | +78 | +1.97R | 📈 |
| 774 | USDJPY | 04.02.25 20:00 | SELL | 154.259 | 154.689 | 153.399 | 153.399 | TP | +85 | +1.97R | 📈 |
| 775 | USDJPY | 13.02.25 20:00 | SELL | 153.156 | 153.588 | 152.292 | 152.292 | TP | +85 | +1.97R | 📈 |
| 776 | USDJPY | 19.02.25 12:00 | SELL | 151.643 | 151.951 | 151.026 | 151.026 | TP | +60 | +1.96R | 📈 |
| 777 | USDJPY | 21.02.25 17:00 | SELL | 149.806 | 150.257 | 148.904 | 148.904 | TP | +89 | +1.97R | 📈 |
| 778 | USDJPY | 24.02.25 17:00 | SELL | 149.314 | 149.725 | 148.492 | 149.725 | SL | -42 | -1.03R | 📈 |
| 779 | USDJPY | 25.02.25 17:00 | SELL | 149.170 | 149.632 | 148.246 | 149.632 | SL | -47 | -1.03R | 📈 |
| 780 | USDJPY | 26.02.25 21:00 | SELL | 148.914 | 149.367 | 148.008 | 149.367 | SL | -46 | -1.03R | 📈 |
| 781 | USDJPY | 27.02.25 07:00 | SELL | 149.089 | 149.489 | 148.289 | 149.489 | SL | -41 | -1.03R | 📈 |
| 782 | USDJPY | 03.03.25 23:00 | SELL | 149.400 | 149.962 | 148.276 | 148.276 | TP | +111 | +1.98R | 📈 |
| 783 | USDJPY | 05.03.25 16:00 | SELL | 149.012 | 149.584 | 147.869 | 147.869 | TP | +113 | +1.98R | 📈 |
| 784 | USDJPY | 10.03.25 01:00 | SELL | 147.465 | 148.074 | 146.246 | 148.074 | SL | -62 | -1.02R | 📈 |
| 785 | USDJPY | 13.03.25 20:00 | SELL | 147.619 | 148.060 | 146.737 | 148.060 | SL | -45 | -1.03R | 📈 |
| 786 | USDJPY | 21.03.25 05:00 | BUY | 149.063 | 148.728 | 149.733 | 148.728 | SL | -35 | -1.04R | 📈 |
| 787 | USDJPY | 01.04.25 13:00 | SELL | 149.623 | 150.008 | 148.854 | 150.008 | SL | -40 | -1.03R | 📈 |
| 788 | USDJPY | 03.04.25 01:00 | SELL | 148.698 | 149.208 | 147.678 | 147.678 | TP | +101 | +1.98R | 📈 |
| 789 | USDJPY | 07.04.25 01:00 | SELL | 145.604 | 146.610 | 143.593 | 146.610 | SL | -102 | -1.01R | 📈 |
| 790 | USDJPY | 07.04.25 08:00 | SELL | 145.878 | 146.854 | 143.927 | 146.854 | SL | -99 | -1.01R | 📈 |
| 791 | USDJPY | 09.04.25 00:00 | SELL | 146.142 | 146.821 | 144.783 | 144.783 | TP | +135 | +1.98R | 📈 |
| 792 | USDJPY | 15.04.25 14:00 | SELL | 142.843 | 143.364 | 141.801 | 141.801 | TP | +103 | +1.98R | 📈 |
| 793 | USDJPY | 17.04.25 17:00 | SELL | 142.142 | 142.610 | 141.207 | 142.610 | SL | -48 | -1.03R | 📈 |
| 794 | USDJPY | 18.04.25 06:00 | SELL | 142.313 | 142.658 | 141.623 | 141.623 | TP | +68 | +1.97R | 📈 |
| 795 | USDJPY | 19.05.25 02:00 | SELL | 145.163 | 145.574 | 144.341 | 144.341 | TP | +81 | +1.97R | 📈 |
| 796 | USDJPY | 23.05.25 07:00 | SELL | 143.437 | 143.829 | 142.653 | 142.653 | TP | +77 | +1.97R | 📈 |
| 797 | USDJPY | 29.05.25 20:00 | SELL | 144.146 | 144.633 | 143.173 | 143.173 | TP | +96 | +1.98R | 📈 |
| 798 | USDJPY | 04.06.25 20:00 | SELL | 142.642 | 143.139 | 141.648 | 143.139 | SL | -51 | -1.02R | 📈 |
| 799 | USDJPY | 25.06.25 14:00 | BUY | 145.729 | 145.376 | 146.434 | 145.376 | SL | -36 | -1.03R | 📈 |
| 800 | USDJPY | 30.06.25 06:00 | SELL | 144.293 | 144.678 | 143.523 | 143.523 | TP | +76 | +1.97R | 📈 |
| 801 | USDJPY | 05.08.25 18:00 | SELL | 147.448 | 147.831 | 146.681 | 147.831 | SL | -40 | -1.03R | 📈 |
| 802 | USDJPY | 06.08.25 21:00 | SELL | 147.240 | 147.561 | 146.599 | 147.561 | SL | -33 | -1.04R | 📈 |
| 803 | USDJPY | 07.08.25 10:00 | SELL | 146.857 | 147.211 | 146.148 | 147.211 | SL | -37 | -1.03R | 📈 |
| 804 | USDJPY | 08.08.25 01:00 | SELL | 147.018 | 147.384 | 146.286 | 147.384 | SL | -38 | -1.03R | 📈 |
| 805 | USDJPY | 20.08.25 16:00 | SELL | 147.275 | 147.558 | 146.709 | 147.558 | SL | -29 | -1.04R | 📈 |
| 806 | USDJPY | 26.08.25 19:00 | SELL | 147.316 | 147.640 | 146.667 | 147.640 | SL | -34 | -1.04R | 📈 |
| 807 | USDJPY | 28.08.25 00:00 | SELL | 147.362 | 147.632 | 146.823 | 146.823 | TP | +53 | +1.96R | 📈 |
| 808 | USDJPY | 29.08.25 18:00 | SELL | 146.827 | 147.123 | 146.236 | 147.123 | SL | -31 | -1.04R | 📈 |
| 809 | USDJPY | 01.09.25 09:00 | SELL | 146.915 | 147.183 | 146.380 | 147.183 | SL | -28 | -1.04R | 📈 |
| 810 | USDJPY | 11.09.25 20:00 | SELL | 147.055 | 147.359 | 146.446 | 147.359 | SL | -32 | -1.04R | 📈 |
| 811 | USDJPY | 15.09.25 14:00 | SELL | 147.391 | 147.617 | 146.940 | 146.940 | TP | +44 | +1.95R | 📈 |
| 812 | USDJPY | 13.10.25 22:00 | BUY | 152.285 | 151.956 | 152.943 | 151.956 | SL | -34 | -1.04R | 📈 |
| 813 | USDJPY | 29.10.25 16:00 | SELL | 152.002 | 152.368 | 151.271 | 152.368 | SL | -38 | -1.03R | 📈 |
| 814 | USDJPY | 28.11.25 16:00 | SELL | 156.021 | 156.246 | 155.570 | 156.246 | SL | -24 | -1.05R | 📈 |
| 815 | USDJPY | 28.11.25 18:00 | SELL | 156.028 | 156.299 | 155.485 | 155.485 | TP | +53 | +1.96R | 📈 |
| 816 | USDJPY | 03.12.25 13:00 | SELL | 155.524 | 155.748 | 155.076 | 155.076 | TP | +44 | +1.95R | 📈 |
| 817 | USDJPY | 12.12.25 14:00 | BUY | 155.910 | 155.651 | 156.428 | 155.651 | SL | -27 | -1.05R | 📈 |
| 818 | USDJPY | 15.12.25 05:00 | SELL | 155.427 | 155.708 | 154.866 | 154.866 | TP | +55 | +1.96R | 📈 |
| Total: 336 | +1,207 | +45.3R | |||||||||
All yen trades — both the first version (818 over 2008–2025) and Puria 2.0 (1,030 over 2008–2026) — are in the Excel journal on separate sheets.
Common mistakes
- Trading the classic version with a 10–20 pip take profit. The test shows that over the long run the spread eats the whole result.
- Entering before the bar closes. EMA 5 and MACD “repaint” inside the candle. The signal exists only on a closed bar.
- Building the LWMAs only on Low. Then there are almost no buys. For buys in Puria 2.0 the LWMAs are built on High.
- Trading against the H4 and weekly trend. Without these filters there are more trades and the result is worse.
- Using a fixed stop whatever the volatility. On gold the stop grew from $6 to $35 in 18 years — fixed pips do not work here.
- Selling USDJPY during interventions. In 2026 all such sells closed at the stop.
- Trading every pair from the author’s table. Even Puria 2.0 stays profitable only on trending instruments — gold and partly the yen.
- Trusting 3-month tests. Our old 3–12 month test was profitable, while 17 years of history showed a loss.
FAQ: common questions about the Puria Method
Does the Puria Method work in 2026?
The classic version — no: 13,002 trades over 2008–2024 gave −19,276 pips. Puria 2.0 on gold — yes: in 2026 (January–October) +10.6R on 40 trades, and the rules were chosen before 2024. On USDJPY in 2026 only buys are profitable (+2.7R), sells are negative.
Why gold?
The Puria signal is a trend signal, and over the last 18 years gold has moved in long trends. We tested the same rules on 33 instruments: most currency pairs show no edge. Among instruments with history from 2008, Puria 2.0 is profitable on 2008–2023 only on gold and USDJPY, and in 2026 only gold stayed profitable.
Isn’t this curve fitting?
We did everything to avoid it: the rules were chosen on 2008–2023, the stop and take profit were taken from the first version unchanged, and 2024–2026 was tested “blind”. All 16 neighbouring stop and take profit combinations are profitable too. The risk cannot be ruled out completely — that is why we will keep updating the statistics.
Can moving the stop to breakeven make the classic version profitable?
We tested moving to breakeven after +8, +10 and +12 pips. On all three pairs the result stayed negative — at about the same level.
Must MACD confirm on the same candle, or can it be later?
The main test is strict: MACD on the crossing candle. The soft variant (confirmation within 3 candles) makes the classic version even worse. For the first improved version on USDJPY it gave +3,578 pips instead of +2,692, but mirrored LWMAs solve the same problem more simply and more honestly.
Which timeframe is best?
H1. On M30 there are too many false crossings, on H4 there are few trades and the result is unstable.
Is there an EA for the Puria Method?
There is no ready-made EA. The strategy is mechanical — it is easy to automate. For manual trading there is a ready-made Puria 2.0 template for MT4: red LWMA 85 and 75 on Low (sells), green ones on High (buys), a blue EMA 5, MACD 15/26/1 and ATR 14 for the stop. The orange EMA 50 is shown only on H4 and EMA 20 only on W1: switch the timeframe to check the trend. The lot is easy to calculate with our free S4U.PRO Trade Panel EA.
Is this guaranteed profit?
No. A test is history, not a promise. Even on gold there was a −16R year and 12 stops in a row. Trade only with money you can afford to lose, and test the strategy on a demo account first.
Video: the Puria Method tested on real trades
The strategy author’s old video:
Conclusion
The Puria Method in its original form — M30, a 14-pip stop and a 10–25 pip take profit — is not profitable over the long history: a loss on all four pairs tested, −19,276 pips over 17 years. The problem is not the indicators but the small take profit, which the spread eats up.
Puria 2.0 — H1, H4 and weekly trend, mirrored LWMAs, stop 1.5 ATR and take profit 2R — made +108R on 994 trades on gold over 2008–2026, with 14 profitable years out of 19. We fixed the rules on 2008–2023, and 2026, which took no part in the choice, is profitable too: +10.6R. This is not “50 pips a day” but about +0.1R per trade — modest, but tested and without martingale.
On USDJPY the strategy worked until 2025, but in 2026 sells against the weakening yen — amid interventions — kept closing at the stop. Our conclusion: today the main instrument for the Puria Method is gold; on USDJPY only buys and with caution, no sells. Start with a demo account. If you want another tested strategy on gold, see FVG on gold (185 trades with a journal).
Another gold strategy we tested: the Kortik (Dirk) strategy (XAUUSD, W1+D1+H1) backtested over 21 years. The author’s classic rules made +112R on 589 trades in 2005–2026, and Kortik 2.0 with a proper stop made +134R, with 2026 in profit too.
This article is for educational purposes only and is not investment advice. Trading Forex and CFDs carries a high risk of losing money. Past results do not guarantee future profits. Data: MetaTrader 4 price history (Alpari, terminal time GMT+2/+3) for 2008–2025; 2026 — Yahoo Finance hourly candles (UTC), gold — COMEX futures (GC). Quotes at your broker may differ slightly.