Contents 2
The «Dirk» (Kortik) forex strategy is a conservative strategy. Its author trades only one instrument but notes that it can also be applied to others; however, we recommend checking its performance on them at least on historical data first.
Trades are very rare, but the signals are quite reliable. The system suits «passive traders» well or works as an add-on to your main systems.
Statistics:
From January 2016 to the end of December 2018 the strategy gave only about 10 signals. Over this period the profit was around +200% (the author risks 5% of the initial deposit per trade). The drawdown did not exceed 5%.
- Instrument: XAUUSD (gold).
- Higher timeframe: W1.
- Middle timeframe: D1.
- Lower timeframe: H1.
- No indicators needed.
Buy rules of the «Dirk» forex strategy
We check the signals on 3 timeframes in sequence:
Weekly chart
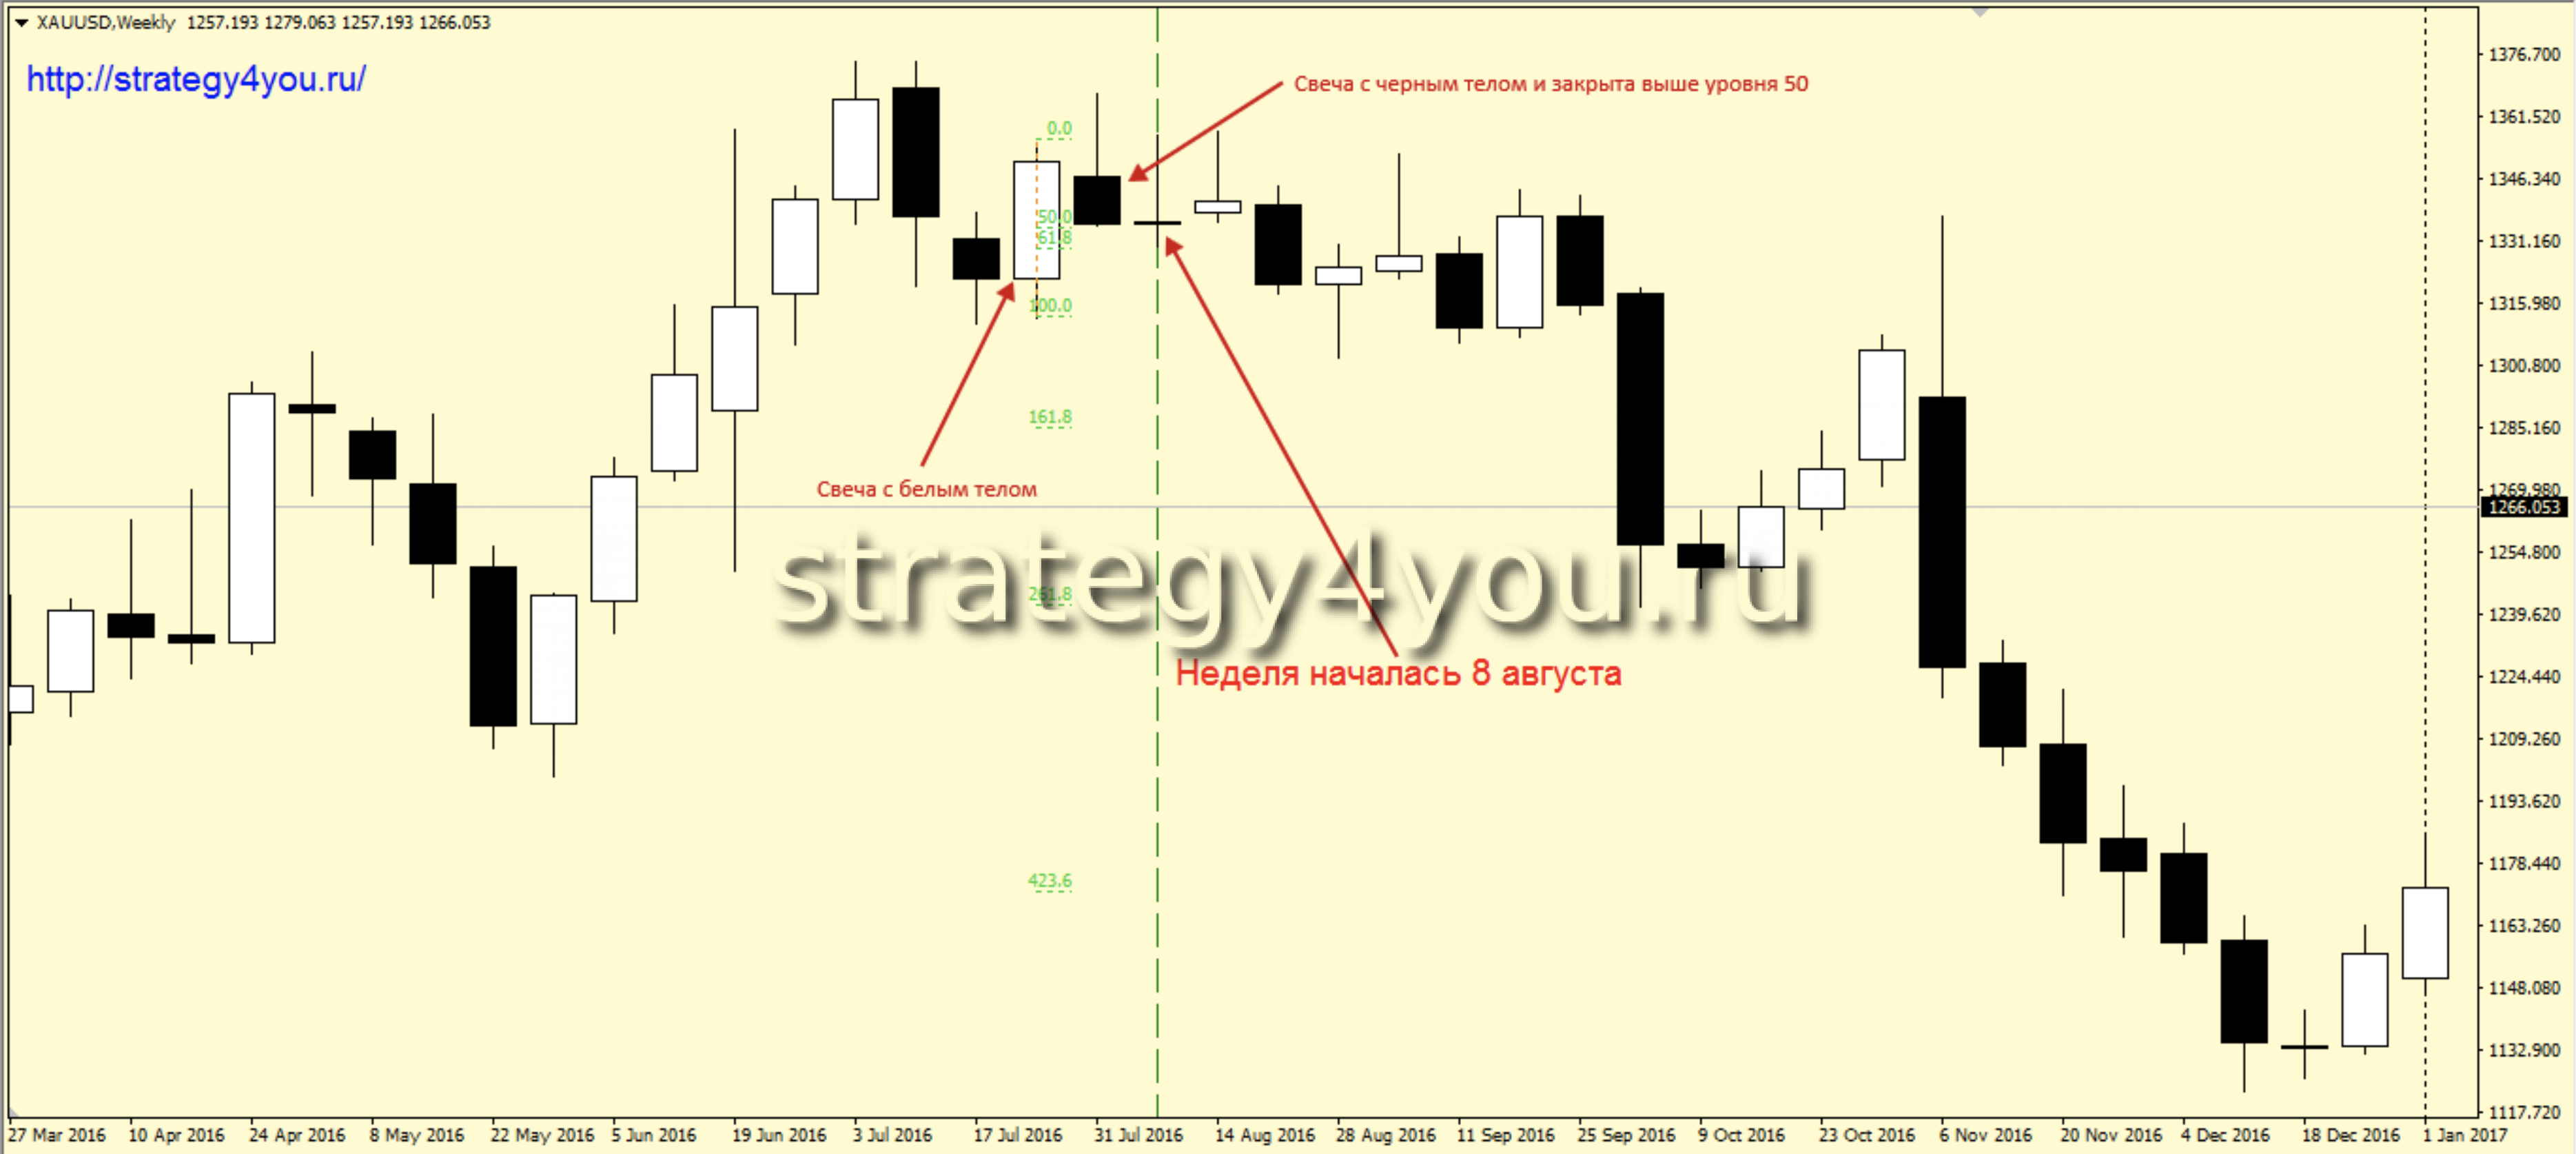
1) A white candle forms on the weekly chart (its upper wick must not be equal to or longer than the body).
2) The next weekly candle closes above the 50 Fibonacci level drawn from the low to the high of the previous candle. The 61.8 level of the same Fibonacci was not broken by the wick.
Daily chart
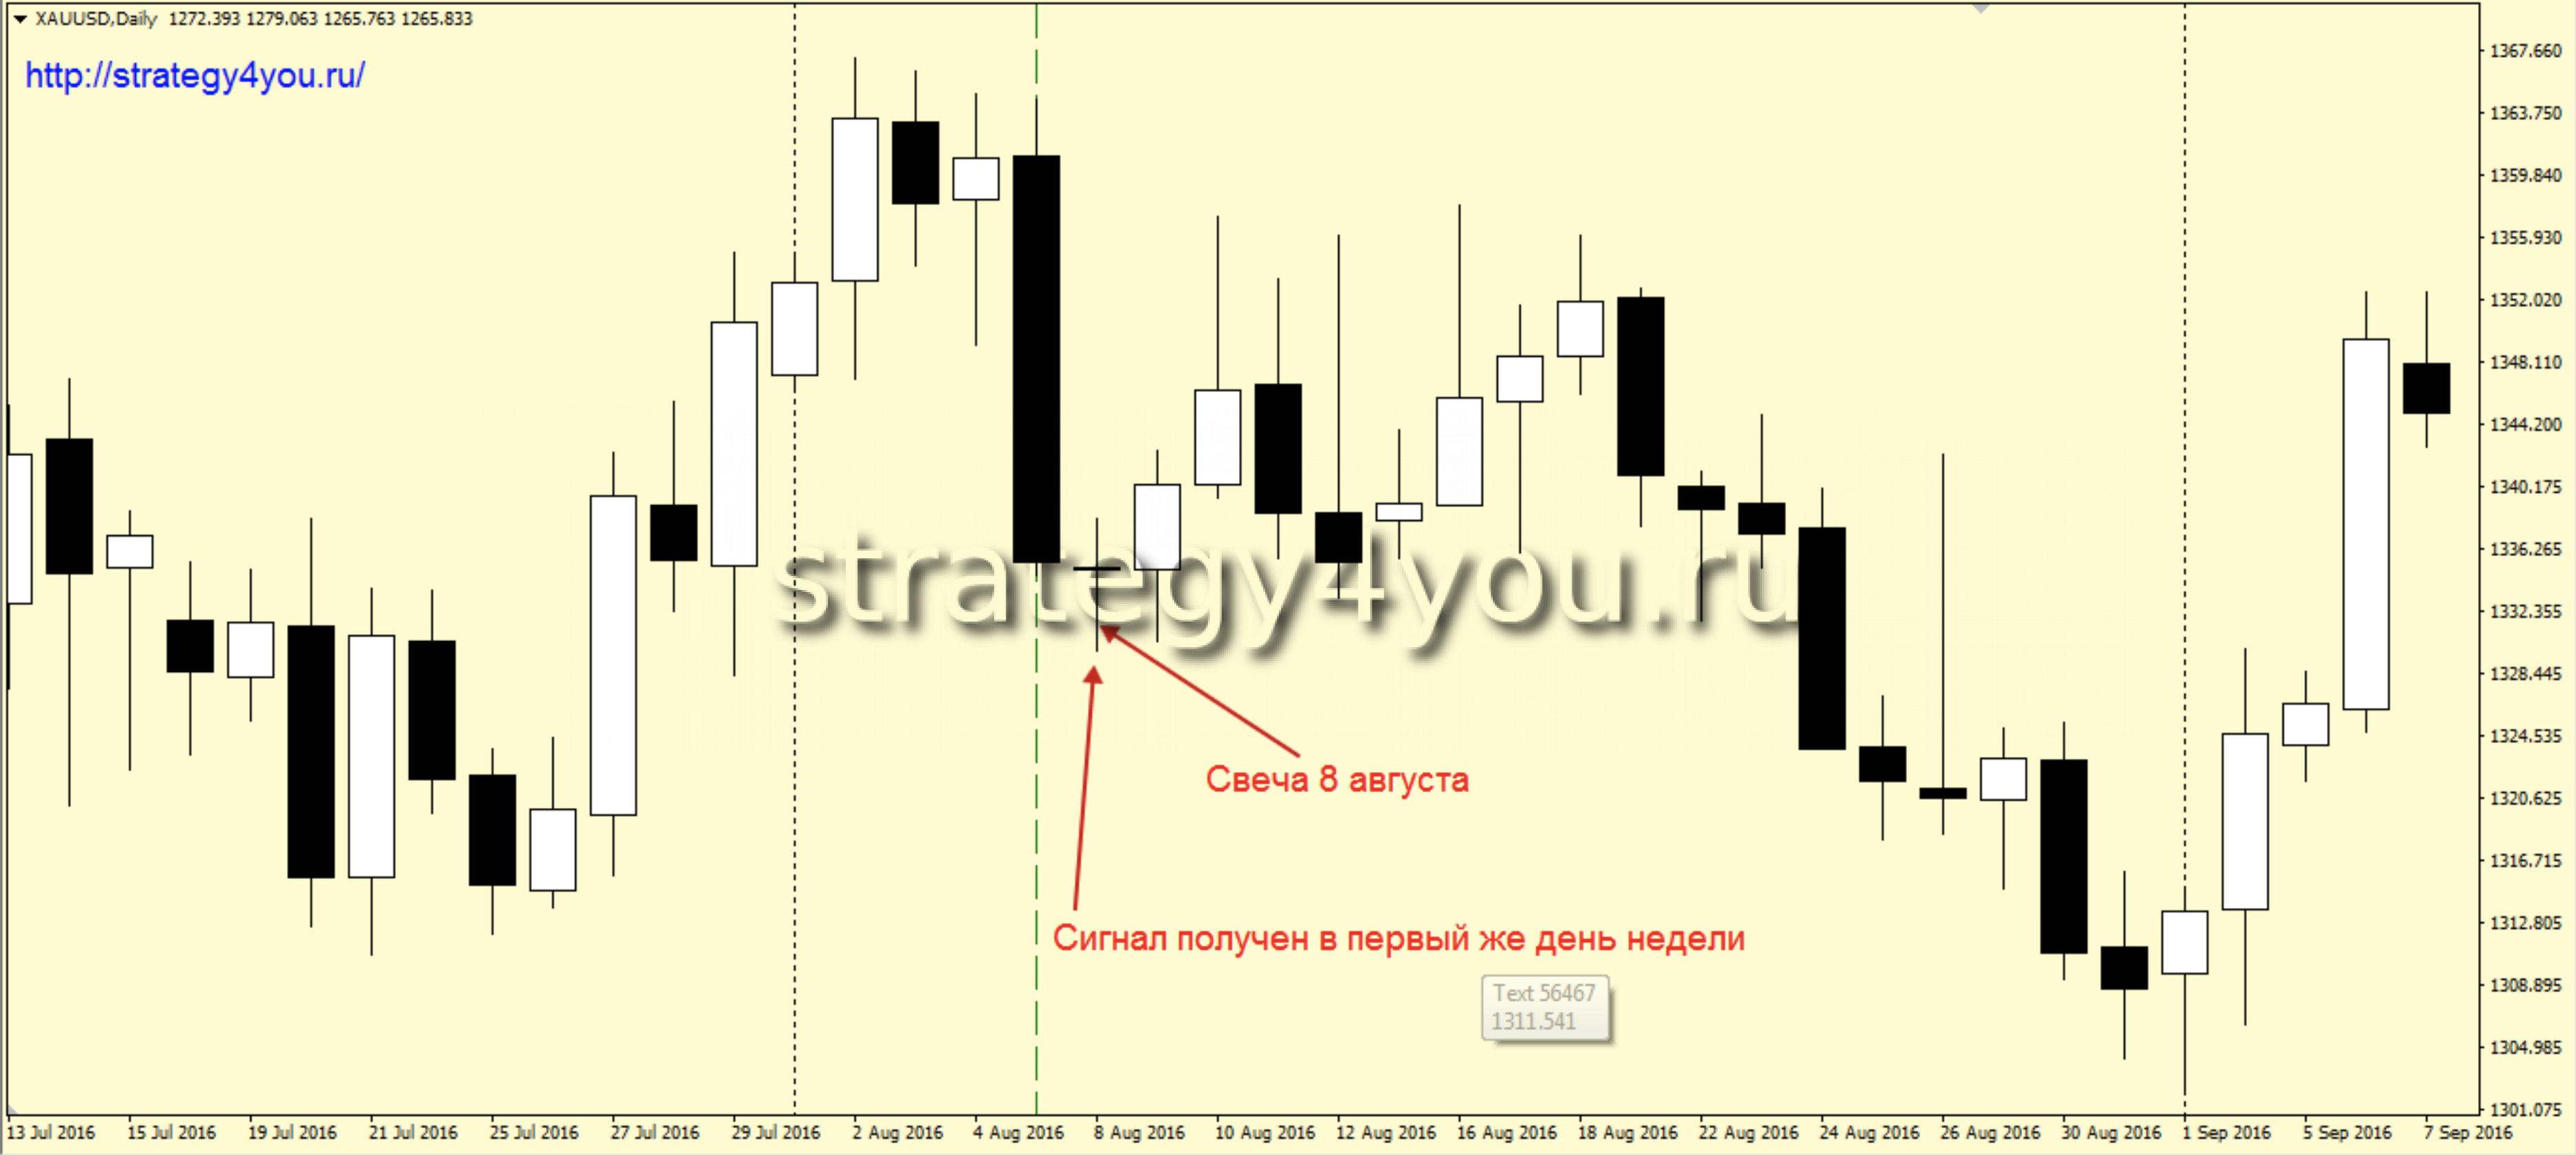
3) A candle with a lower wick greater than or equal to its body forms on the daily chart (a rejection candle).
4) This signal is expected only within one trading week.
H1 chart
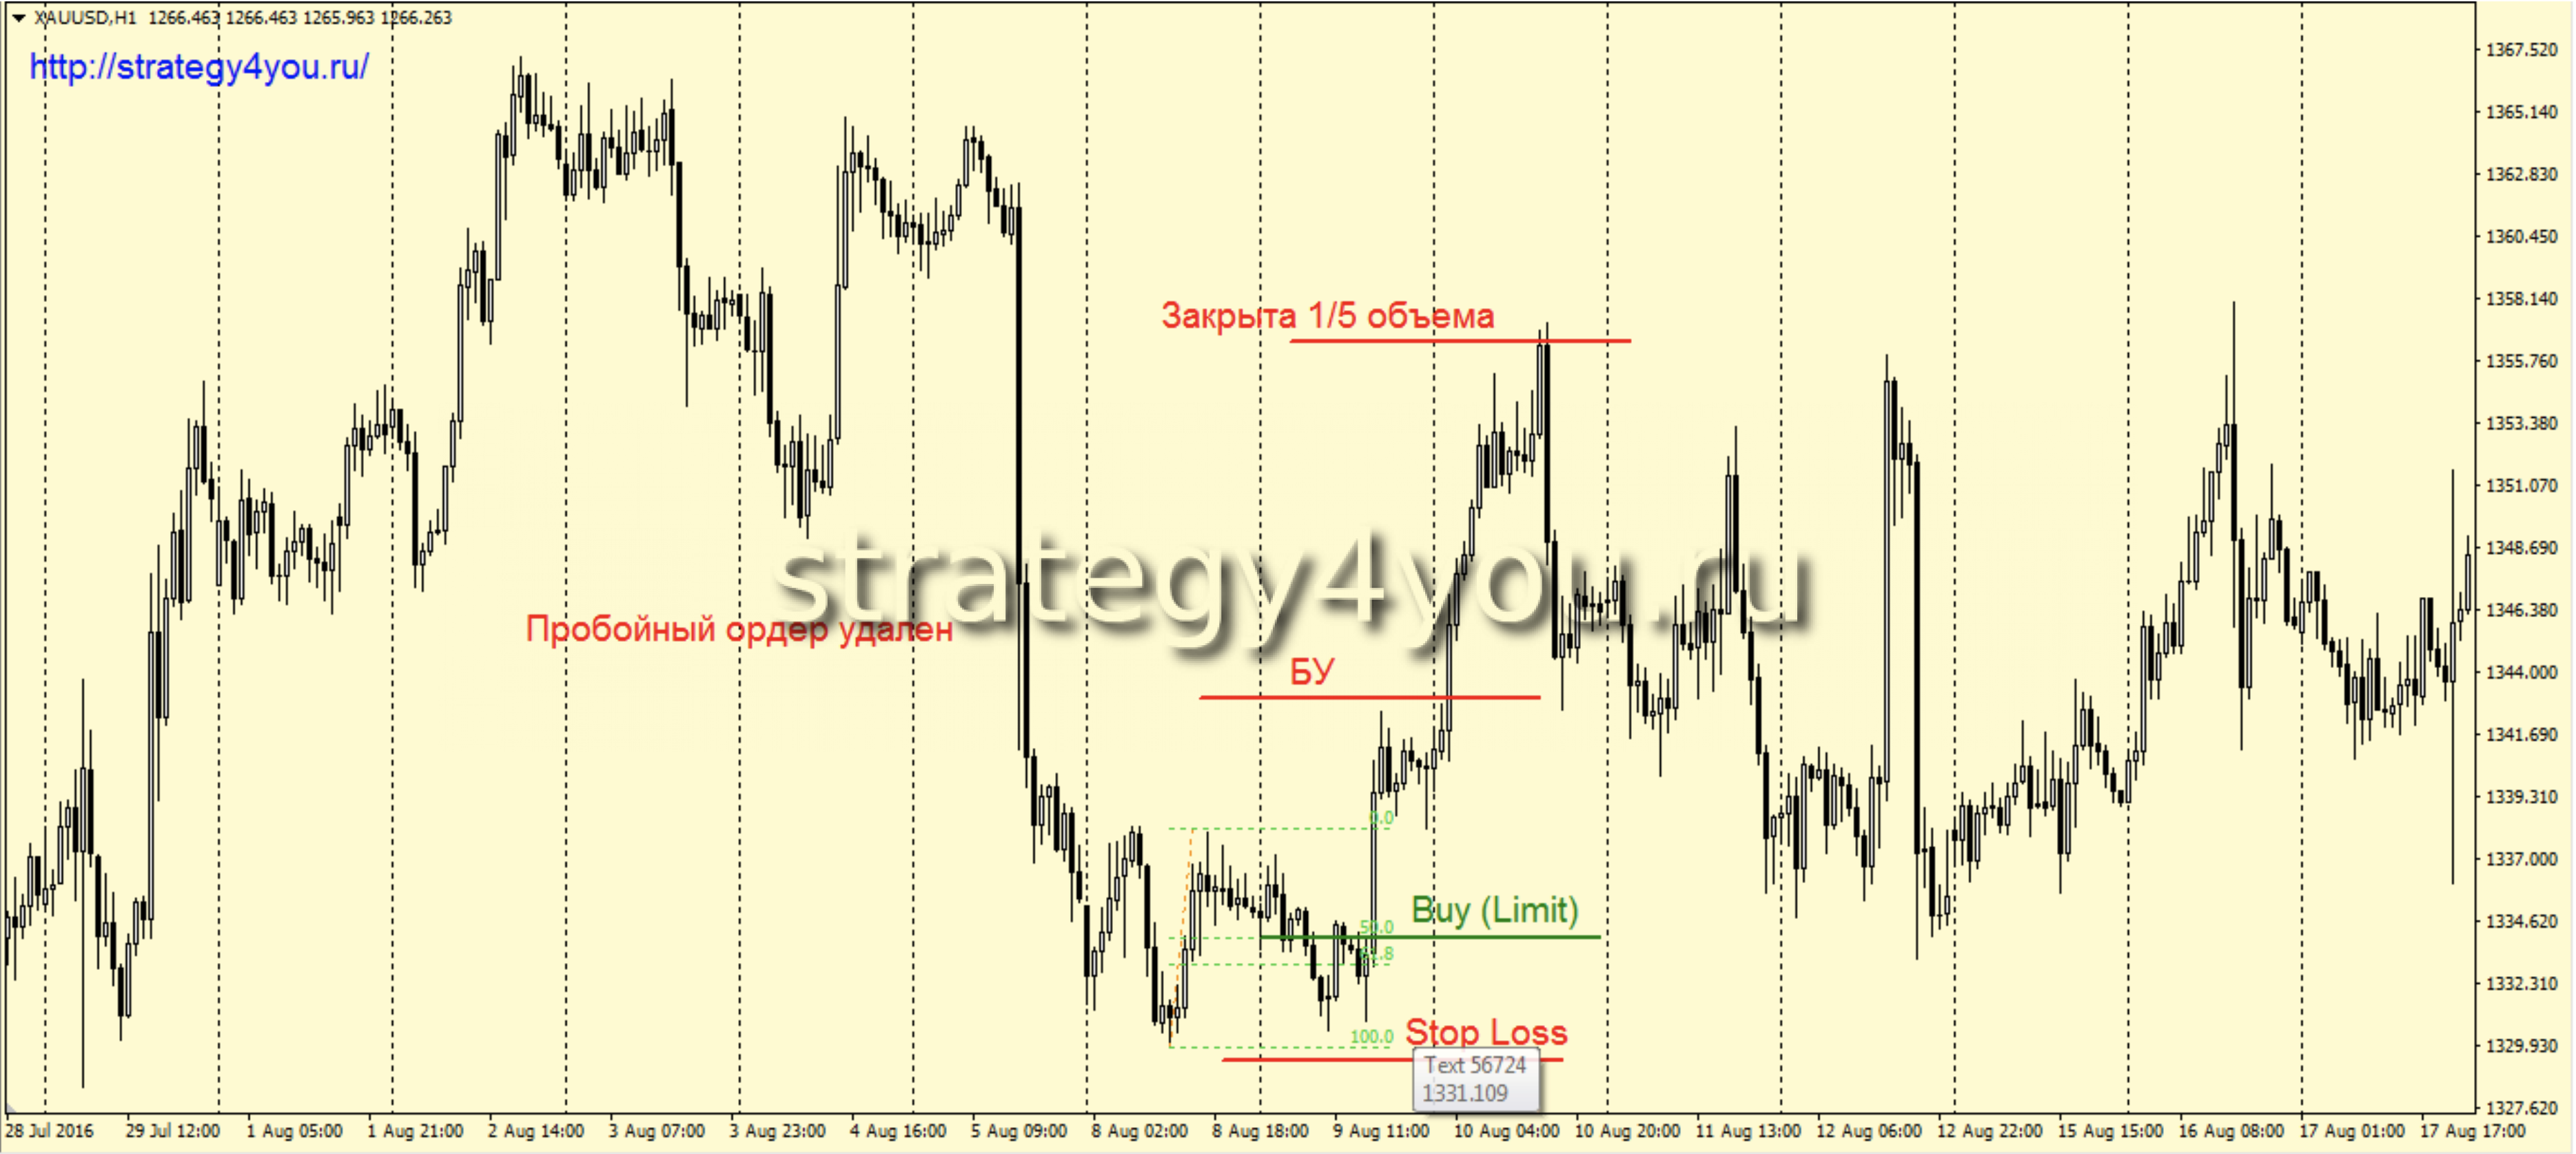
5) On the hourly chart there are two entry options:
Option 1:
1.1) Place a Buy Stop breakout order above the high of the previous candle.
1.2) In this case the Stop Loss goes below the 50 Fibonacci level drawn over the last upward move from the previous day’s low.
1.3) If the trading day opens right at the previous day’s high, wait for a visible pullback and only then place the breakout order at the high.
1.4) The breakout order is placed only after the second hourly candle of the trading day. Before that, this entry is not considered.
Option 2:
2.1) Draw a Fibonacci grid over the last clear upward move, with its low from the previous day.
2.2) Place a Buy Limit order at the 50 level of this grid.
2.3) If at the day’s open the price is already at the 50 level, place the limit order at 61.8.
2.4) The Stop Loss goes beyond the previous day’s low.
2.5) If the correct stop placement turns out to be more than 100 pips away, place the limit order at 61.8.
2.6) The Stop Loss must be no less than 45 and no more than 60 pips ($4.5 and $6 in the price terms of this instrument).
Continued rules for Option 1 and Option 2
6) Once the trade has gained twice the stop size, move it to breakeven.
7) When the price reaches five times the stop size, close 1/5 of the position volume.
8 ) Take profit when the price has moved 10 times the stop size.
9) The recommended risk per trade is 5% of the initial deposit.
10) If after a signal on the weekly chart the next week opens with a GAP larger than the body of the previous candle, the signal is ignored.
Sell rules
Just as for buys, we check the signals on 3 timeframes in sequence:
Weekly timeframe
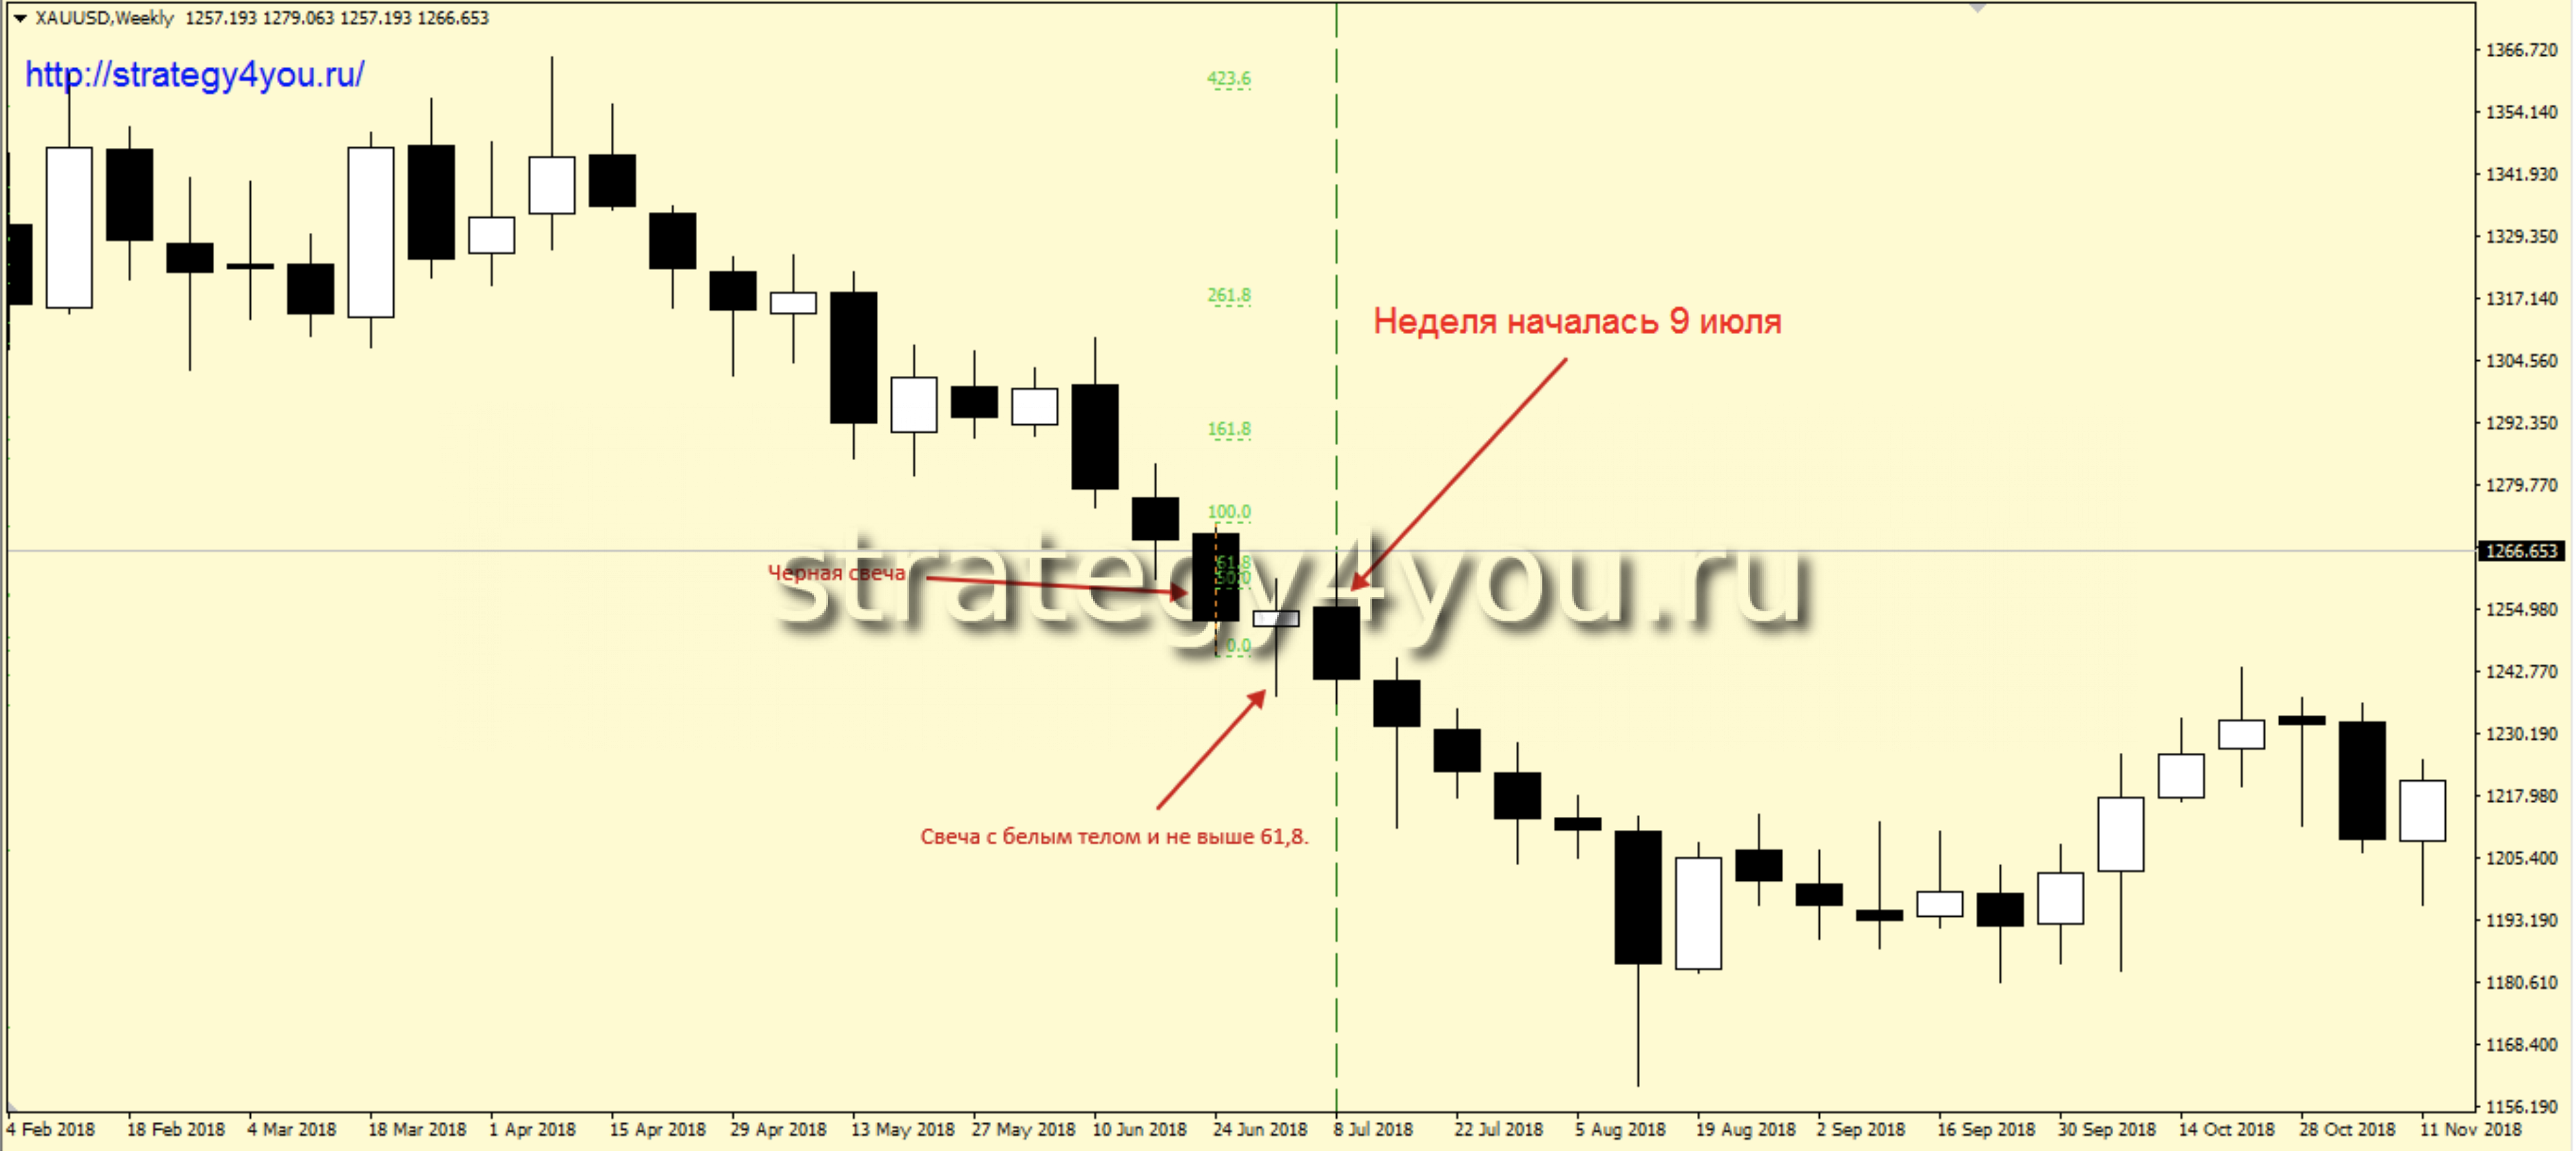
1) A black candle forms on the W1 chart (required: the lower wick must not be equal to or longer than the body).
2) The next W1 candle closes below the 50% Fibonacci level drawn from the high to the low of the previous candle. The main condition: the 61.8% level of the same Fibonacci was not broken by the wick.
Daily timeframe
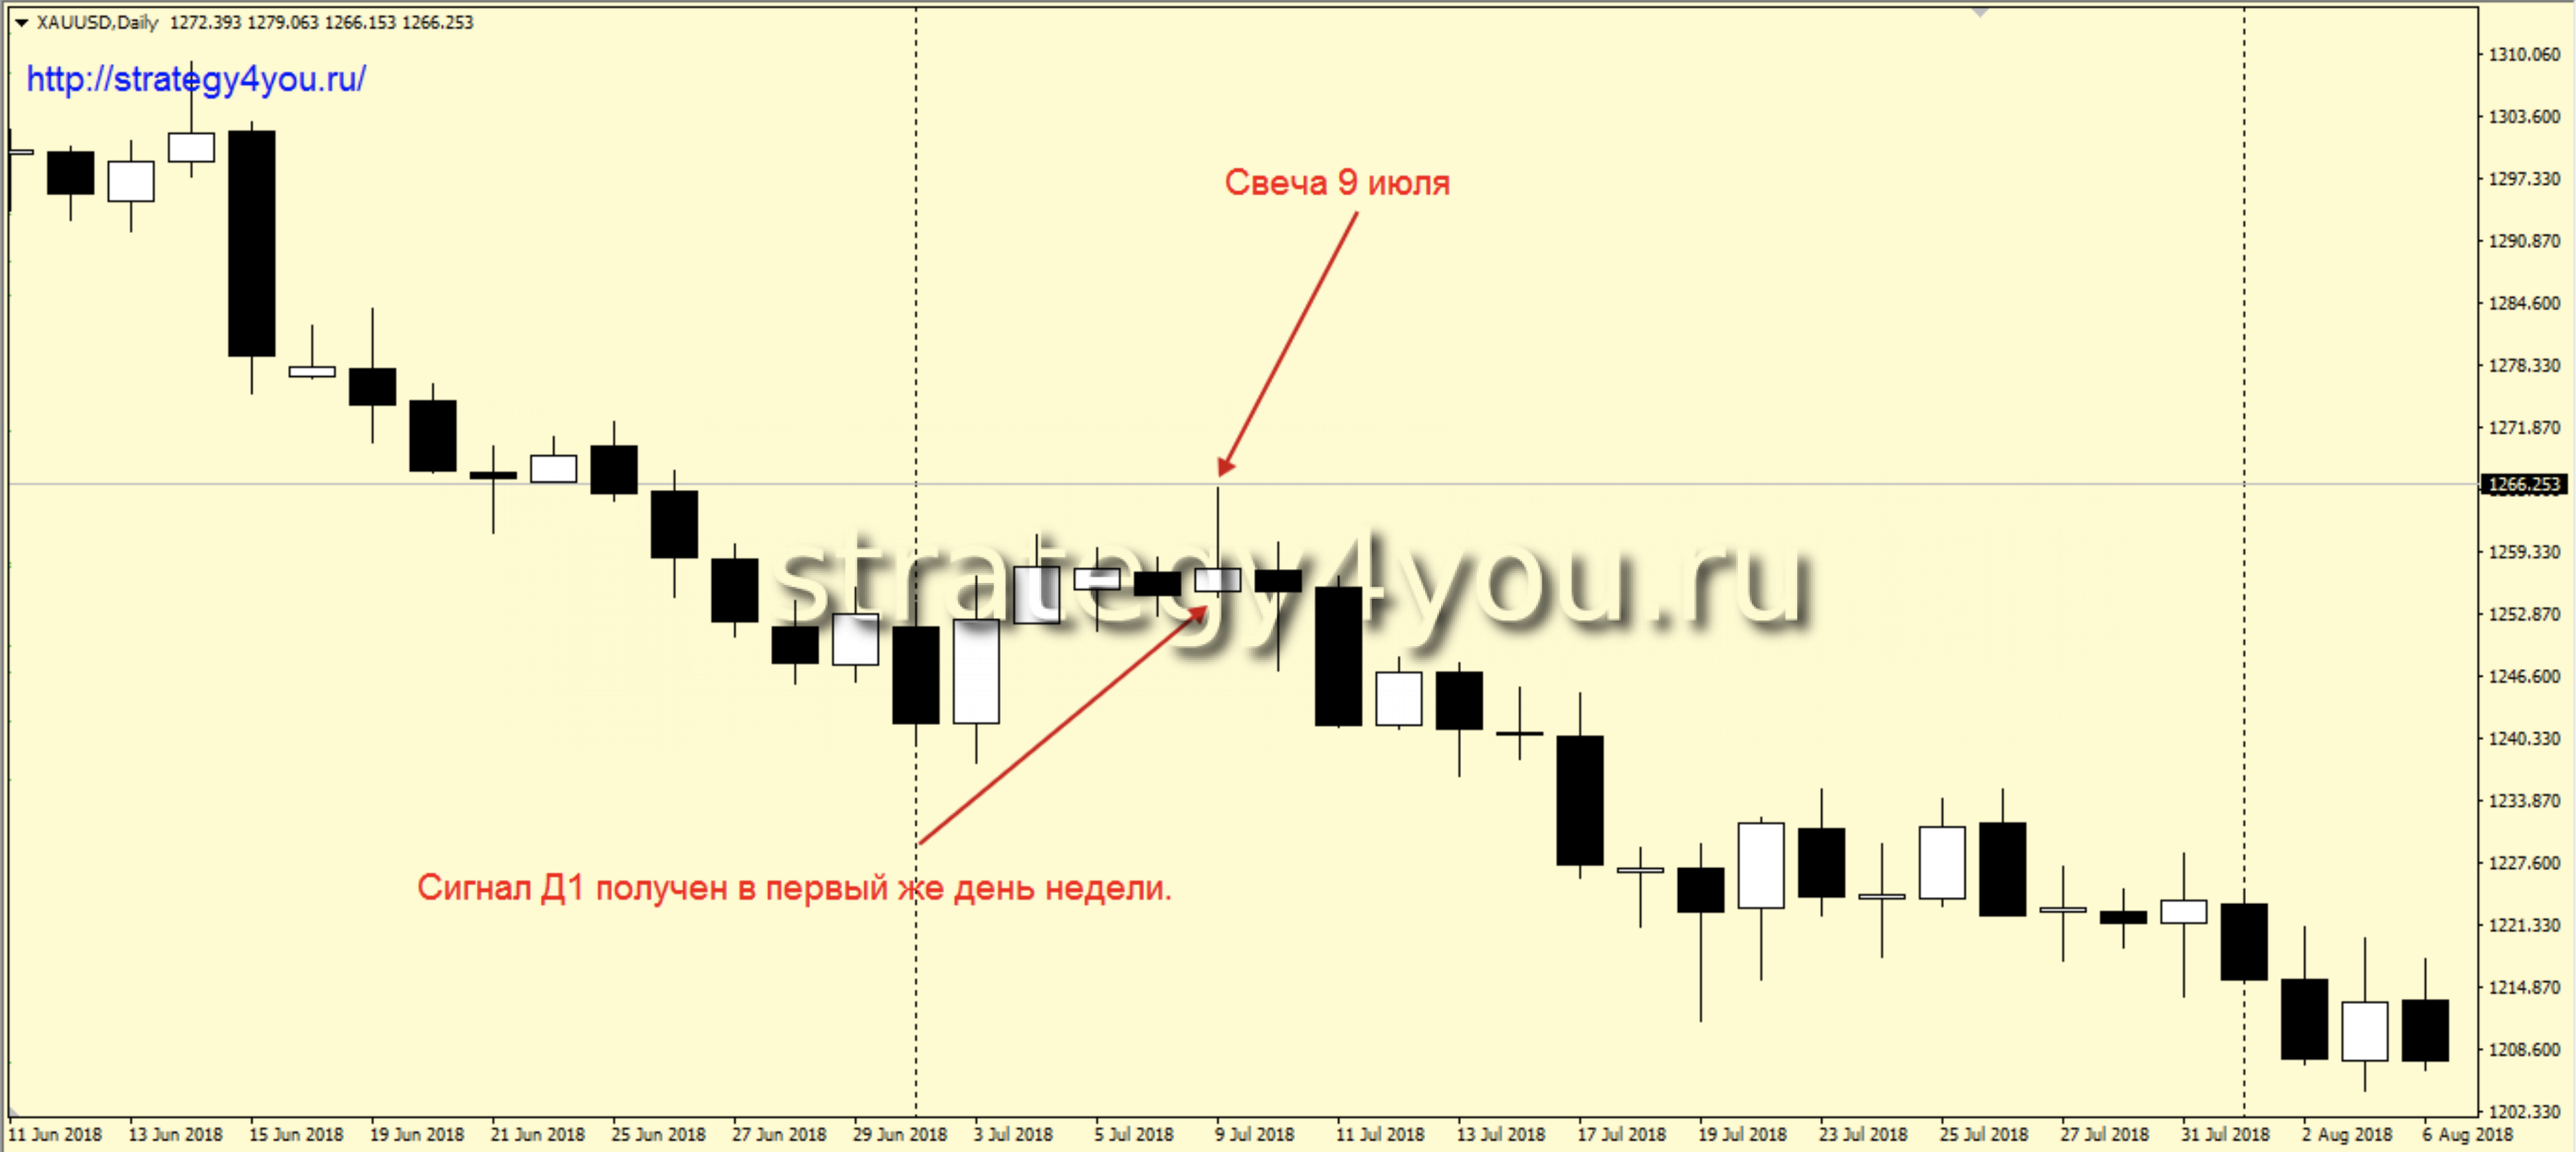
3) A candle with an upper wick greater than or equal to its body forms on D1 (a rejection candle).
4) Wait for the signal only within 1 trading week.
Hourly chart
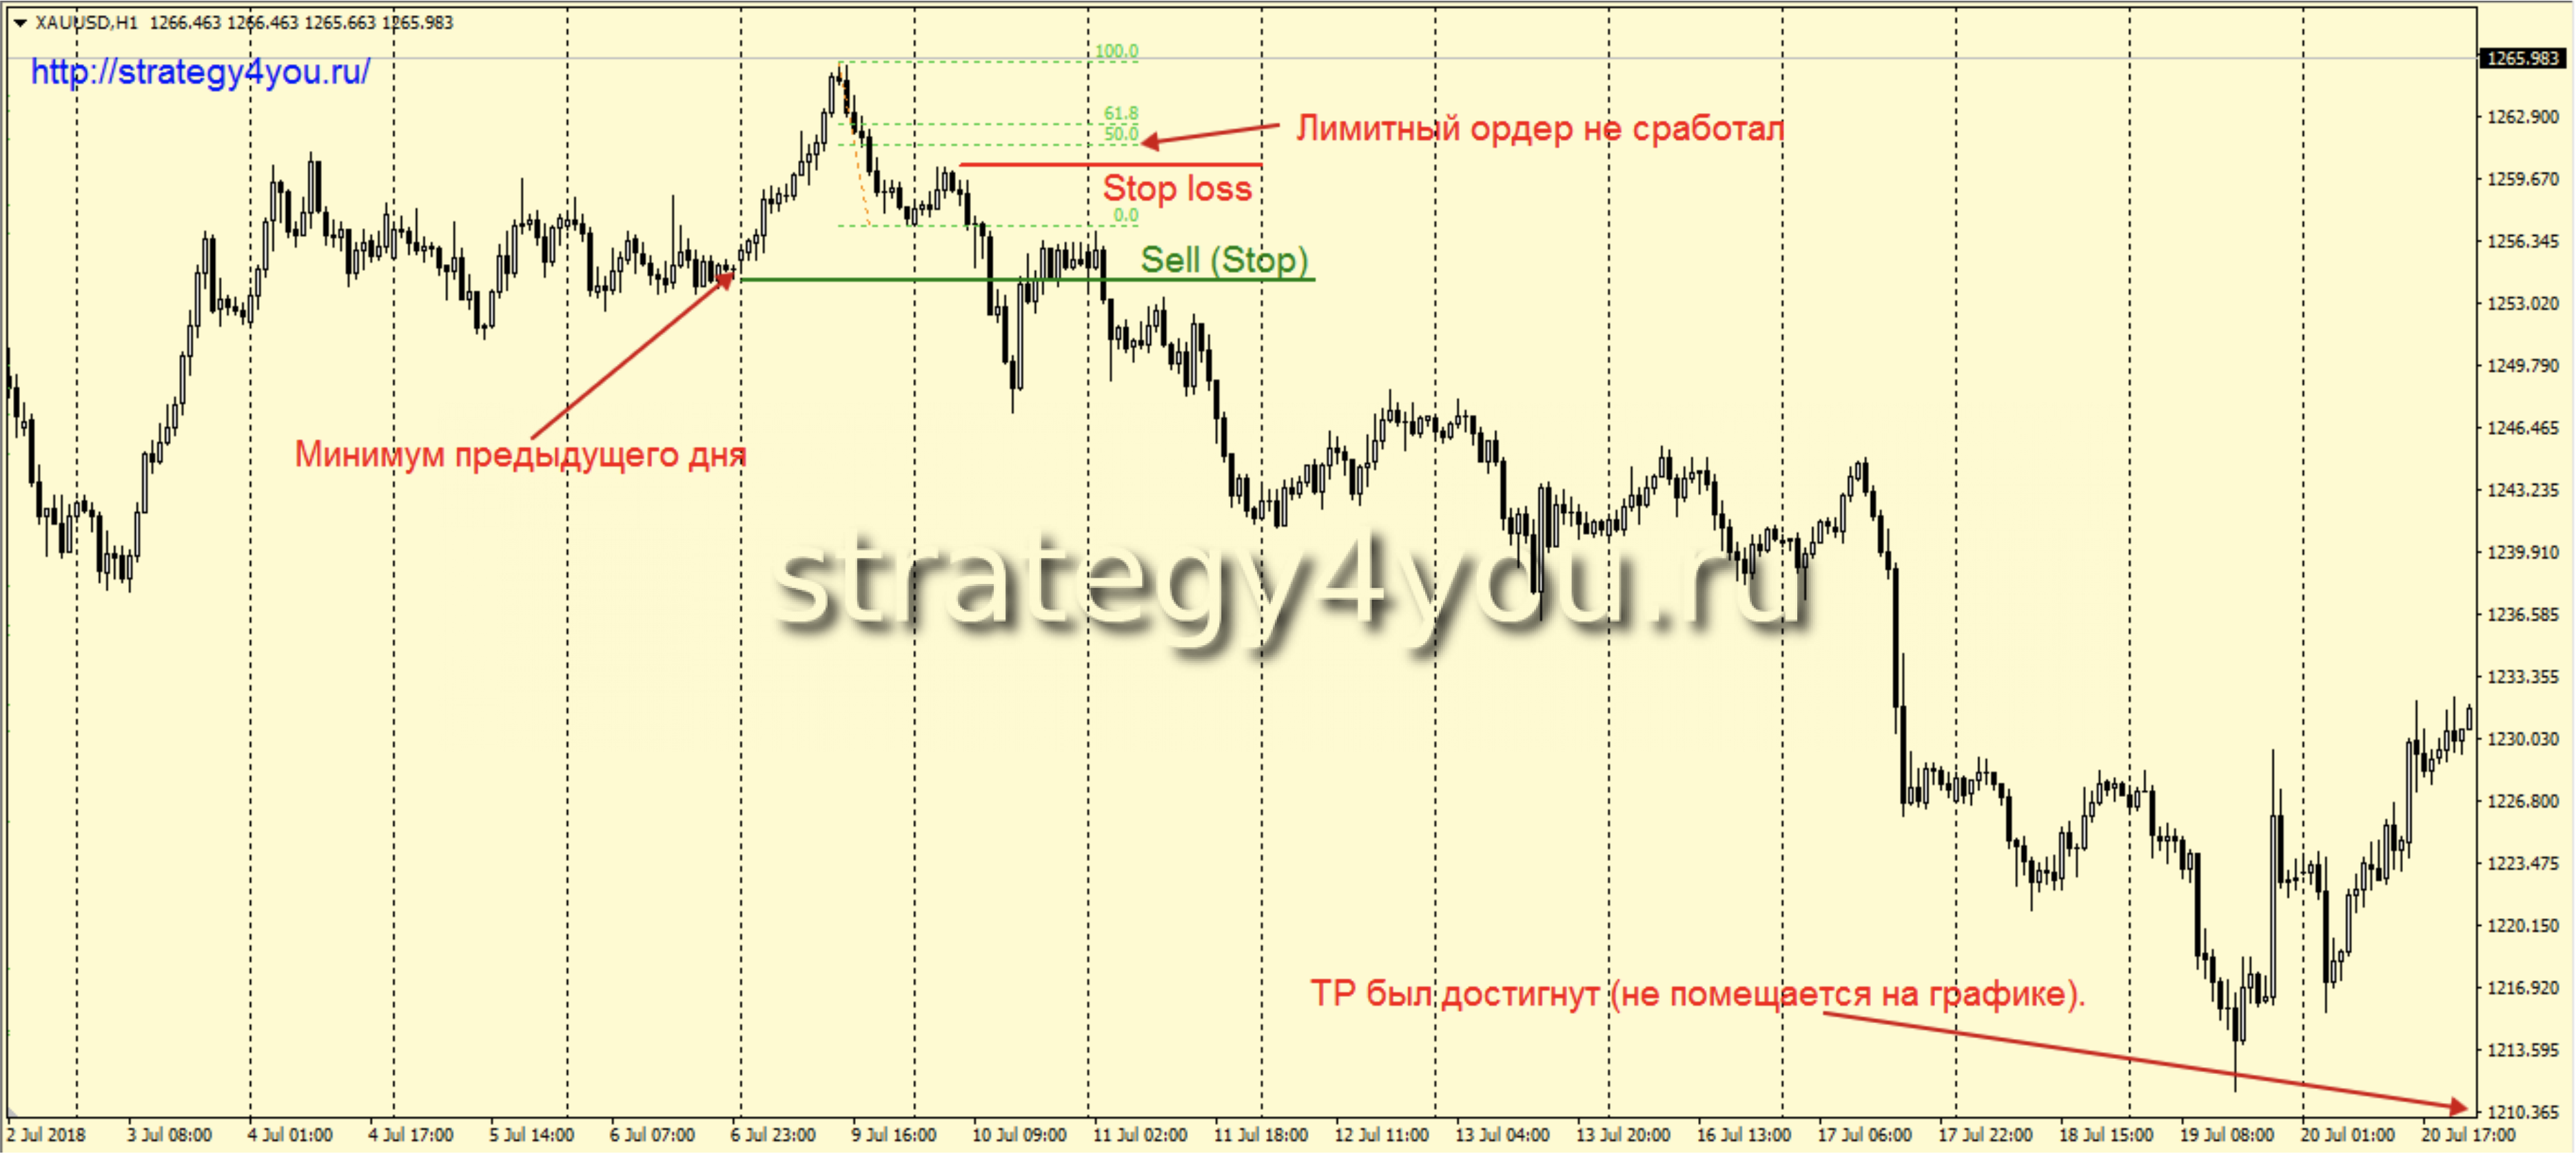
5) On H1 there are 2 ways to enter the trade:
Option 1 for sells:
1.1) Place a Sell Stop breakout pending order below the low of the previous candle.
1.2) In this case the protective Stop Loss goes beyond the 50 Fibonacci level drawn over the last downward move from the previous day’s high.
1.3) If the day opens near the previous day’s low, wait for a visible pullback and only then place the breakout order at the low.
1.4) Important: place the breakout order only after the 2nd H1 candle of the trading day. An earlier entry is not considered.
Option 2 for sells:
2.1) Draw a Fibonacci grid over the last clear downward move, with its high from the previous day.
2.2) Place a Sell Limit pending order at the 50 Fibo level.
2.3) If at the D1 open the price is already at the 50 Fibo level, place the limit order at 61.8.
2.4) The protective Stop Loss goes beyond the previous day’s high.
2.5) If the correct stop-loss placement turns out to be more than 100 pips away, place the Limit order at the 61.8 Fibonacci level.
2.6) The protective Stop Loss must be no less than 45 and no more than 60 pips ($4.5 and $6 in the price terms of this instrument).
Continued sell rules for both options
6) Once the trade has gained twice the stop-loss size, move it to breakeven.
7) When the price reaches five times the stop size, close 20% of the position volume.
8 ) Take profit when the price has moved 10 times the size of the stop loss.
9) Risk per trade: 5% of the initial deposit.
10) If after a signal on W1 the next week opens with a GAP larger than the body of the previous candle, ignore the signal.
Video version of the «Dirk» forex strategy:
I don’t attach an MT4 template or indicators, because this trading system simply has none.
Strategy test over 24 months — here >> (in Russian)