Contents 13
- What Is Liquidity on a Chart?
- What Is a Liquidity Sweep?
- Liquidity Sweep vs Breakout
- Does a Plain Liquidity Sweep Work? The Test
- Liquidity Sweep Strategy: The Rules
- Backtest: 193 Trades on 12 Markets
- Trade Examples, Step by Step
- Gallery: All 193 Trades
- How to Calculate Lot Size
- Common Liquidity Sweep Trading Mistakes
- FAQ: Liquidity Sweeps
- Video: Liquidity Sweep Step by Step on Real Trades
- Conclusion
The Liquidity Sweep is one of the most popular ideas in Smart Money Concepts (SMC) and ICT: “big players run the crowd’s stops below a low and reverse the price.” On YouTube it looks perfect: a wick through the level, and price flies the other way.
We tested it on historical data. This article explains what liquidity and a sweep are, how a sweep differs from a breakout, and then tests 2,132 sweeps on 12 markets (gold and 11 forex pairs) from 2024 to 2026 with the same rules for every trade. The result is surprising: a liquidity sweep on its own is a losing signal. But two extra conditions turn it into a working strategy.
What Is Liquidity on a Chart?
In Smart Money terms, liquidity is a cluster of stop-losses and pending orders beyond obvious levels.
- Sell-side liquidity sits below lows: buyers’ stops and the Sell Stop orders of traders waiting for a breakdown.
- Buy-side liquidity sits above highs: sellers’ stops and the Buy Stop orders of traders waiting for a breakout.
The more obvious the level, the more orders sit behind it: a swing low, a double bottom, equal lows, the previous day’s low. A large player needs volume to build a position, and the crowd’s stops provide it.
What Is a Liquidity Sweep?
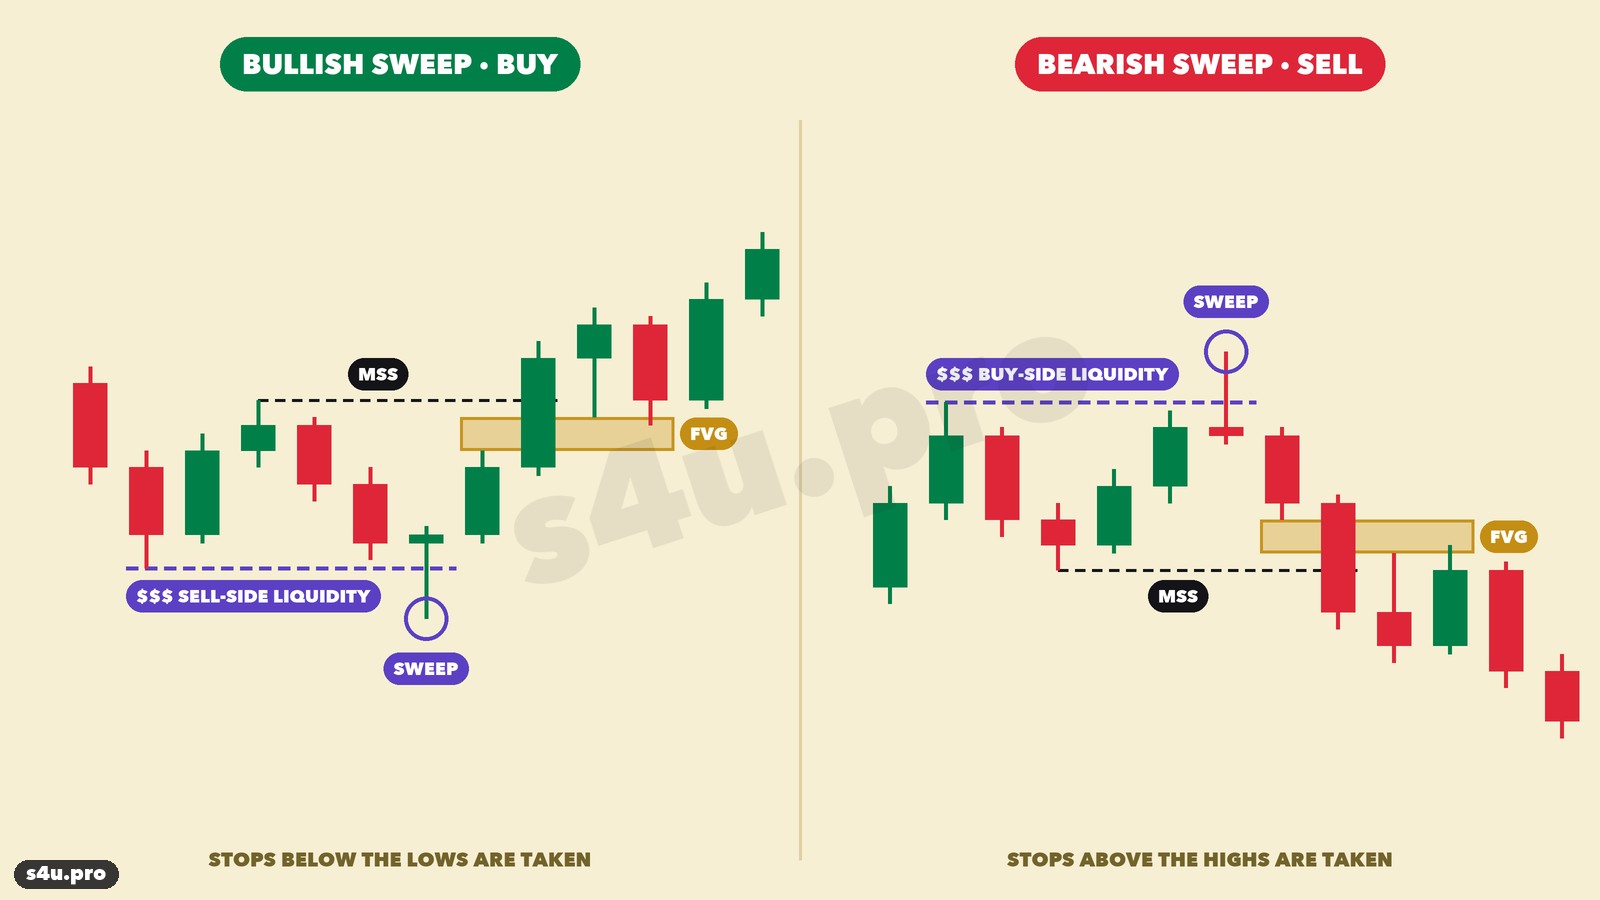
A Liquidity Sweep is a quick poke through a liquidity level: the wick goes beyond the low (high), stops are triggered, and the candle closes back inside the range. It is also called a stop hunt, a liquidity grab or a stop run.
- Bullish sweep — a wick below a low and a close back above it. A buy signal.
- Bearish sweep — a wick above a high and a close back below it. A sell signal.
Liquidity Sweep vs Breakout
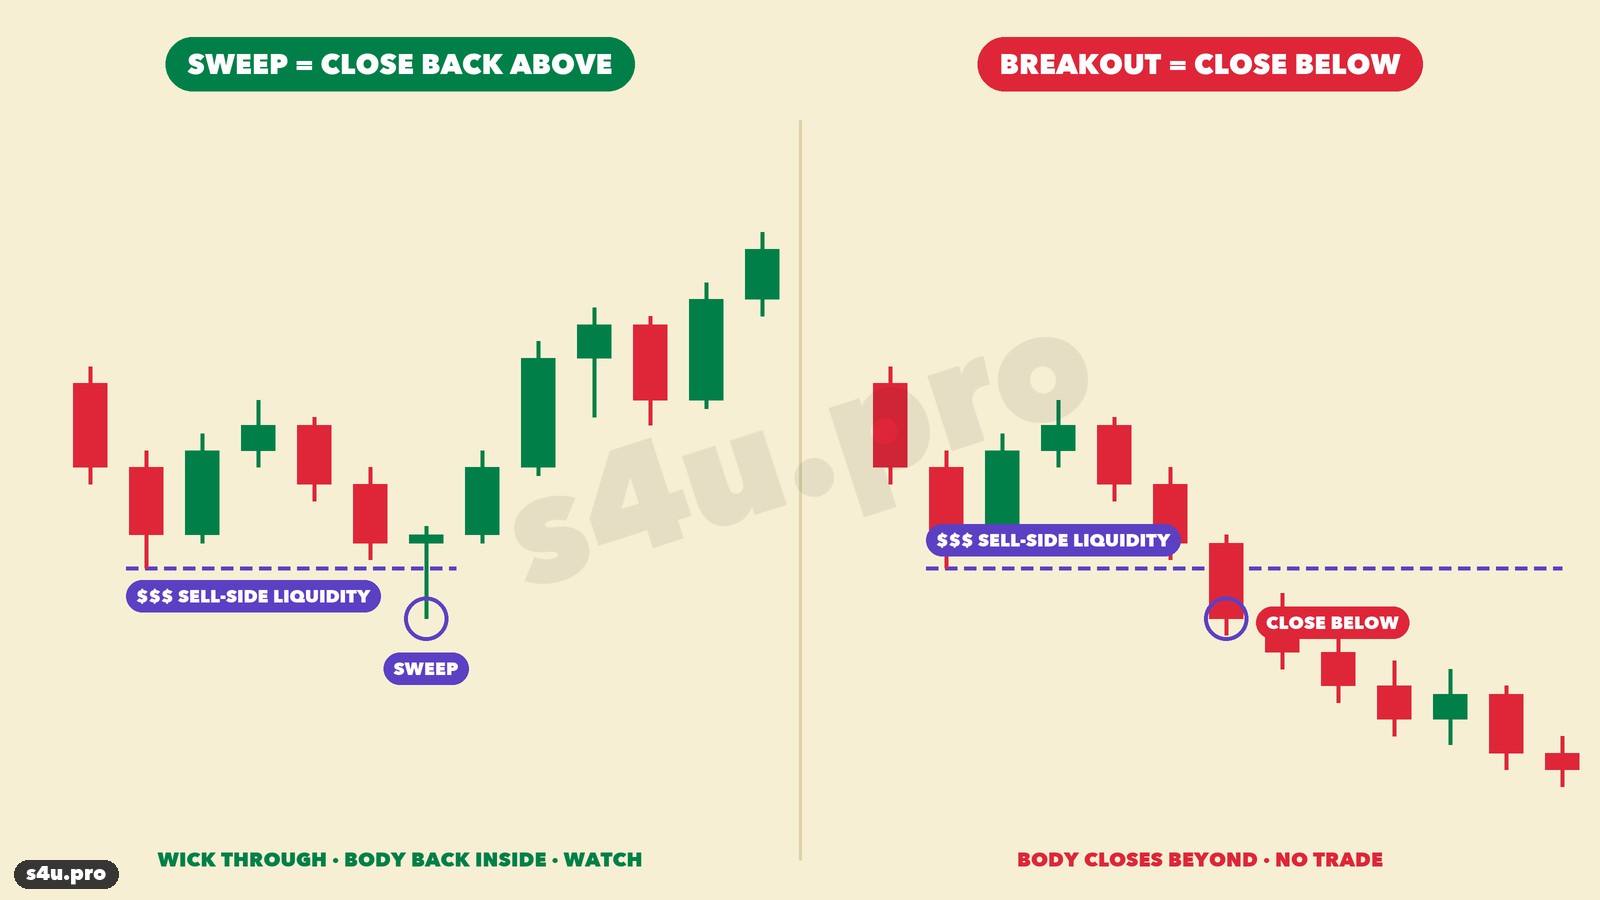
The key is the candle close. A wick through the level and a close back inside is a sweep. A body that closes beyond the level is a breakout, and you do not trade against it.
| Model | What happens | What we do |
|---|---|---|
| Liquidity Sweep | Wick beyond the level, close back inside | Wait for a structure shift the other way |
| Breakout | The candle body closes beyond the level | No trade against the move |
| Turtle Soup | A false break of a 20-day extreme (L. Raschke) | A daily-chart special case of a sweep |
| Order Block | The last opposite candle before an impulse | Entry at the block zone |
Does a Plain Liquidity Sweep Work? The Test
We started with the classic version shown in most videos: a candle sweeps a low and closes above it — buy at the next candle’s open, stop beyond the wick, target 2R. We tested it on 12 markets, on H1 and H4, with different levels: swing lows, the previous day’s low, equal lows, with and without a trend filter.
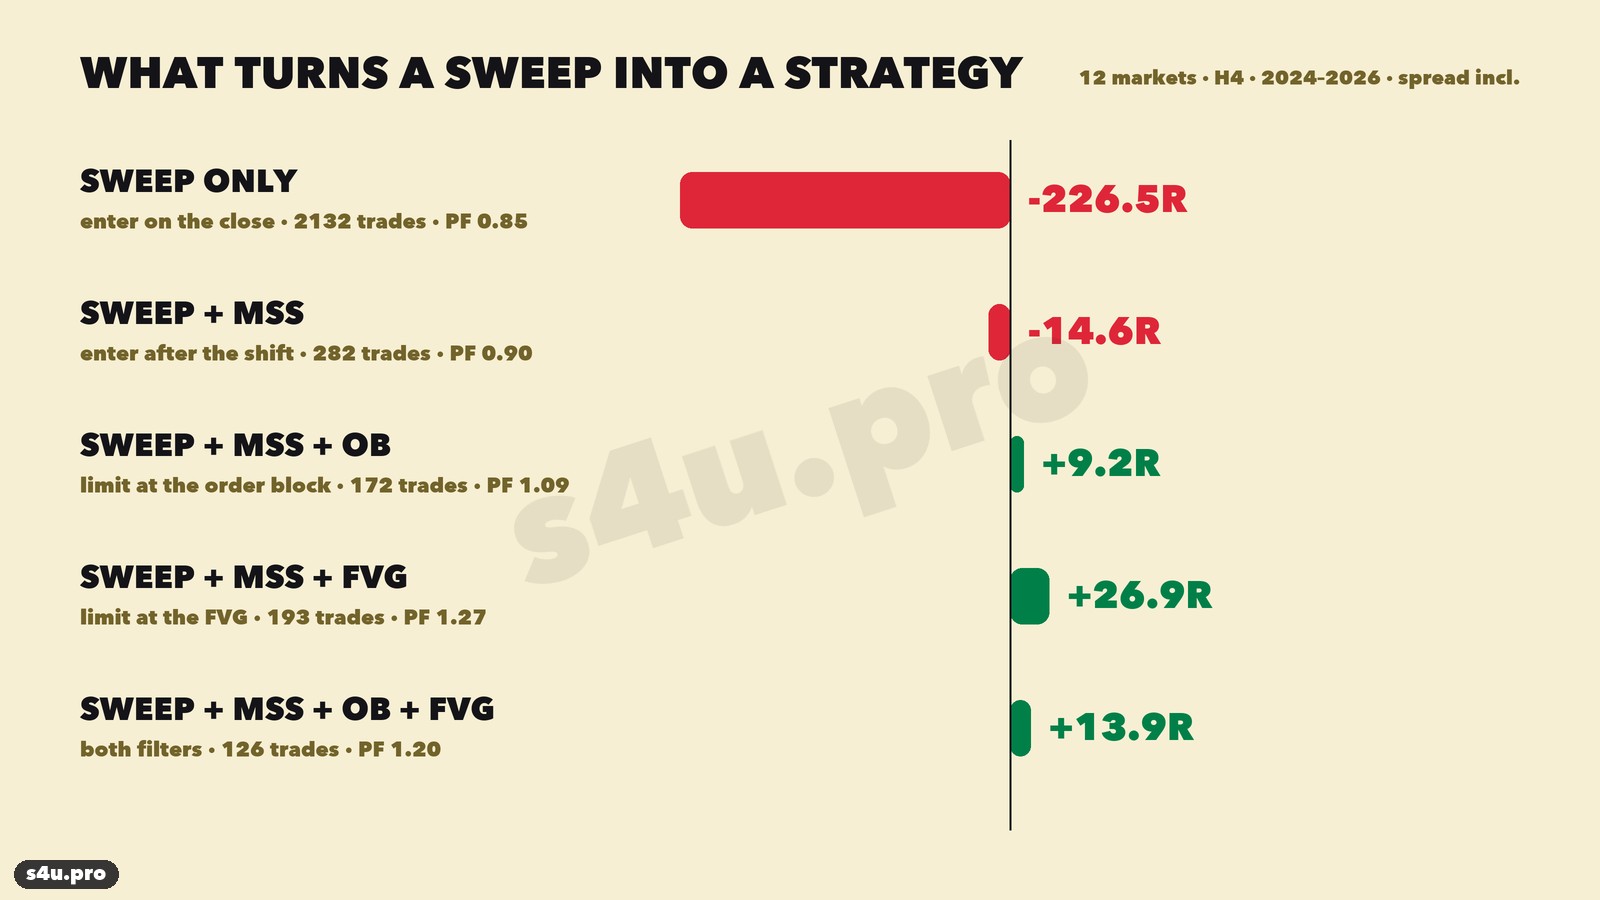
The result is clear: almost every version loses. On H4 across 12 markets: 2,132 trades, 32% winners and −226.5R. H1 looks the same. Sweeps happen all the time, and the break continues about as often as it reverses.
So we added Smart Money conditions to the sweep and tested them one by one and together.
| Version (12 markets, H4) | Trades | Winners | R | Profit factor |
|---|---|---|---|---|
| Sweep only, enter on the close | 2,132 | 32.2% | −226.5R | 0.85 |
| Sweep + structure shift (MSS), market entry | 282 | 38.7% | −14.6R | 0.90 |
| Sweep + MSS + entry at the order block | 172 | 40.1% | +9.2R | 1.09 |
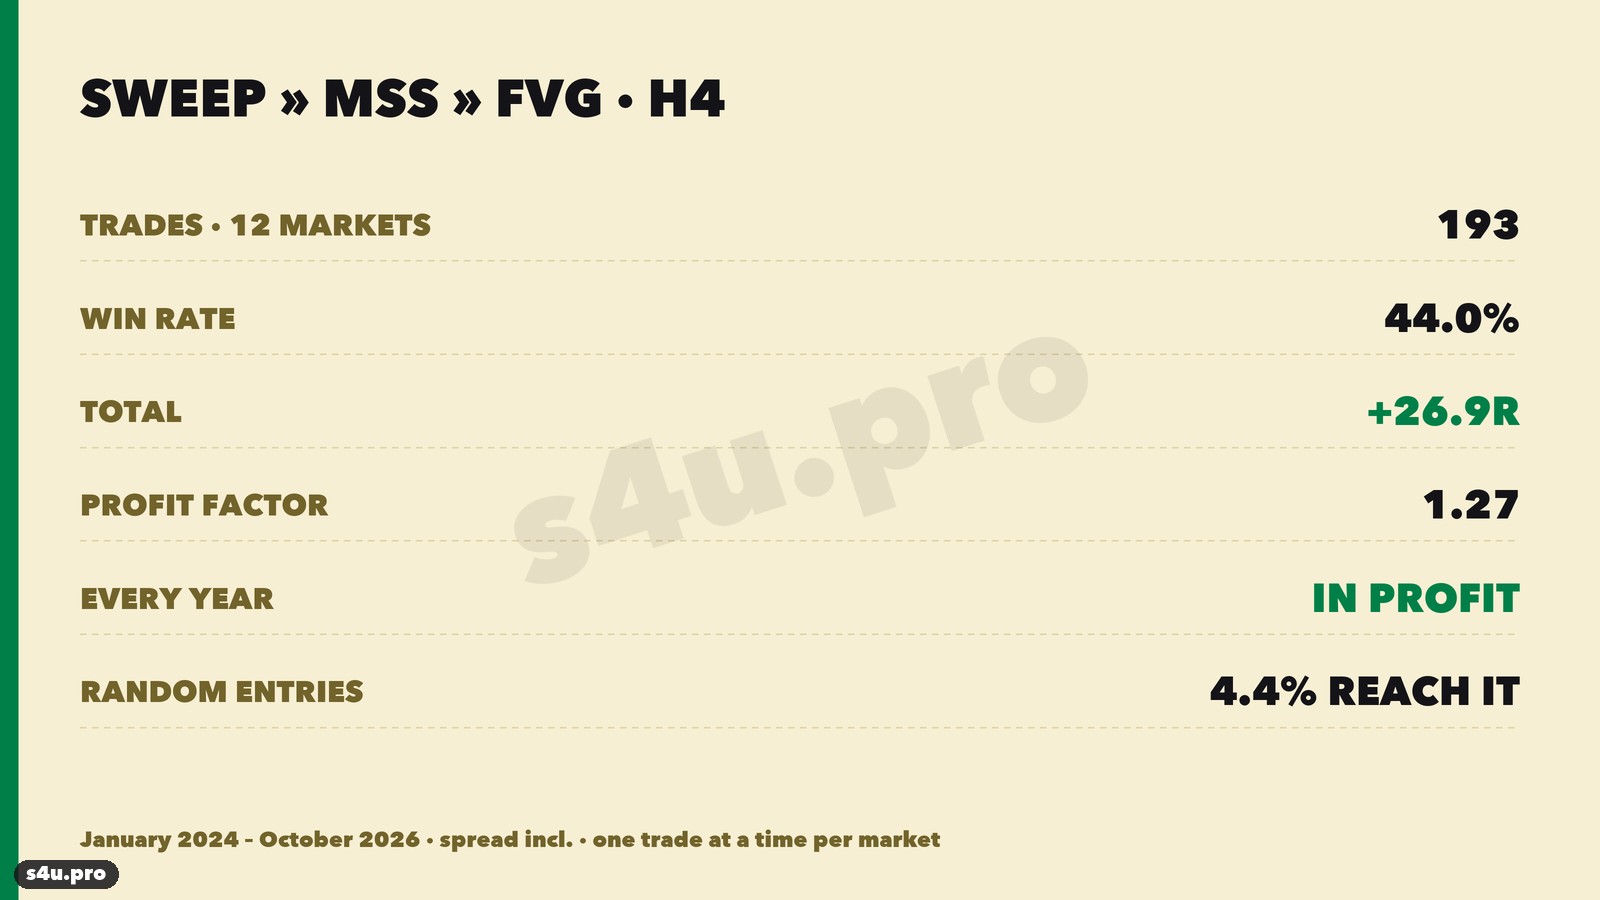
| Sweep + MSS + entry at the FVG | 193 | 44.0% | +26.9R | 1.27 |
| Sweep + MSS + order block + FVG | 126 | 41.3% | +13.9R | 1.20 |
Every step improves the signal. The structure shift filters out sweeps after which price never actually reversed. A limit entry at the FVG gives a better price than chasing the move and a tighter stop. An order block entry is weaker than the FVG, and using both filters cuts too many trades. The best version is sweep → MSS → FVG, the classic ICT model.
Free EA for MT4 / MT5 + trade journals Get it freeLiquidity Sweep Strategy: The Rules
| Parameter | Rule |
|---|---|
| Markets / timeframe | Forex pairs and gold, H4 |
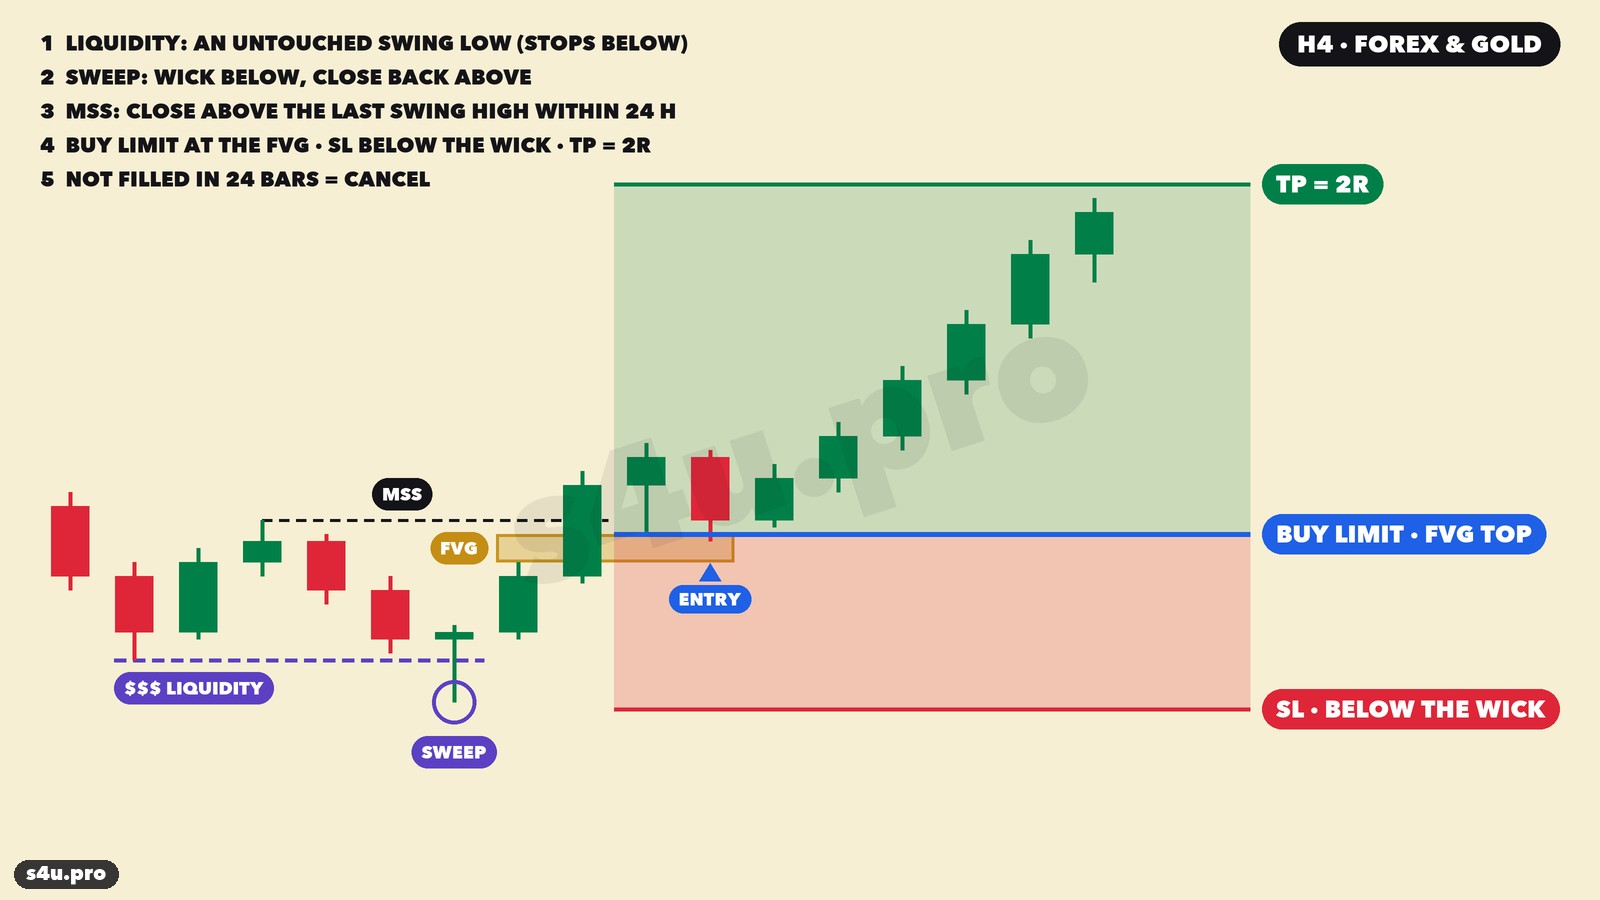
| Liquidity | A fractal swing low (below the 3 candles on each side) that price has not broken yet, no older than 60 candles (10 days). For sells — a swing high |
| Sweep | A candle wicks below the low and closes back above it. A close below is a breakout, and the level is dropped |
| Structure shift (MSS) | Within 6 candles (24 hours) a candle closes above the last swing high before the sweep, and the sweep low is not broken in the meantime |
| FVG | The first Fair Value Gap in the move from the sweep to the shift: the gap between candle 1’s high and candle 3’s low |
| Entry | Buy Limit at the top of the FVG (for sells — Sell Limit at the bottom) |
| Stop loss | 3 pips beyond the sweep candle’s wick |
| Take profit | 2R — twice the stop |
| Order cancel | Not filled within 24 candles (4 days) — cancel. Price reached the target level before the fill — cancel too |
| Time exit | Neither SL nor TP within 30 candles (5 days) — close at market |
| One trade | One trade at a time per instrument: while it is open, new signals on that instrument are skipped |
| Risk | 0.5–1% of the account per trade |
Backtest: 193 Trades on 12 Markets
We ran the rules on 4-hour candles from January 2024 to October 2026: XAUUSD (from June 2024), EURUSD, GBPUSD, AUDUSD, NZDUSD, USDJPY, USDCAD, USDCHF, EURJPY, GBPJPY, EURGBP, AUDJPY. Strict conditions:
- a spread is deducted from every trade: 1.2 pips on forex and $0.30 on gold;
- if one candle touches both the stop and the target, we count the stop;
- a limit order can only fill after the FVG is fully formed — no look-ahead;
- the same rules for every market, no curve-fitting after the fact.
What Is R — in Plain Words
R is your risk in one trade. 1R = the amount you lose if the stop-loss is hit. A result in R answers the question: “how many of my risks did I make or lose?”- Stop hit — minus 1R. Target hit — plus 2R.
- Example in money. A $10,000 account, 1% risk = $100. So 1R = $100: a stop is −$100, a target is +$200.
- Into money: +26.9R at $100 risk = +$2,690; at $50 risk = +$1,345.
Pips are not comparable across 12 different markets (a pip on gold, the yen and the euro is worth different amounts), so R is the main unit in this article. Every trade in the journal also shows its pips.
Key Numbers
| Metric | Value |
|---|---|
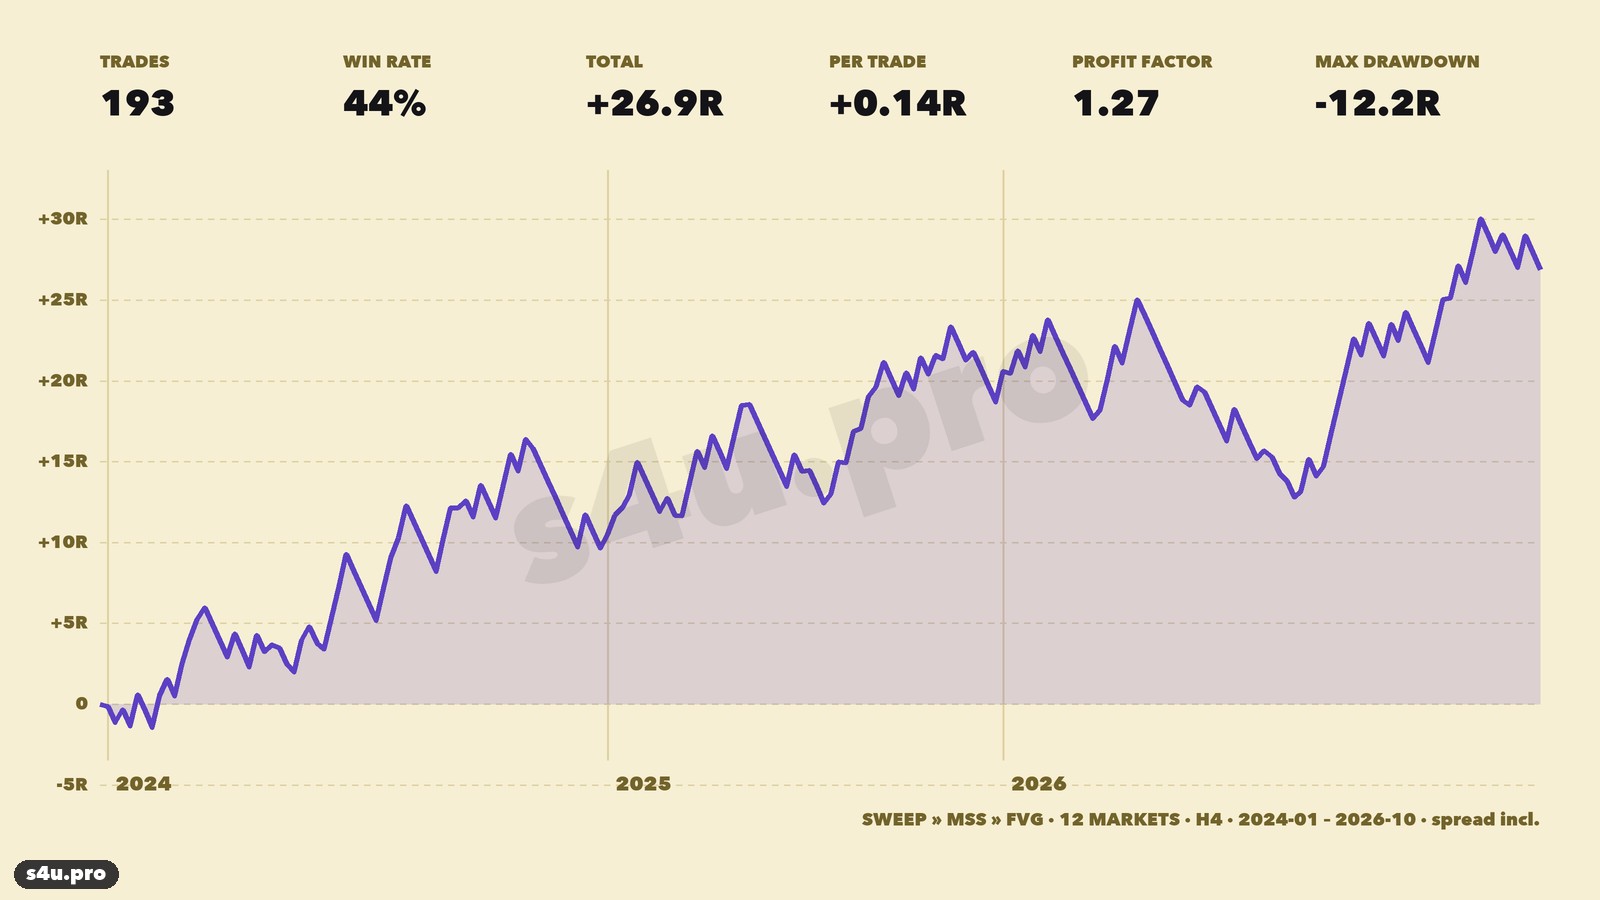
| Trades | 193 (about 6 a month across 12 markets) |
| Winners | 44.0% (51 targets, 95 stops, 47 time exits) |
| Total | +26.9R |
| Average per trade | +0.14R |
| Average win / loss | +1.50R / −0.94R |
| Profit factor | 1.27 |
| Max drawdown | −12.2R |
| Worst losing streak | 7 in a row |
| Profitable months | 18 of 34 |
| Time in trade | about 56 hours (median) |
The time exit matters here: 34 of the 47 time exits closed in profit and together made +23.6R. After a sweep price often moves the right way but does not reach 2R within 5 days.
As a check, we opened the same number of random trades 1,000 times on the same markets with the same risk and a 2R target. The median random result was −3.9R, and only 4.4% of the runs reached +26.9R or more. The strategy’s result does not look like luck, but the edge is modest: this is not a holy grail, it is a disciplined model with a positive expectancy.
Results by Market
| Market | Trades | Winners | R |
|---|---|---|---|
| XAUUSD (gold) | 11 | 73% | +10.9R |
| AUDUSD | 20 | 55% | +9.1R |
| USDJPY | 12 | 75% | +8.7R |
| AUDJPY | 6 | 50% | +3.3R |
| EURUSD | 16 | 44% | +3.3R |
| USDCAD | 21 | 57% | +2.7R |
| USDCHF | 26 | 38% | +1.5R |
| EURGBP | 5 | 40% | +0.8R |
| GBPJPY | 20 | 40% | −0.7R |
| NZDUSD | 21 | 33% | −2.0R |
| EURJPY | 7 | 14% | −4.2R |
| GBPUSD | 28 | 25% | −6.5R |
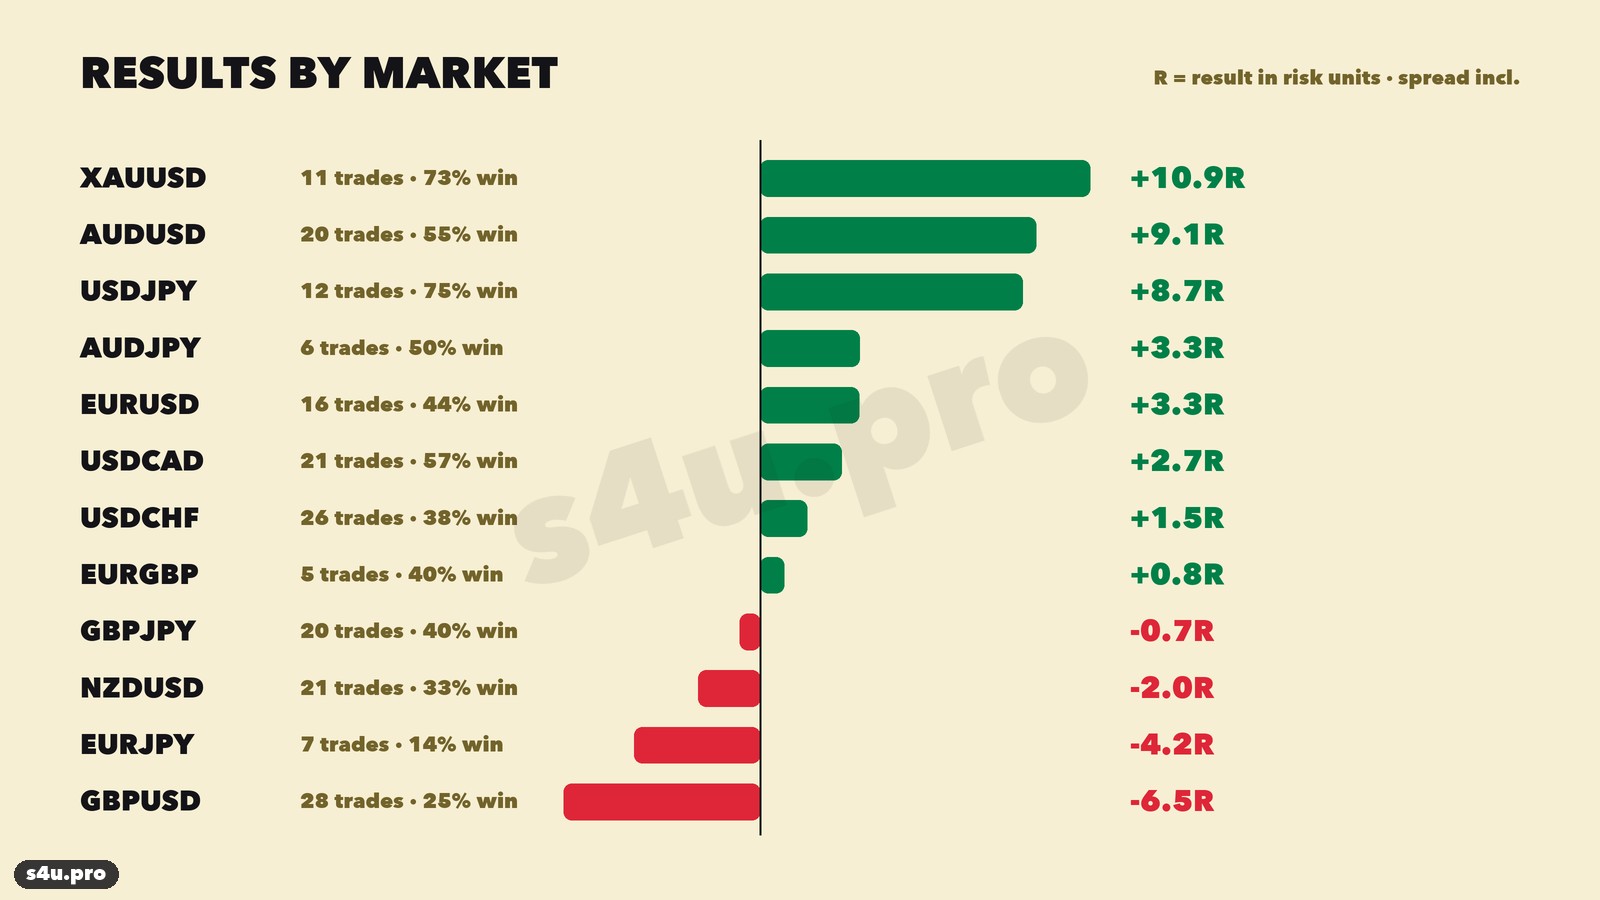
8 of 12 markets are profitable. The model works best on gold, AUDUSD and USDJPY, and worst on the pound (GBPUSD). We did not remove the losing markets: each market has few trades (5–28), and dropping the “bad” ones afterwards is curve-fitting. Trading the whole basket is the honest way.
Results by Year
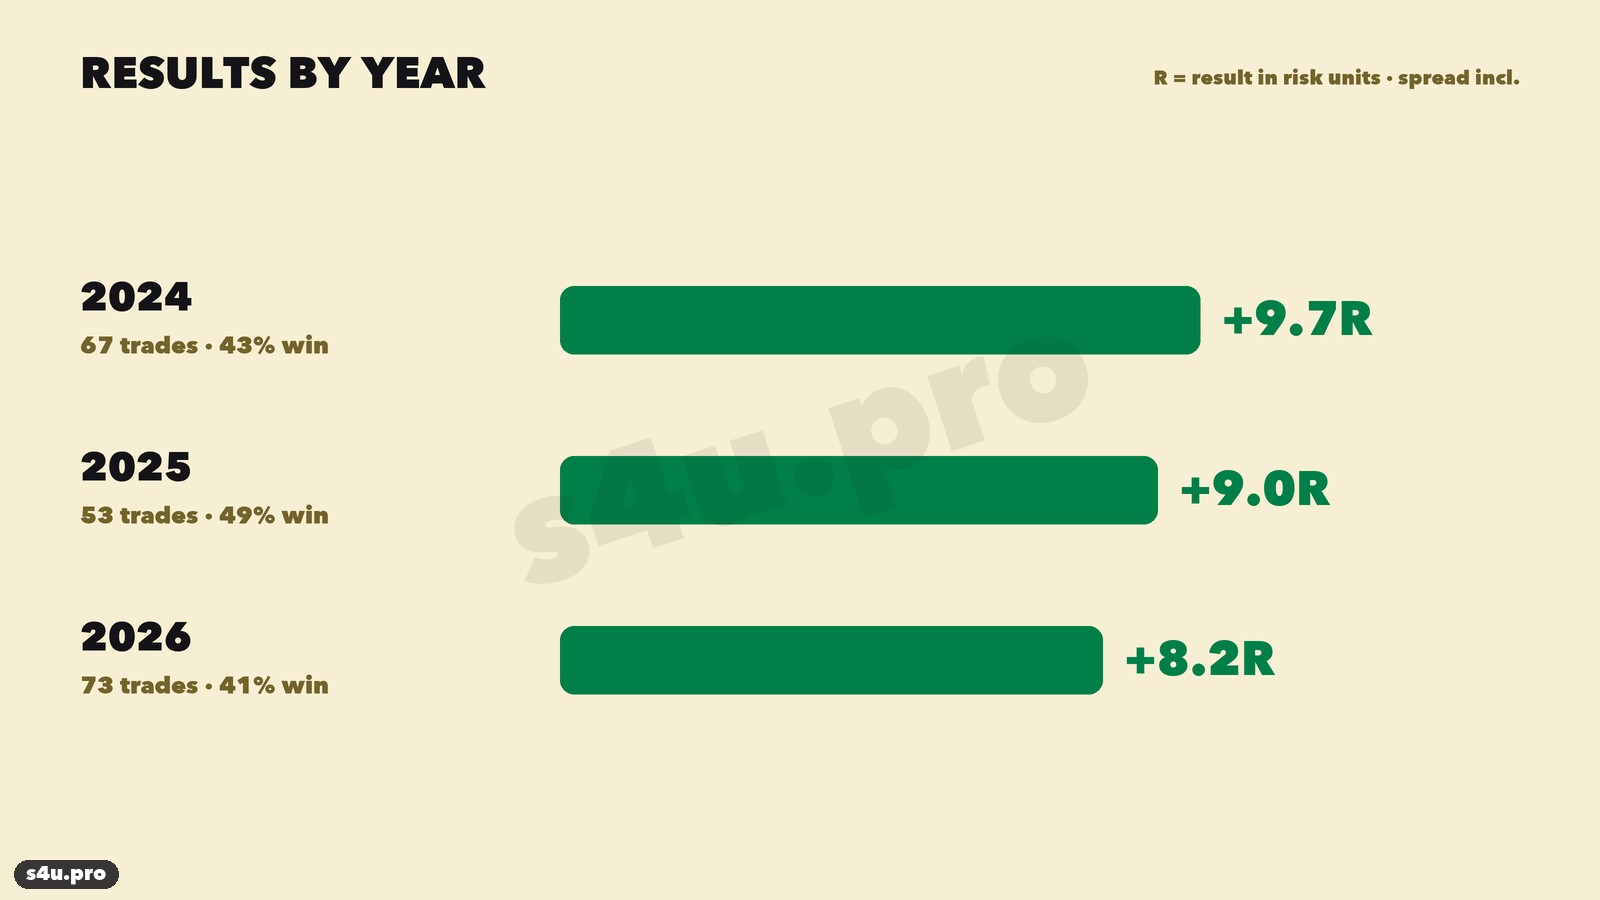
The strategy is profitable every year: 2024 — +9.7R (67 trades), 2025 — +9.0R (53), 2026 through October — +8.2R (73). That is the main difference from our FVG and Order Block gold strategies, where 2026 was around break-even.
Buys vs Sells
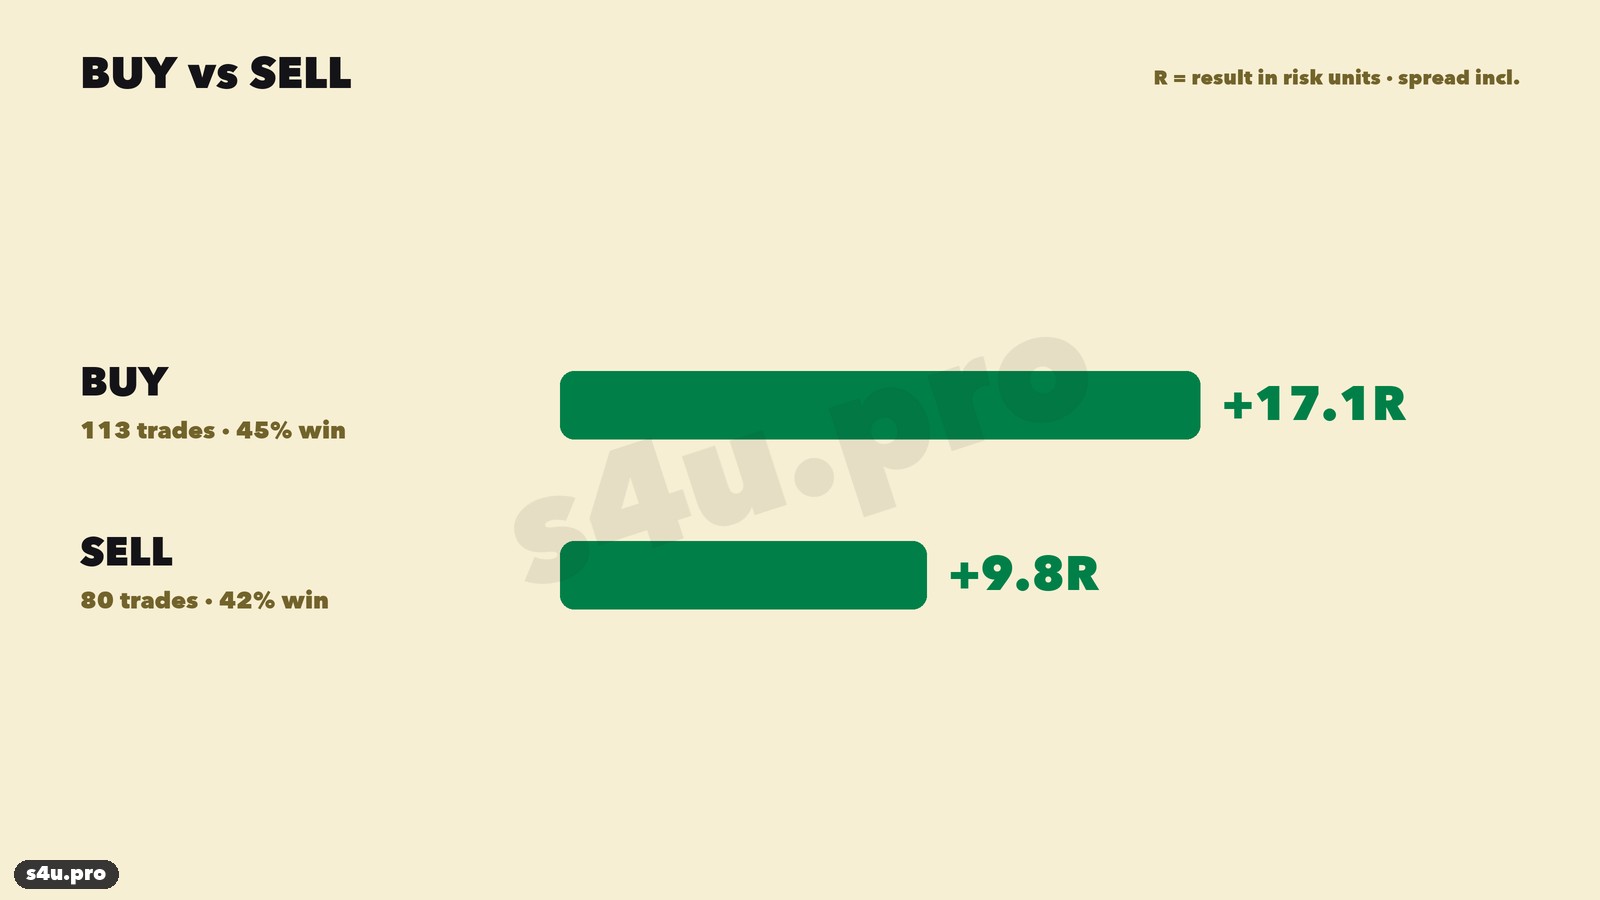
Both sides are profitable: buys +17.1R (113 trades, 45% winners), sells +9.8R (80 trades, 43%).
An Honest Look at the Drawdown
The max drawdown is −12.2R and the worst losing streak is 7 in a row. The equity peak was on September 11, 2026 (+30.0R). Just over half the months are profitable (18 of 34), so several losing months in a row do happen. At 1% risk per trade, be ready for a 10–15% drawdown. Trades on different markets can be open at the same time, so a risk closer to 0.5% per trade is safer.
Trade Examples, Step by Step
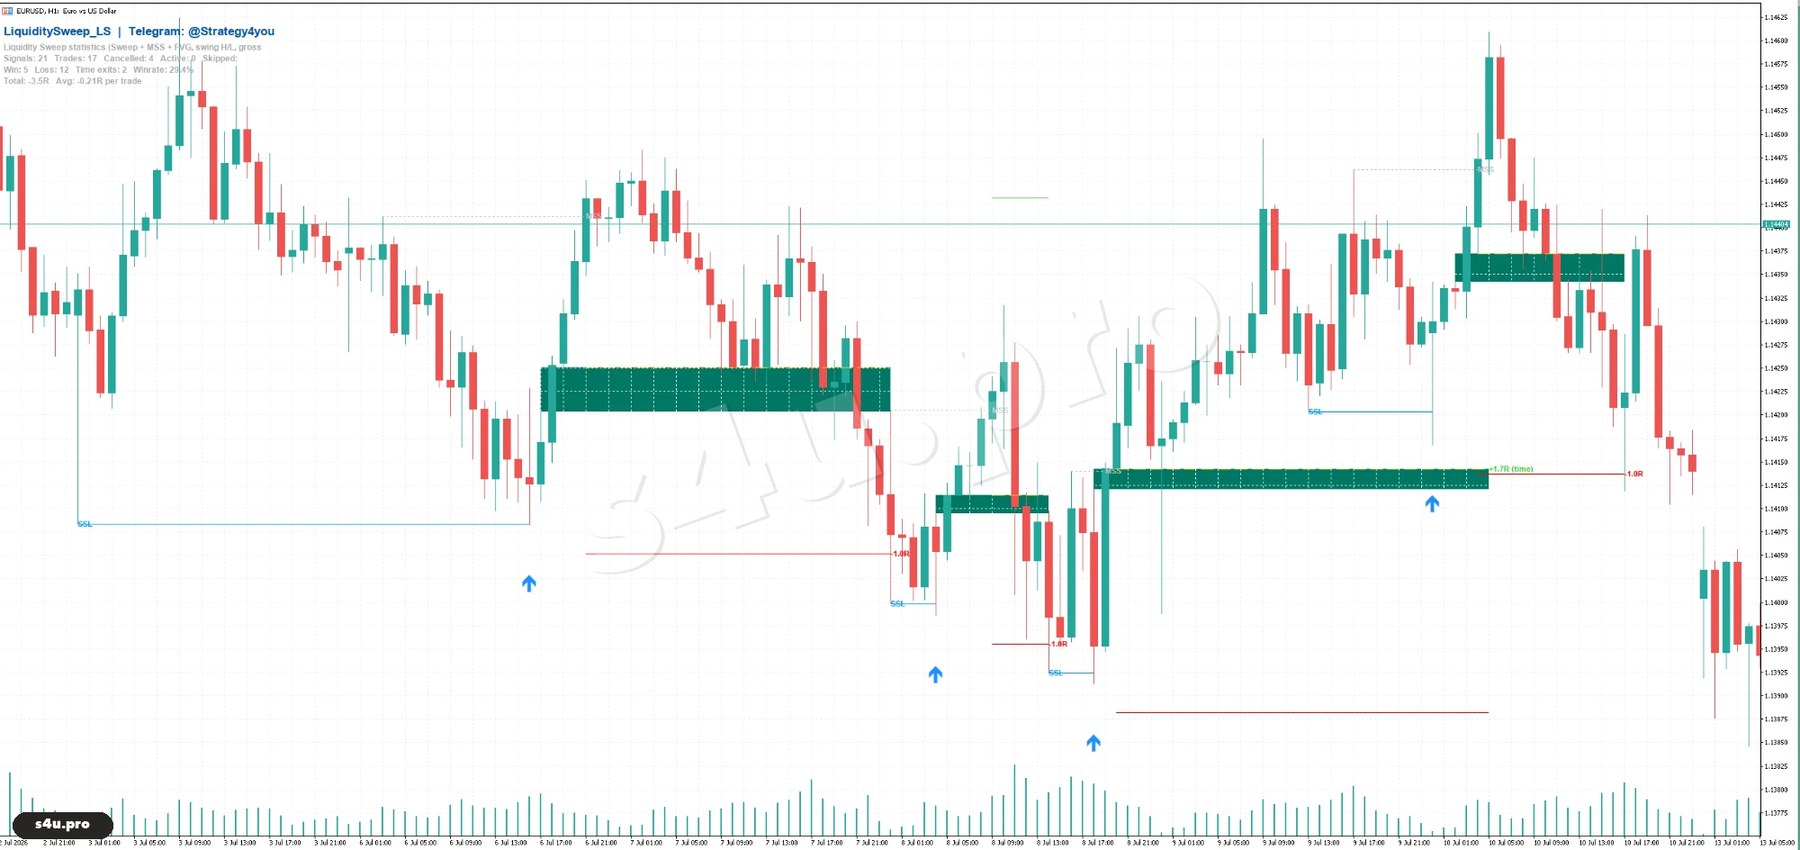
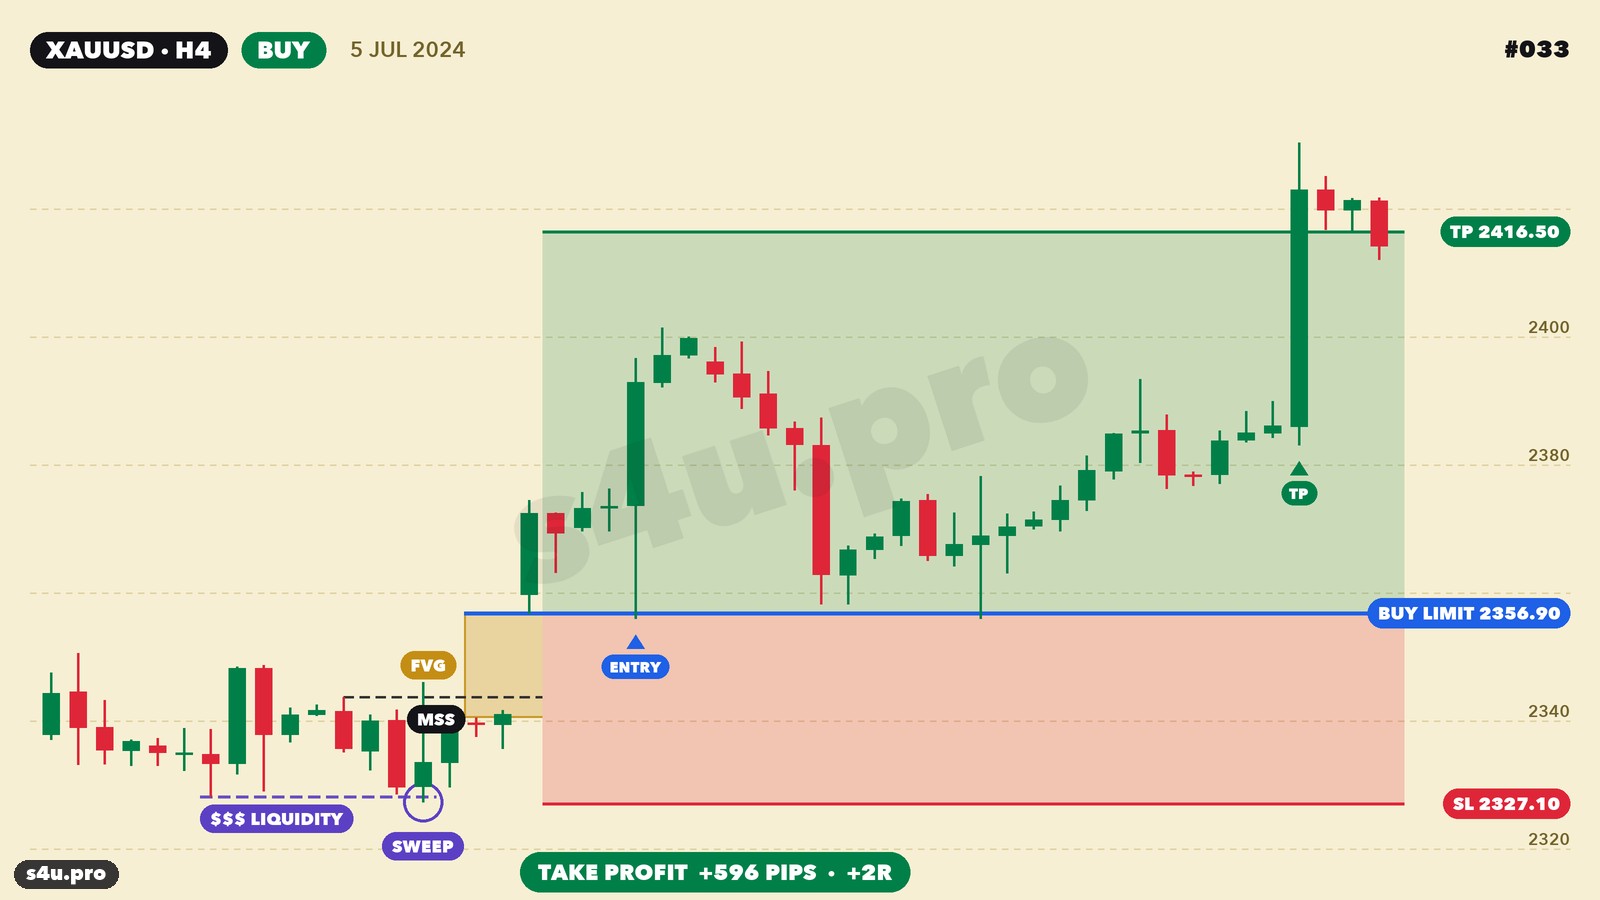
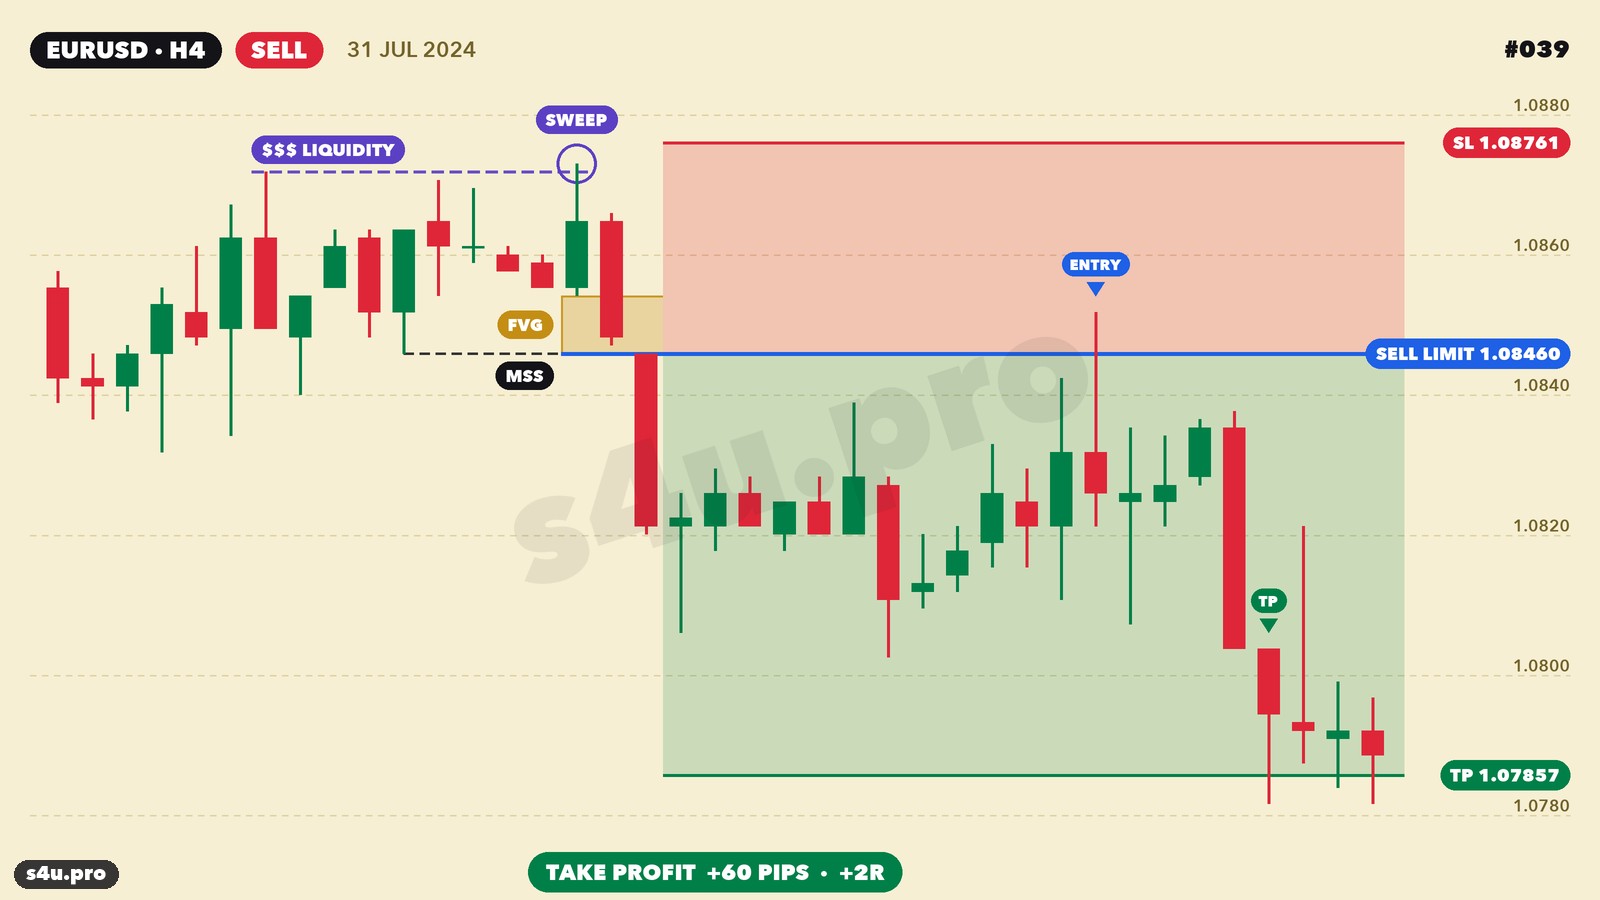
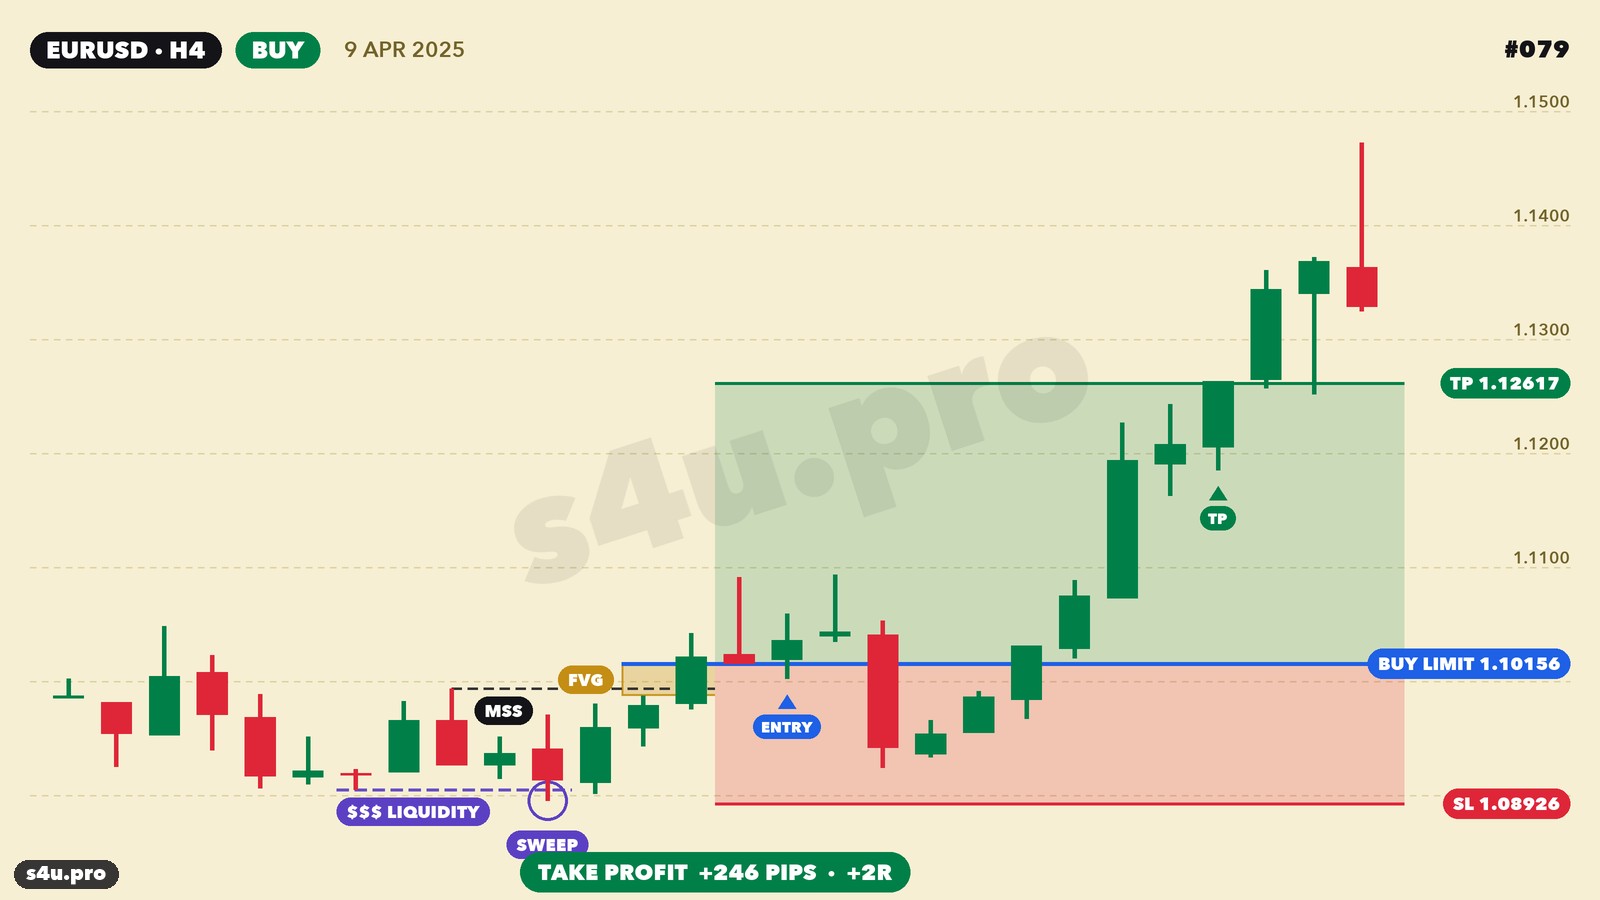
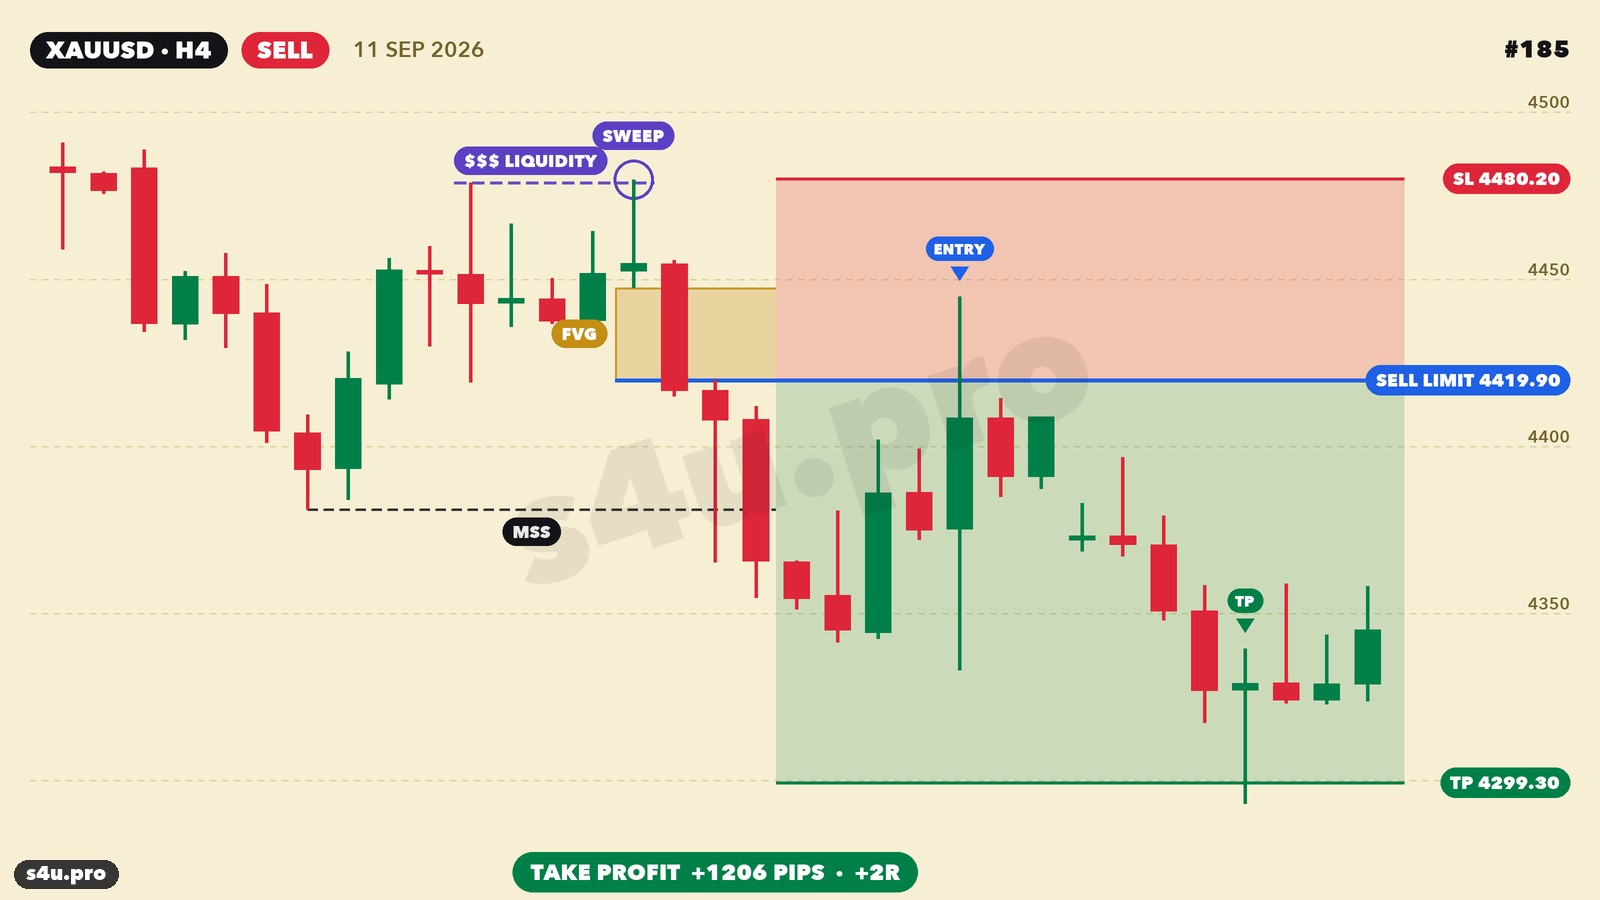
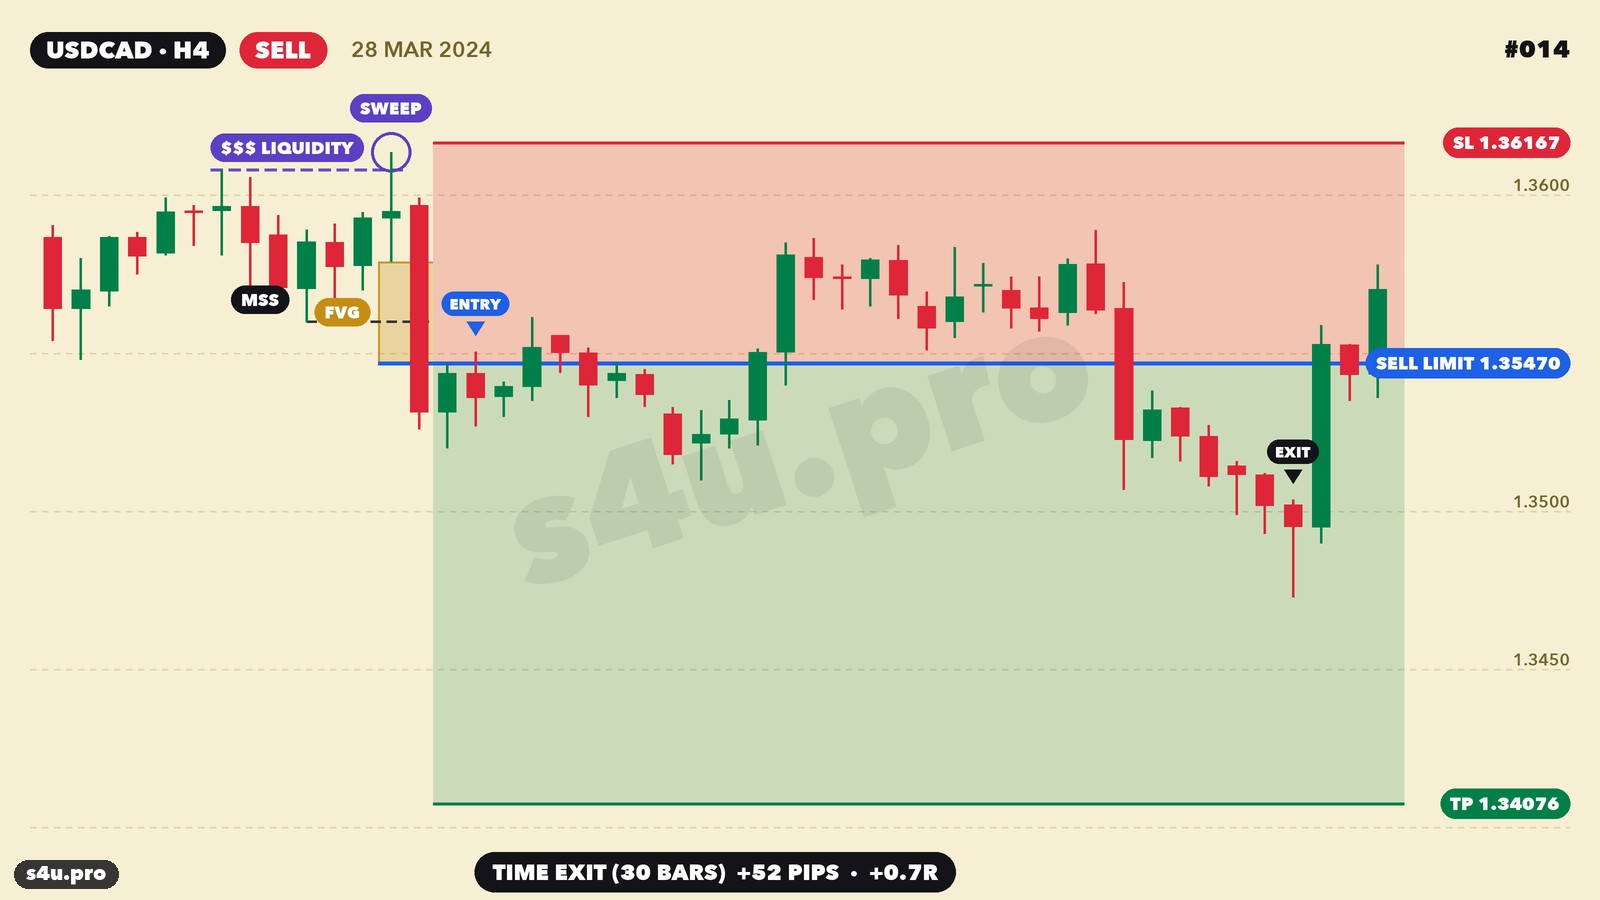
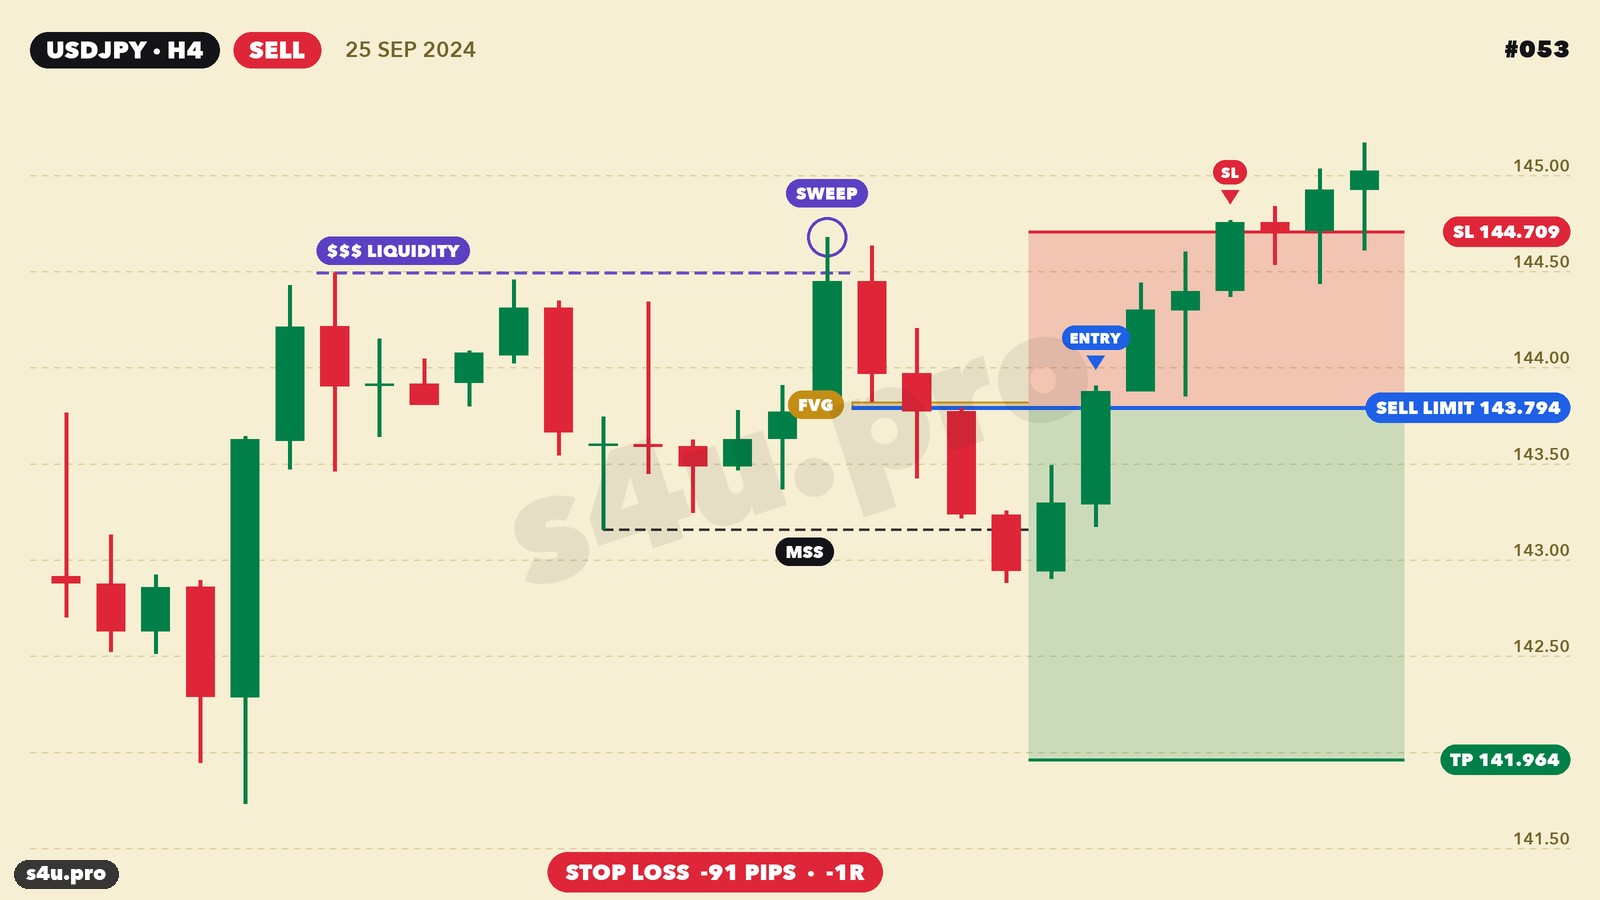
The number in the corner is the trade number in the journal. How to read the chart: the violet dashed line $$$ LIQUIDITY is the liquidity level, the SWEEP circle marks the sweep candle, the black dashed MSS line is the broken high (low), the yellow box is the FVG, the blue line is the limit order, ENTRY is the candle where it filled, red is the stop and green is the target.
Gold, Buy: July 2024 — +2R
On July 2 gold wicks below the 2328.20 low and closes above it: buyers’ stops are collected. The rally breaks structure and leaves an FVG. Buy Limit at the top of the FVG (2356.90), stop below the sweep wick (2327.10), 2R target (2416.50). The limit fills on July 5, and the target is hit on July 11: +593 pips.
EURUSD, Sell: July 2024 — +2R
On July 29 the euro wicks above the 1.08719 high and closes below it: buy-side liquidity is taken. The drop breaks the low and leaves an FVG. Sell Limit 1.08460, stop 1.08761, target 1.07857 — hit a day after the entry: +59 pips.
EURUSD, Buy: April 2025 — +2R
During the tariff panic on April 8, 2025 the euro sweeps the 1.09051 low and reverses sharply up. The Buy Limit at the FVG (1.10156) fills the next day, and the 1.12617 target is hit on April 10: +245 pips.
USDJPY, Buy: June 2025 — +2R
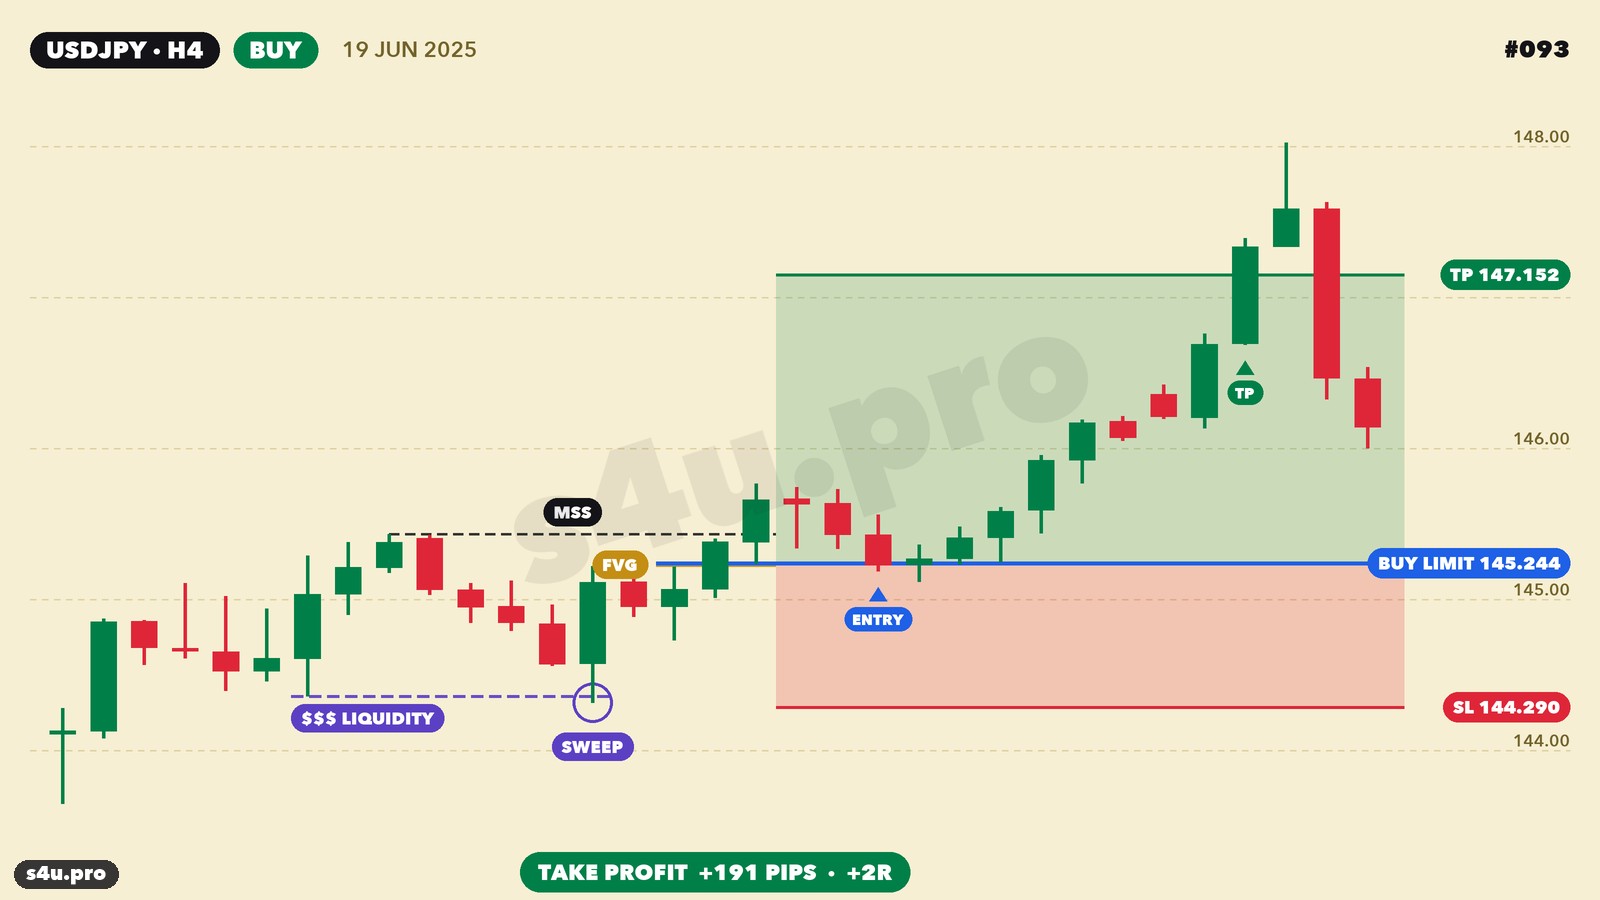
AUDUSD, Buy: May 2026 — +2R
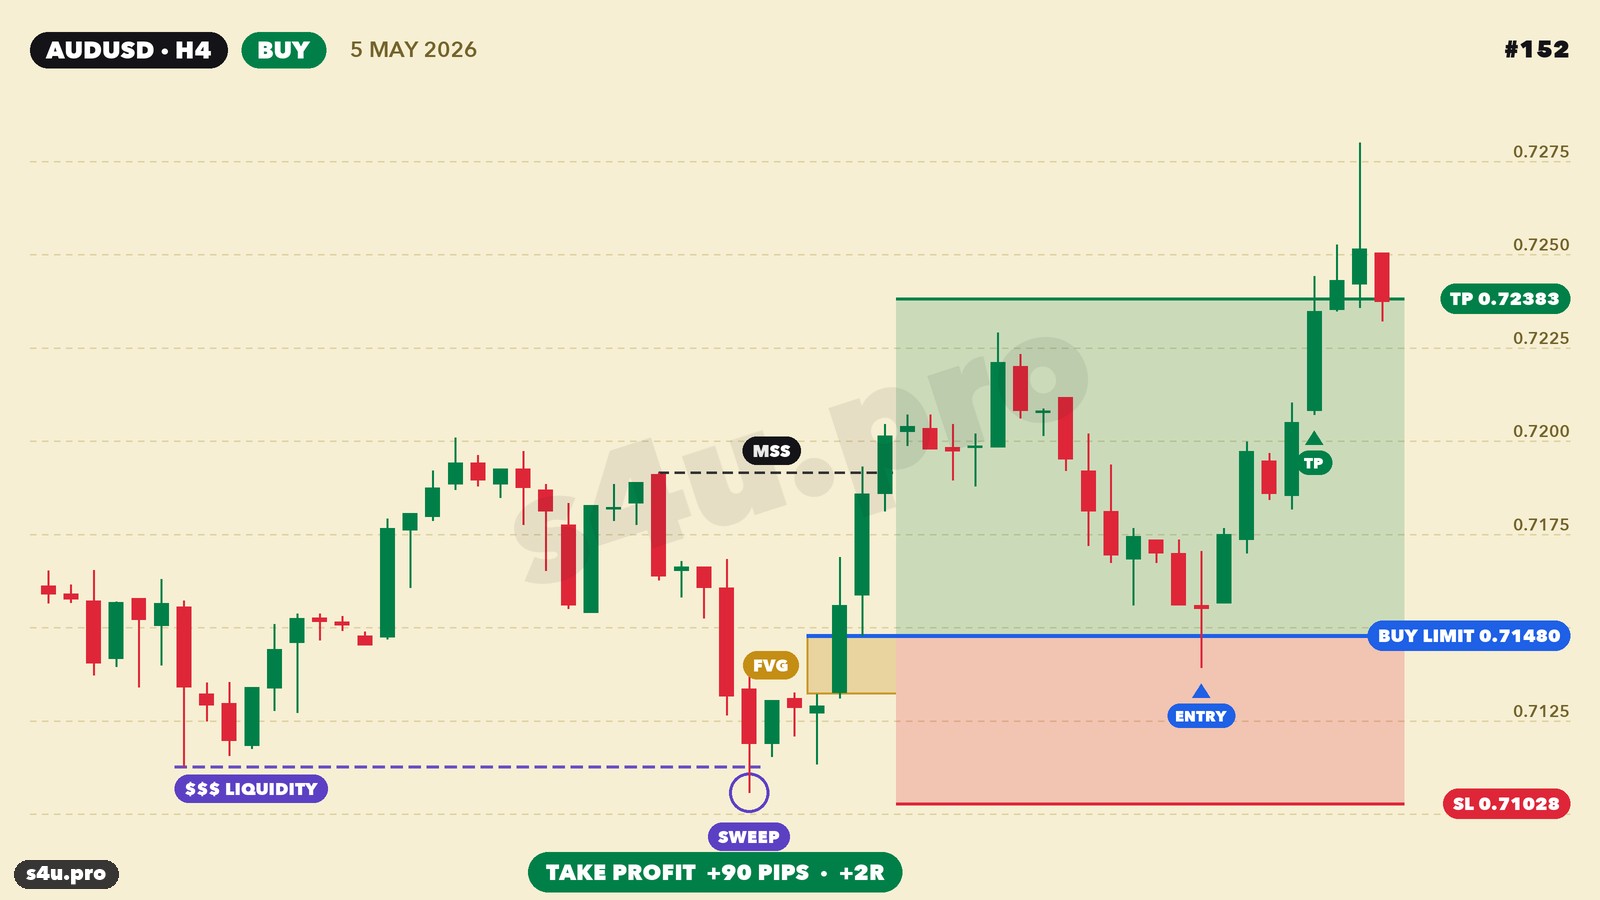
Gold, Sell: September 2026 — +2R
On September 10 gold wicks above the 4479 high and closes below it. Sell Limit at the FVG (4419.90), stop above the wick (4480.20), 2R target (4299.30) — hit on September 14: +1,203 pips. The stop is wide: this is what gold volatility looks like in 2026.
Time Exit: USDCAD, March 2024
After the entry price moved the right way but did not reach the target within 5 days. The trade was closed on time: +50 pips, +0.7R.
And This Is What Losses Look Like
There are more losing trades than winners — normal with a 2R target. A typical loss: the sweep and the structure shift are there, price returns to the FVG, but instead of reversing it keeps going and sweeps our stop too.
Gallery: All 193 Trades
Every trade of the strategy with its chart: market, date, direction, result in pips and in R. Click a card to open the full chart and use the arrows to browse. Filters show only winners, only losers, one side or one year. The chart shows the result by price movement, while the caption under the card is already net of the spread.
Table of All 193 Trades
The same trades in one table: market, open time, entry, stop, target and exit prices, result in pips (after the spread) and in R. The table scrolls inside its frame, and the 📈 button opens the trade chart.
| # | Market | Opened (UTC) | Side | Entry | Stop | Target | Exit | Result | Pips | R | Chart |
|---|---|---|---|---|---|---|---|---|---|---|---|
| 001 | GBPUSD | 08.01.24 20:00 | BUY | 1.27411 | 1.26137 | 1.29960 | 1.27275 | Time | -15 | -0.12R | |
| 002 | USDCHF | 24.01.24 04:00 | BUY | 0.86827 | 0.86466 | 0.87549 | 0.86466 | SL | -37 | -1.03R | |
| 003 | GBPJPY | 24.01.24 08:00 | SELL | 187.955 | 188.939 | 185.987 | 187.144 | Time | +80 | +0.81R | |
| 004 | GBPUSD | 25.01.24 16:00 | BUY | 1.26863 | 1.26469 | 1.27652 | 1.26469 | SL | -41 | -1.03R | |
| 005 | AUDUSD | 30.01.24 16:00 | SELL | 0.66041 | 0.66295 | 0.65535 | 0.65535 | TP | +49 | +1.95R | |
| 006 | GBPUSD | 31.01.24 16:00 | BUY | 1.26902 | 1.26391 | 1.27925 | 1.26391 | SL | -52 | -1.02R | |
| 007 | GBPUSD | 02.02.24 12:00 | BUY | 1.26823 | 1.26231 | 1.28007 | 1.26231 | SL | -60 | -1.02R | |
| 008 | GBPJPY | 07.02.24 12:00 | BUY | 186.641 | 186.131 | 187.661 | 187.661 | TP | +101 | +1.98R | |
| 009 | USDCAD | 08.02.24 00:00 | BUY | 1.34460 | 1.33580 | 1.36220 | 1.35370 | Time | +90 | +1.02R | |
| 010 | USDCAD | 22.02.24 12:00 | SELL | 1.34886 | 1.35391 | 1.33876 | 1.35391 | SL | -52 | -1.02R | |
| 011 | USDJPY | 29.02.24 12:00 | SELL | 150.108 | 150.874 | 148.576 | 148.576 | TP | +152 | +1.98R | |
| 012 | GBPUSD | 14.03.24 20:00 | SELL | 1.27574 | 1.28258 | 1.26205 | 1.26517 | Time | +105 | +1.53R | |
| 013 | USDCAD | 15.03.24 12:00 | BUY | 1.35080 | 1.34510 | 1.36220 | 1.35794 | Time | +70 | +1.23R | |
| 014 | USDCAD | 28.03.24 20:00 | SELL | 1.35470 | 1.36167 | 1.34076 | 1.34953 | Time | +50 | +0.72R | |
| 015 | NZDUSD | 01.04.24 20:00 | SELL | 0.59524 | 0.59975 | 0.58622 | 0.59975 | SL | -46 | -1.03R | |
| 016 | USDCHF | 04.04.24 04:00 | SELL | 0.90484 | 0.90983 | 0.89486 | 0.90983 | SL | -51 | -1.02R | |
| 017 | USDCAD | 04.04.24 16:00 | SELL | 1.35382 | 1.35920 | 1.34306 | 1.35920 | SL | -55 | -1.02R | |
| 018 | USDCHF | 24.04.24 12:00 | BUY | 0.91368 | 0.90834 | 0.92436 | 0.92153 | Time | +77 | +1.45R | |
| 019 | NZDUSD | 26.04.24 08:00 | BUY | 0.59556 | 0.59194 | 0.60279 | 0.59194 | SL | -37 | -1.03R | |
| 020 | EURUSD | 01.05.24 12:00 | SELL | 1.06883 | 1.07407 | 1.05836 | 1.07407 | SL | -54 | -1.02R | |
| 021 | GBPUSD | 10.05.24 12:00 | BUY | 1.25045 | 1.24455 | 1.26226 | 1.26226 | TP | +117 | +1.98R | |
| 022 | USDCHF | 10.05.24 12:00 | SELL | 0.90723 | 0.91016 | 0.90137 | 0.91016 | SL | -30 | -1.04R | |
| 023 | AUDUSD | 15.05.24 08:00 | BUY | 0.66399 | 0.65800 | 0.67597 | 0.66677 | Time | +27 | +0.44R | |
| 024 | USDCAD | 21.05.24 20:00 | BUY | 1.36400 | 1.35880 | 1.37440 | 1.36317 | Time | -9 | -0.18R | |
| 025 | GBPUSD | 04.06.24 08:00 | BUY | 1.27773 | 1.26930 | 1.29458 | 1.26930 | SL | -85 | -1.01R | |
| 026 | USDCHF | 10.06.24 12:00 | BUY | 0.89539 | 0.88777 | 0.91063 | 0.89168 | Time | -38 | -0.50R | |
| 027 | GBPUSD | 11.06.24 04:00 | BUY | 1.27251 | 1.26854 | 1.28044 | 1.28044 | TP | +78 | +1.97R | |
| 028 | USDJPY | 12.06.24 12:00 | BUY | 156.510 | 155.086 | 159.358 | 157.744 | Time | +122 | +0.86R | |
| 029 | XAUUSD | 19.06.24 00:00 | BUY | 2341.20 | 2319.90 | 2383.80 | 2319.90 | SL | -216 | -1.01R | |
| 030 | NZDUSD | 19.06.24 00:00 | BUY | 0.61387 | 0.60968 | 0.62226 | 0.61229 | Time | -17 | -0.41R | |
| 031 | AUDUSD | 01.07.24 12:00 | BUY | 0.66540 | 0.66182 | 0.67255 | 0.67255 | TP | +70 | +1.97R | |
| 032 | USDCHF | 04.07.24 04:00 | SELL | 0.90340 | 0.90534 | 0.89952 | 0.89952 | TP | +38 | +1.94R | |
| 033 | XAUUSD | 05.07.24 12:00 | BUY | 2356.90 | 2327.10 | 2416.50 | 2416.50 | TP | +593 | +1.99R | |
| 034 | USDCHF | 11.07.24 08:00 | BUY | 0.89784 | 0.89605 | 0.90142 | 0.89605 | SL | -19 | -1.07R | |
| 035 | USDJPY | 17.07.24 04:00 | BUY | 158.098 | 157.121 | 160.052 | 157.121 | SL | -99 | -1.01R | |
| 036 | GBPJPY | 17.07.24 04:00 | BUY | 205.011 | 204.087 | 206.859 | 204.087 | SL | -94 | -1.01R | |
| 037 | GBPJPY | 30.07.24 12:00 | BUY | 197.823 | 196.746 | 199.977 | 196.746 | SL | -109 | -1.01R | |
| 038 | GBPJPY | 31.07.24 00:00 | SELL | 197.386 | 199.500 | 193.158 | 193.158 | TP | +422 | +1.99R | |
| 039 | EURUSD | 31.07.24 12:00 | SELL | 1.08460 | 1.08761 | 1.07857 | 1.07857 | TP | +59 | +1.96R | |
| 040 | USDCAD | 06.08.24 08:00 | SELL | 1.38521 | 1.39495 | 1.36573 | 1.37370 | Time | +114 | +1.17R | |
| 041 | GBPUSD | 09.08.24 08:00 | BUY | 1.27329 | 1.26629 | 1.28727 | 1.28727 | TP | +139 | +1.98R | |
| 042 | NZDUSD | 09.08.24 08:00 | BUY | 0.60208 | 0.59775 | 0.61075 | 0.59775 | SL | -45 | -1.03R | |
| 043 | EURUSD | 26.08.24 08:00 | BUY | 1.11682 | 1.10995 | 1.13056 | 1.10995 | SL | -70 | -1.02R | |
| 044 | GBPJPY | 27.08.24 00:00 | SELL | 190.866 | 192.067 | 188.464 | 192.067 | SL | -121 | -1.01R | |
| 045 | NZDUSD | 28.08.24 00:00 | BUY | 0.62453 | 0.61939 | 0.63481 | 0.61939 | SL | -53 | -1.02R | |
| 046 | USDCHF | 04.09.24 12:00 | SELL | 0.85111 | 0.85406 | 0.84521 | 0.84521 | TP | +58 | +1.96R | |
| 047 | XAUUSD | 06.09.24 16:00 | BUY | 2522.50 | 2502.40 | 2562.70 | 2562.70 | TP | +399 | +1.99R | |
| 048 | USDCAD | 10.09.24 20:00 | BUY | 1.35960 | 1.35380 | 1.37120 | 1.35979 | Time | +1 | +0.01R | |
| 049 | USDCHF | 11.09.24 04:00 | BUY | 0.84354 | 0.83706 | 0.85650 | 0.84632 | Time | +27 | +0.41R | |
| 050 | GBPUSD | 12.09.24 04:00 | SELL | 1.30502 | 1.31138 | 1.29231 | 1.31138 | SL | -65 | -1.02R | |
| 051 | AUDUSD | 12.09.24 04:00 | BUY | 0.66741 | 0.66199 | 0.67825 | 0.67825 | TP | +107 | +1.98R | |
| 052 | EURUSD | 13.09.24 00:00 | SELL | 1.10828 | 1.11575 | 1.09334 | 1.11575 | SL | -76 | -1.02R | |
| 053 | USDJPY | 25.09.24 04:00 | SELL | 143.794 | 144.709 | 141.964 | 144.709 | SL | -93 | -1.01R | |
| 054 | GBPJPY | 01.10.24 12:00 | BUY | 190.994 | 189.520 | 193.942 | 193.942 | TP | +294 | +1.99R | |
| 055 | AUDUSD | 21.10.24 12:00 | SELL | 0.66948 | 0.67279 | 0.66285 | 0.66285 | TP | +65 | +1.96R | |
| 056 | GBPUSD | 28.10.24 00:00 | SELL | 1.29631 | 1.30015 | 1.28863 | 1.30015 | SL | -40 | -1.03R | |
| 057 | USDCAD | 30.10.24 08:00 | BUY | 1.38990 | 1.38690 | 1.39590 | 1.39590 | TP | +59 | +1.96R | |
| 058 | GBPJPY | 31.10.24 08:00 | SELL | 198.232 | 199.834 | 195.028 | 199.117 | Time | -90 | -0.56R | |
| 059 | USDCHF | 04.11.24 00:00 | BUY | 0.86730 | 0.86228 | 0.87734 | 0.86228 | SL | -51 | -1.02R | |
| 060 | GBPJPY | 21.11.24 04:00 | BUY | 195.871 | 193.527 | 200.559 | 193.527 | SL | -236 | -1.01R | |
| 061 | USDJPY | 21.11.24 08:00 | BUY | 154.518 | 153.242 | 157.070 | 153.242 | SL | -129 | -1.01R | |
| 062 | AUDUSD | 25.11.24 04:00 | BUY | 0.65230 | 0.64710 | 0.66270 | 0.64710 | SL | -53 | -1.02R | |
| 063 | EURUSD | 02.12.24 12:00 | SELL | 1.05396 | 1.06007 | 1.04175 | 1.06007 | SL | -62 | -1.02R | |
| 064 | USDCHF | 03.12.24 12:00 | BUY | 0.88347 | 0.87921 | 0.89199 | 0.87921 | SL | -44 | -1.03R | |
| 065 | USDJPY | 05.12.24 04:00 | BUY | 149.854 | 148.611 | 152.340 | 152.340 | TP | +247 | +1.99R | |
| 066 | NZDUSD | 30.12.24 08:00 | BUY | 0.56558 | 0.56128 | 0.57418 | 0.56128 | SL | -44 | -1.03R | |
| 067 | GBPUSD | 30.12.24 12:00 | BUY | 1.25499 | 1.24992 | 1.26513 | 1.24992 | SL | -52 | -1.02R | |
| 068 | GBPJPY | 01.01.25 20:00 | SELL | 197.285 | 198.985 | 193.885 | 195.813 | Time | +146 | +0.86R | |
| 069 | USDJPY | 13.01.25 08:00 | SELL | 157.596 | 158.909 | 154.970 | 155.990 | Time | +159 | +1.21R | |
| 070 | NZDUSD | 14.01.25 12:00 | BUY | 0.55972 | 0.55409 | 0.57100 | 0.56249 | Time | +27 | +0.47R | |
| 071 | XAUUSD | 23.01.25 08:00 | BUY | 2751.80 | 2725.20 | 2805.00 | 2773.40 | Time | +213 | +0.80R | |
| 072 | EURUSD | 31.01.25 16:00 | SELL | 1.04047 | 1.04698 | 1.02746 | 1.02746 | TP | +129 | +1.98R | |
| 073 | EURUSD | 11.02.25 16:00 | SELL | 1.03573 | 1.04056 | 1.02608 | 1.04056 | SL | -49 | -1.02R | |
| 074 | AUDUSD | 21.02.25 16:00 | BUY | 0.63656 | 0.63272 | 0.64424 | 0.63272 | SL | -40 | -1.03R | |
| 075 | USDCAD | 04.03.25 04:00 | BUY | 1.44740 | 1.43640 | 1.46940 | 1.43640 | SL | -111 | -1.01R | |
| 076 | AUDUSD | 05.03.25 00:00 | BUY | 0.62468 | 0.61856 | 0.63691 | 0.62977 | Time | +50 | +0.81R | |
| 077 | GBPUSD | 18.03.25 12:00 | BUY | 1.29606 | 1.29109 | 1.30600 | 1.29109 | SL | -51 | -1.02R | |
| 078 | USDCHF | 20.03.25 16:00 | BUY | 0.88188 | 0.87523 | 0.89518 | 0.88177 | Time | -2 | -0.03R | |
| 079 | EURUSD | 09.04.25 08:00 | BUY | 1.10156 | 1.08926 | 1.12617 | 1.12617 | TP | +245 | +1.99R | |
| 080 | NZDUSD | 10.04.25 00:00 | BUY | 0.56335 | 0.54894 | 0.59217 | 0.59217 | TP | +287 | +1.99R | |
| 081 | AUDUSD | 23.04.25 00:00 | SELL | 0.64008 | 0.64458 | 0.63109 | 0.64458 | SL | -46 | -1.03R | |
| 082 | XAUUSD | 27.04.25 20:00 | SELL | 3338.00 | 3384.40 | 3245.20 | 3245.20 | TP | +925 | +1.99R | |
| 083 | NZDUSD | 01.05.25 20:00 | SELL | 0.59158 | 0.59557 | 0.58358 | 0.59557 | SL | -41 | -1.03R | |
| 084 | GBPUSD | 07.05.25 16:00 | BUY | 1.33087 | 1.32591 | 1.34079 | 1.32591 | SL | -51 | -1.02R | |
| 085 | USDCHF | 08.05.25 12:00 | BUY | 0.82486 | 0.81822 | 0.83814 | 0.83814 | TP | +132 | +1.98R | |
| 086 | AUDUSD | 22.05.25 08:00 | BUY | 0.64206 | 0.63916 | 0.64786 | 0.64786 | TP | +57 | +1.96R | |
| 087 | USDJPY | 30.05.25 00:00 | BUY | 143.615 | 142.080 | 146.685 | 143.686 | Time | +6 | +0.04R | |
| 088 | GBPUSD | 09.06.25 00:00 | SELL | 1.35542 | 1.36186 | 1.34253 | 1.36186 | SL | -66 | -1.02R | |
| 089 | EURUSD | 09.06.25 04:00 | SELL | 1.14312 | 1.14999 | 1.12938 | 1.14999 | SL | -70 | -1.02R | |
| 090 | GBPJPY | 10.06.25 12:00 | SELL | 195.328 | 196.473 | 193.038 | 196.473 | SL | -116 | -1.01R | |
| 091 | NZDUSD | 13.06.25 00:00 | BUY | 0.60529 | 0.60055 | 0.61476 | 0.60055 | SL | -49 | -1.03R | |
| 092 | NZDUSD | 13.06.25 12:00 | SELL | 0.60285 | 0.60761 | 0.59331 | 0.60761 | SL | -49 | -1.03R | |
| 093 | USDJPY | 19.06.25 20:00 | BUY | 145.244 | 144.290 | 147.152 | 147.152 | TP | +190 | +1.99R | |
| 094 | GBPUSD | 01.07.25 12:00 | BUY | 1.37561 | 1.36730 | 1.39224 | 1.36730 | SL | -84 | -1.01R | |
| 095 | USDCAD | 01.07.25 12:00 | SELL | 1.36437 | 1.37620 | 1.34071 | 1.36360 | Time | +6 | +0.05R | |
| 096 | EURUSD | 18.07.25 00:00 | SELL | 1.16293 | 1.17222 | 1.14434 | 1.17222 | SL | -94 | -1.01R | |
| 097 | USDCHF | 18.07.25 08:00 | BUY | 0.80202 | 0.79433 | 0.81740 | 0.79433 | SL | -78 | -1.02R | |
| 098 | GBPJPY | 14.08.25 08:00 | SELL | 199.047 | 200.309 | 196.523 | 198.302 | Time | +73 | +0.58R | |
| 099 | AUDUSD | 18.08.25 20:00 | SELL | 0.64973 | 0.65279 | 0.64362 | 0.64362 | TP | +60 | +1.96R | |
| 100 | USDCAD | 20.08.25 12:00 | BUY | 1.38490 | 1.37750 | 1.39970 | 1.38459 | Time | -4 | -0.06R | |
| 101 | USDCHF | 02.09.25 08:00 | SELL | 0.80384 | 0.80795 | 0.79562 | 0.79562 | TP | +81 | +1.97R | |
| 102 | GBPJPY | 08.09.25 00:00 | BUY | 199.936 | 198.634 | 202.540 | 200.191 | Time | +24 | +0.19R | |
| 103 | GBPUSD | 07.10.25 12:00 | SELL | 1.34450 | 1.34934 | 1.33483 | 1.33483 | TP | +95 | +1.98R | |
| 104 | USDCAD | 10.10.25 12:00 | BUY | 1.40050 | 1.39250 | 1.41650 | 1.40528 | Time | +47 | +0.58R | |
| 105 | NZDUSD | 22.10.25 08:00 | BUY | 0.57412 | 0.57103 | 0.58029 | 0.57890 | Time | +47 | +1.51R | |
| 106 | USDCAD | 24.10.25 12:00 | BUY | 1.40000 | 1.39684 | 1.40632 | 1.39684 | SL | -33 | -1.04R | |
| 107 | GBPJPY | 27.10.25 04:00 | BUY | 203.562 | 203.048 | 204.590 | 203.048 | SL | -53 | -1.02R | |
| 108 | USDJPY | 30.10.25 00:00 | BUY | 152.565 | 151.500 | 154.695 | 154.076 | Time | +150 | +1.41R | |
| 109 | GBPJPY | 11.11.25 12:00 | SELL | 202.853 | 203.311 | 201.937 | 203.311 | SL | -47 | -1.03R | |
| 110 | EURUSD | 12.11.25 08:00 | BUY | 1.15727 | 1.15417 | 1.16348 | 1.16348 | TP | +61 | +1.96R | |
| 111 | GBPUSD | 14.11.25 04:00 | BUY | 1.31320 | 1.30828 | 1.32304 | 1.30828 | SL | -50 | -1.02R | |
| 112 | USDJPY | 18.11.25 04:00 | BUY | 155.052 | 153.581 | 157.994 | 156.773 | Time | +171 | +1.16R | |
| 113 | USDCHF | 01.12.25 00:00 | SELL | 0.80394 | 0.80743 | 0.79696 | 0.80456 | Time | -7 | -0.21R | |
| 114 | USDCAD | 01.12.25 04:00 | SELL | 1.39862 | 1.40541 | 1.38504 | 1.38504 | TP | +135 | +1.98R | |
| 115 | GBPUSD | 03.12.25 00:00 | SELL | 1.32237 | 1.32772 | 1.31166 | 1.32772 | SL | -55 | -1.02R | |
| 116 | GBPUSD | 10.12.25 04:00 | SELL | 1.33186 | 1.33581 | 1.32397 | 1.33581 | SL | -41 | -1.03R | |
| 117 | USDCAD | 11.12.25 00:00 | SELL | 1.38147 | 1.38750 | 1.36941 | 1.37845 | Time | +29 | +0.48R | |
| 118 | AUDUSD | 17.12.25 12:00 | SELL | 0.66287 | 0.66635 | 0.65591 | 0.66635 | SL | -36 | -1.03R | |
| 119 | USDCHF | 17.12.25 12:00 | BUY | 0.79560 | 0.79227 | 0.80226 | 0.79227 | SL | -35 | -1.04R | |
| 120 | GBPUSD | 31.12.25 20:00 | SELL | 1.34831 | 1.35339 | 1.33815 | 1.35339 | SL | -52 | -1.02R | |
| 121 | NZDUSD | 05.01.26 00:00 | BUY | 0.57537 | 0.57385 | 0.57842 | 0.57842 | TP | +29 | +1.92R | |
| 122 | AUDUSD | 06.01.26 00:00 | BUY | 0.67141 | 0.66637 | 0.68150 | 0.67096 | Time | -6 | -0.11R | |
| 123 | AUDUSD | 13.01.26 12:00 | BUY | 0.66948 | 0.66632 | 0.67579 | 0.67395 | Time | +43 | +1.38R | |
| 124 | XAUUSD | 14.01.26 20:00 | BUY | 4624.70 | 4576.40 | 4721.30 | 4576.40 | SL | -486 | -1.01R | |
| 125 | NZDUSD | 16.01.26 12:00 | BUY | 0.57541 | 0.57247 | 0.58128 | 0.58128 | TP | +58 | +1.96R | |
| 126 | EURJPY | 23.01.26 04:00 | BUY | 185.451 | 184.771 | 186.811 | 184.771 | SL | -69 | -1.02R | |
| 127 | GBPUSD | 12.02.26 12:00 | SELL | 1.36674 | 1.37157 | 1.35707 | 1.35707 | TP | +96 | +1.98R | |
| 128 | NZDUSD | 12.02.26 16:00 | BUY | 0.60613 | 0.60269 | 0.61302 | 0.60269 | SL | -36 | -1.03R | |
| 129 | EURJPY | 17.02.26 12:00 | SELL | 181.406 | 182.327 | 179.564 | 182.327 | SL | -93 | -1.01R | |
| 130 | GBPJPY | 18.02.26 08:00 | SELL | 208.521 | 209.713 | 206.137 | 209.713 | SL | -120 | -1.01R | |
| 131 | USDCAD | 27.02.26 20:00 | SELL | 1.36410 | 1.37155 | 1.34920 | 1.37155 | SL | -76 | -1.02R | |
| 132 | EURGBP | 02.03.26 12:00 | BUY | 0.87408 | 0.87011 | 0.88202 | 0.87011 | SL | -41 | -1.03R | |
| 133 | EURUSD | 09.03.26 08:00 | SELL | 1.15741 | 1.16282 | 1.14658 | 1.16282 | SL | -55 | -1.02R | |
| 134 | AUDUSD | 13.03.26 04:00 | BUY | 0.70373 | 0.69569 | 0.71981 | 0.70826 | Time | +44 | +0.55R | |
| 135 | EURGBP | 23.03.26 08:00 | BUY | 0.86333 | 0.86083 | 0.86833 | 0.86833 | TP | +49 | +1.95R | |
| 136 | USDCHF | 24.03.26 20:00 | BUY | 0.78995 | 0.78311 | 0.80363 | 0.80363 | TP | +136 | +1.98R | |
| 137 | NZDUSD | 01.04.26 00:00 | BUY | 0.57432 | 0.56986 | 0.58323 | 0.56986 | SL | -46 | -1.03R | |
| 138 | EURUSD | 06.04.26 12:00 | BUY | 1.15447 | 1.15071 | 1.16198 | 1.16198 | TP | +74 | +1.97R | |
| 139 | USDCHF | 06.04.26 16:00 | SELL | 0.79866 | 0.80213 | 0.79172 | 0.79172 | TP | +68 | +1.97R | |
| 140 | USDCAD | 13.04.26 00:00 | BUY | 1.38660 | 1.37920 | 1.40140 | 1.37920 | SL | -75 | -1.02R | |
| 141 | USDCHF | 13.04.26 00:00 | BUY | 0.79250 | 0.78513 | 0.80724 | 0.78513 | SL | -75 | -1.02R | |
| 142 | EURGBP | 13.04.26 04:00 | BUY | 0.87156 | 0.86948 | 0.87572 | 0.86948 | SL | -22 | -1.06R | |
| 143 | EURJPY | 17.04.26 08:00 | BUY | 187.624 | 187.066 | 188.740 | 187.066 | SL | -57 | -1.02R | |
| 144 | GBPUSD | 17.04.26 12:00 | SELL | 1.35606 | 1.35975 | 1.34867 | 1.35975 | SL | -38 | -1.03R | |
| 145 | NZDUSD | 17.04.26 12:00 | SELL | 0.58980 | 0.59258 | 0.58424 | 0.59258 | SL | -29 | -1.04R | |
| 146 | AUDJPY | 17.04.26 20:00 | SELL | 113.722 | 114.404 | 112.358 | 113.961 | Time | -25 | -0.37R | |
| 147 | XAUUSD | 20.04.26 00:00 | SELL | 4815.00 | 4918.00 | 4609.00 | 4694.80 | Time | +1,199 | +1.16R | |
| 148 | GBPUSD | 20.04.26 08:00 | SELL | 1.35224 | 1.36018 | 1.33634 | 1.35457 | Time | -25 | -0.31R | |
| 149 | GBPJPY | 28.04.26 00:00 | BUY | 215.508 | 214.808 | 216.908 | 214.808 | SL | -71 | -1.02R | |
| 150 | USDCHF | 30.04.26 08:00 | BUY | 0.78640 | 0.78274 | 0.79372 | 0.78274 | SL | -38 | -1.03R | |
| 151 | USDCHF | 04.05.26 12:00 | BUY | 0.78205 | 0.77756 | 0.79103 | 0.77756 | SL | -46 | -1.03R | |
| 152 | AUDUSD | 05.05.26 04:00 | BUY | 0.71480 | 0.71028 | 0.72383 | 0.72383 | TP | +89 | +1.97R | |
| 153 | NZDUSD | 05.05.26 12:00 | SELL | 0.58962 | 0.59286 | 0.58315 | 0.59286 | SL | -34 | -1.04R | |
| 154 | EURUSD | 05.05.26 20:00 | SELL | 1.17261 | 1.17913 | 1.15957 | 1.17913 | SL | -66 | -1.02R | |
| 155 | XAUUSD | 12.05.26 04:00 | BUY | 4716.80 | 4654.80 | 4840.80 | 4654.80 | SL | -623 | -1.00R | |
| 156 | USDCAD | 08.06.26 08:00 | BUY | 1.39280 | 1.38600 | 1.40640 | 1.39630 | Time | +34 | +0.50R | |
| 157 | GBPJPY | 11.06.26 12:00 | BUY | 213.887 | 212.892 | 215.877 | 213.539 | Time | -36 | -0.36R | |
| 158 | GBPUSD | 11.06.26 16:00 | SELL | 1.33745 | 1.34258 | 1.32719 | 1.34258 | SL | -52 | -1.02R | |
| 159 | AUDUSD | 12.06.26 00:00 | BUY | 0.70452 | 0.69798 | 0.71762 | 0.70171 | Time | -29 | -0.45R | |
| 160 | AUDJPY | 17.06.26 16:00 | BUY | 112.541 | 112.000 | 113.623 | 112.000 | SL | -55 | -1.02R | |
| 161 | USDCAD | 25.06.26 20:00 | SELL | 1.42026 | 1.42511 | 1.41056 | 1.41830 | Time | +18 | +0.38R | |
| 162 | AUDJPY | 30.06.26 12:00 | BUY | 111.573 | 111.255 | 112.209 | 112.209 | TP | +62 | +1.96R | |
| 163 | USDCHF | 01.07.26 12:00 | BUY | 0.80887 | 0.80596 | 0.81469 | 0.80596 | SL | -30 | -1.04R | |
| 164 | EURUSD | 07.07.26 20:00 | BUY | 1.14038 | 1.13632 | 1.14850 | 1.14299 | Time | +25 | +0.61R | |
| 165 | XAUUSD | 08.07.26 00:00 | SELL | 4126.70 | 4192.70 | 3994.70 | 3994.70 | TP | +1,317 | +2.00R | |
| 166 | NZDUSD | 08.07.26 08:00 | BUY | 0.57035 | 0.56717 | 0.57671 | 0.57671 | TP | +62 | +1.96R | |
| 167 | EURGBP | 09.07.26 00:00 | SELL | 0.85301 | 0.85580 | 0.84743 | 0.84743 | TP | +55 | +1.96R | |
| 168 | GBPUSD | 09.07.26 12:00 | BUY | 1.33849 | 1.33215 | 1.35118 | 1.35118 | TP | +126 | +1.98R | |
| 169 | EURJPY | 10.07.26 00:00 | BUY | 185.139 | 184.718 | 185.981 | 184.718 | SL | -43 | -1.03R | |
| 170 | GBPJPY | 10.07.26 00:00 | BUY | 217.311 | 216.225 | 219.483 | 219.483 | TP | +216 | +1.99R | |
| 171 | EURGBP | 21.07.26 08:00 | SELL | 0.85150 | 0.85473 | 0.84504 | 0.85473 | SL | -34 | -1.04R | |
| 172 | EURJPY | 28.07.26 00:00 | SELL | 186.279 | 186.763 | 185.311 | 186.763 | SL | -50 | -1.02R | |
| 173 | AUDJPY | 28.07.26 12:00 | SELL | 114.258 | 114.692 | 113.390 | 113.390 | TP | +86 | +1.97R | |
| 174 | GBPJPY | 30.07.26 08:00 | BUY | 218.033 | 217.123 | 219.853 | 217.123 | SL | -92 | -1.01R | |
| 175 | AUDJPY | 10.08.26 00:00 | BUY | 111.503 | 110.725 | 113.059 | 112.879 | Time | +136 | +1.75R | |
| 176 | GBPUSD | 13.08.26 08:00 | SELL | 1.35013 | 1.35436 | 1.34167 | 1.35436 | SL | -44 | -1.03R | |
| 177 | USDCAD | 13.08.26 08:00 | BUY | 1.39320 | 1.39000 | 1.39960 | 1.39000 | SL | -33 | -1.04R | |
| 178 | AUDUSD | 13.08.26 12:00 | SELL | 0.70661 | 0.70957 | 0.70070 | 0.70957 | SL | -31 | -1.04R | |
| 179 | EURUSD | 25.08.26 20:00 | SELL | 1.16877 | 1.17181 | 1.16269 | 1.16269 | TP | +60 | +1.96R | |
| 180 | USDCHF | 27.08.26 12:00 | BUY | 0.80294 | 0.80025 | 0.80832 | 0.80832 | TP | +53 | +1.96R | |
| 181 | USDCHF | 30.08.26 20:00 | BUY | 0.80886 | 0.80211 | 0.82236 | 0.80972 | Time | +7 | +0.11R | |
| 182 | EURJPY | 01.09.26 00:00 | SELL | 185.643 | 186.015 | 184.899 | 184.899 | TP | +73 | +1.97R | |
| 183 | AUDUSD | 01.09.26 12:00 | SELL | 0.71572 | 0.71859 | 0.70998 | 0.71859 | SL | -30 | -1.04R | |
| 184 | NZDUSD | 01.09.26 12:00 | SELL | 0.59042 | 0.59331 | 0.58464 | 0.58464 | TP | +57 | +1.96R | |
| 185 | XAUUSD | 11.09.26 12:00 | SELL | 4419.90 | 4480.20 | 4299.30 | 4299.30 | TP | +1,203 | +2.00R | |
| 186 | EURJPY | 22.09.26 20:00 | SELL | 180.270 | 180.852 | 179.106 | 180.852 | SL | -59 | -1.02R | |
| 187 | GBPUSD | 01.10.26 00:00 | BUY | 1.32563 | 1.32001 | 1.33687 | 1.32001 | SL | -57 | -1.02R | |
| 188 | USDJPY | 01.10.26 12:00 | BUY | 157.230 | 156.340 | 159.010 | 158.180 | Time | +94 | +1.05R | |
| 189 | USDCHF | 09.10.26 12:00 | SELL | 0.83173 | 0.83495 | 0.82529 | 0.83495 | SL | -33 | -1.04R | |
| 190 | AUDJPY | 12.10.26 20:00 | BUY | 110.228 | 109.585 | 111.514 | 109.585 | SL | -65 | -1.02R | |
| 191 | XAUUSD | 13.10.26 00:00 | SELL | 4205.70 | 4242.60 | 4131.90 | 4131.90 | TP | +735 | +1.99R | |
| 192 | AUDUSD | 13.10.26 08:00 | SELL | 0.69803 | 0.69989 | 0.69431 | 0.69989 | SL | -20 | -1.06R | |
| 193 | NZDUSD | 14.10.26 12:00 | BUY | 0.56035 | 0.55786 | 0.56533 | 0.55786 | SL | -26 | -1.05R | |
| Total: 193 | +26.9R | ||||||||||
- Click “Download the Excel journal via the bot” and tap “Start” in Telegram.
- Used the bot before and there is no “Start” button? Just send the bot the message /start.
- Not subscribed to @strategy4you yet — the bot will ask you to subscribe: subscribe and tap “✅ I’ve subscribed”. Already subscribed — the bot goes straight to the next step.
- The bot sends a “Get the EA for free” button — tap it to open the bonus page.
- On the page find the “📊 Strategy trade journals” block and click “Download Excel” (the “Download indicator” button is right next to it).
How to Calculate Lot Size
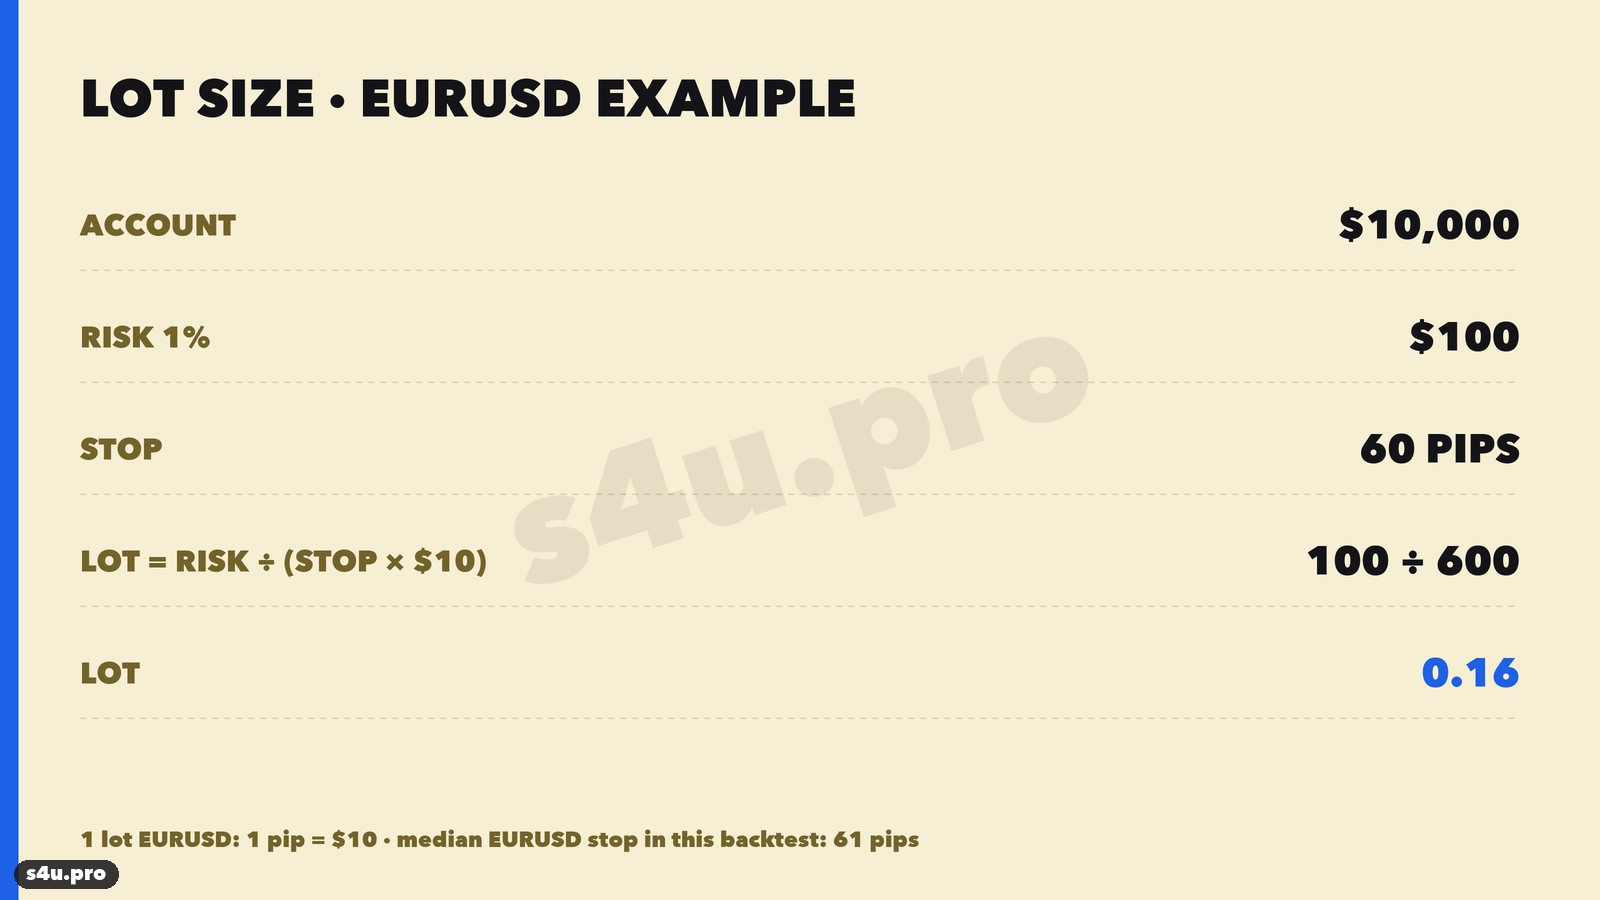
For pairs with the US dollar second (EURUSD, GBPUSD, AUDUSD, NZDUSD), 1 pip on a standard lot = $10. The formula:
Lot = Risk in $ ÷ (Stop in pips × $10)Example: a $10,000 account, 1% risk = $100, a 60-pip stop (the median EURUSD stop in this test is 61 pips) → 100 ÷ (60 × 10) = 0.16 lots. On gold 1 lot = 100 ounces, so a $1 move = $100 per lot.
Common Liquidity Sweep Trading Mistakes
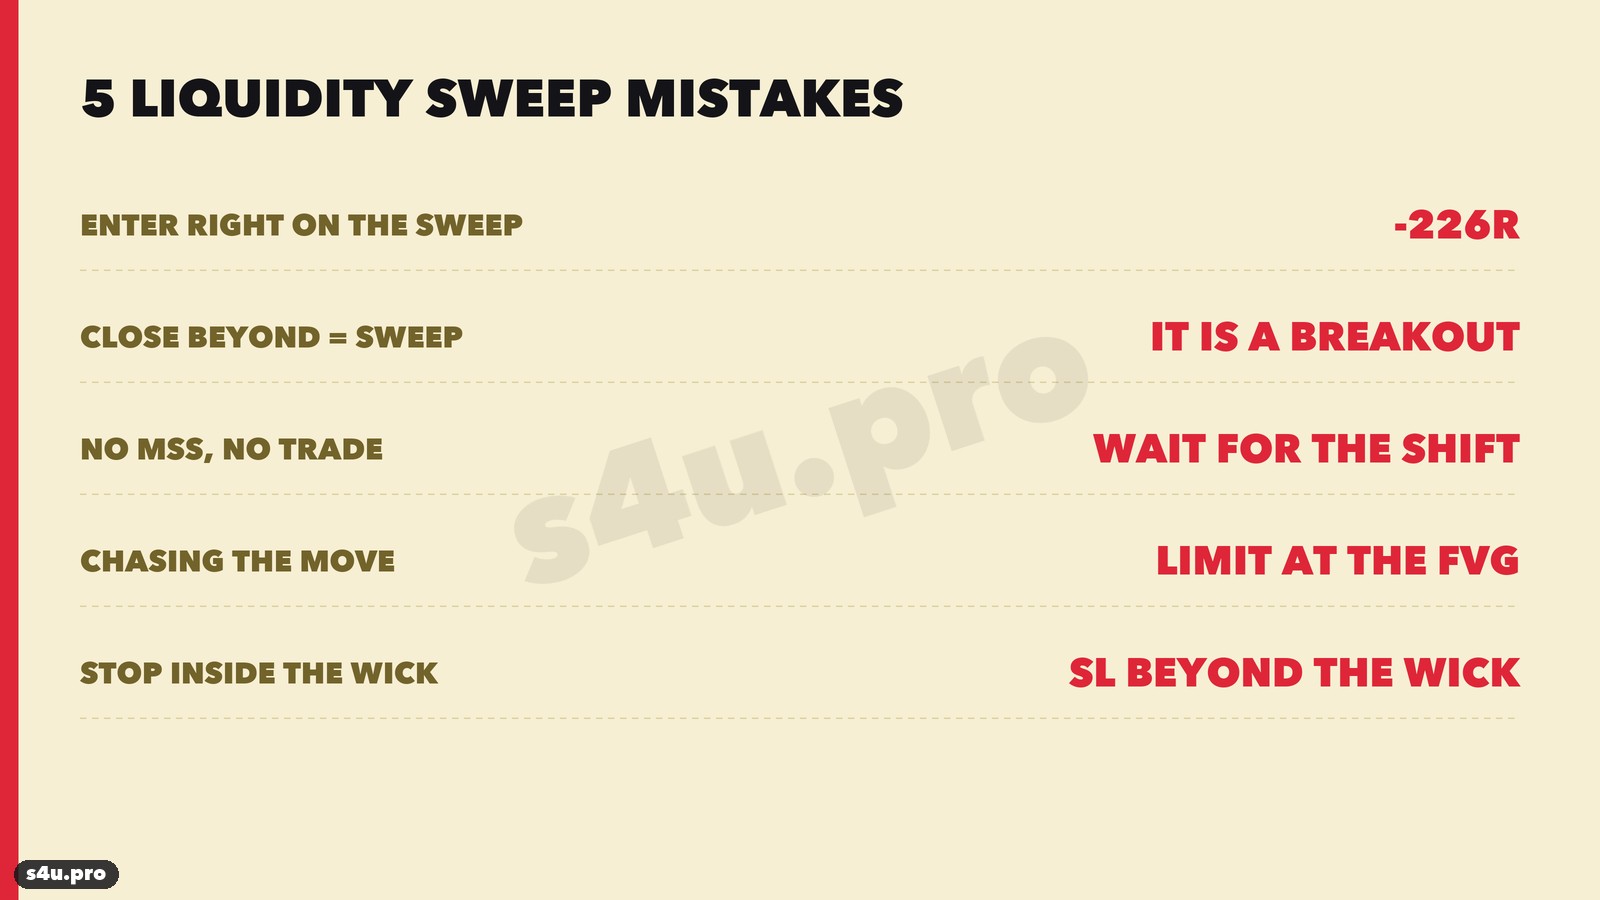
- Entering right on the sweep candle. Across 12 markets that is −226.5R. A sweep is a reason to watch the chart, not a signal.
- Confusing a sweep with a breakout. If the candle body closed beyond the level, it is a breakout. Do not trade against it.
- Entering without a structure shift. The MSS shows that price really reversed after the sweep.
- Chasing the price. After the shift price is already far away. A limit at the FVG gives a better price and a smaller stop.
- Placing the stop inside the wick. The stop goes beyond the sweep candle’s extreme; otherwise the next poke takes you out too.
FAQ: Liquidity Sweeps
Which timeframe is best?
H4. On H1 the same model (sweep → MSS → FVG) on 10 markets was around break-even (−3.3R over 724 trades): small sweeps happen too often, and the spread eats a noticeable part of the stop.
Which liquidity should you trade: swing lows, the previous day’s low, equal lows?
We tested all three. Without confirmation every version loses. With confirmation, fractal swing lows work best. The previous day’s low gives good trades on gold, but around break-even on forex.
How is a Liquidity Sweep different from Turtle Soup?
Turtle Soup is a special case of a sweep: a false break of a 20-day extreme on daily candles. The Liquidity Sweep is the general idea for any level and timeframe.
Can you enter at an order block instead of the FVG?
You can, but it is weaker: +9.2R vs +26.9R on the same markets. When the order block and the FVG sit together, there are fewer trades and a lower result (+13.9R). More about these models in our articles “Fair Value Gap (FVG)” and “Order Block”.
Why a 2R target and not the opposite liquidity?
We tested a target at the nearest opposite high (low) — as ICT often suggests — when it is at least 1.5R away. It works too: 118 trades, +21.2R, profit factor 1.33. But there are fewer trades (the target is often too close), and the total is lower than with a fixed 2R (+26.9R). A fixed target is also simpler.
Is this guaranteed profit?
No. This is a historical result: 193 trades, +26.9R, profit factor 1.27. The edge is modest, and future results may be worse.
Video: Liquidity Sweep Step by Step on Real Trades
Conclusion
- A Liquidity Sweep is a wick through a liquidity level with a close back inside. If the body closes beyond the level, it is a breakout.
- A sweep on its own loses: −226.5R over 2,132 trades on 12 markets.
- The working model is sweep → market structure shift (MSS) → limit at the FVG, stop beyond the wick, 2R target: +26.9R on 193 trades, profitable every year 2024–2026.
- The best timeframe is H4; on H1 the same model is around break-even.
- The best markets are gold, AUDUSD and USDJPY. GBPUSD, EURJPY and NZDUSD lost, but trade the whole basket rather than picking “winners” afterwards.
Before trading a live account, test the strategy on demo and keep your own trade journal, like the one in this article.
This article is for educational purposes only and is not investment advice. Trading Forex and CFDs carries a high risk of losing money. Past results do not guarantee future profits. Data: 4-hour candles built from hourly data (Yahoo Finance), gold = COMEX futures (GC), times in UTC; your broker’s quotes may differ slightly.