Contents 14
- Larry Williams’ most famous strategies
- Testing the classics: Williams’ strategies on daily charts
- Larry Williams strategy: the rules
- Statistics: 4,016 trades over 16 years
- What changes the result
- Why it works
- Williams and Silver Bullet: two strategies on one index
- Trade examples step by step
- Gallery: every trade of 2025–2026
- How to calculate the lot size
- Common mistakes
- FAQ
- Conclusion
- Other strategies we have backtested
Larry Williams is one of the best-known traders in the world. In 1987 he won the Robbins World Cup Championship and turned $10,000 into $1.1 million in 12 months — +11,376%, a record that still stands. His main tool that year was a volatility breakout on S&P 500 futures: take a part of yesterday’s range, add it to today’s open and enter with a stop order in whichever direction price goes first.
We tested the six most famous Larry Williams strategies exactly as they are described in his books, and then put the volatility breakout back where it was born — at the New York stock exchange open at 9:30 — on the Nasdaq 100 index. The test runs on 1-minute NAS100 quotes from November 2010 to October 2026, with the spread deducted from every trade.
❗ R = the stop size: −1R means the stop was hit, +3R is a profit of three stops. On NAS100 1R ≈ 170 points; at 0.25% risk 1R = 0.25% of the account. More ▾
R is the size of the stop in a trade. 1R = the distance from the entry to the stop loss. If the stop is hit, the trade made −1R. If price moved three stops in our favour — +3R.
In points: the stop in this strategy is half of yesterday’s NAS100 range. In 2026 the median stop was 170 points, so 1R ≈ 170 points and the 3R target ≈ 510 points.
In money: if you risk 0.25% of the account per trade, 1R = 0.25% of the account and +3R = +0.75%.
We count in R, not in points, because every trade has its own stop and the Nasdaq grew about 14 times in 16 years: R lets us add up trades from 2011 and 2026 fairly. The whole test result is +280R = +16,595 NAS100 points.
⏰ Times are New York: orders at 9:30 = 16:30 server time (GMT+2/GMT+3), exit at 16:00 = 23:00 server time. More ▾
The strategy is tied to the US stock market open, so all rules use New York time:
- 9:30 New York (exchange open, place the orders) = 16:30 server time GMT+2 in winter / GMT+3 in summer (the MT4/MT5 clock of most brokers), 14:30 GMT in winter and 13:30 GMT in summer;
- 12:00 New York (delete unfilled orders) = 19:00 server time;
- 16:00 New York (exchange close, close the trade) = 23:00 server time, 21:00 GMT in winter and 20:00 GMT in summer.
Yesterday’s range is measured in exchange hours too: 9:30–16:00 New York, i.e. 16:30–23:00 server time. For Europe this is the afternoon and evening.
“Summer” means US daylight saving time: from the second Sunday of March to the first Sunday of November. Europe changes its clocks on other dates (the last Sunday of March and October), so for 2–3 weeks a year the gap to New York is one hour shorter. In those weeks go by the New York clock.
Larry Williams’ most famous strategies
Williams wrote more than ten books; the main one is Long-Term Secrets to Short-Term Trading (1999). Traders most often take six ideas from it and from his seminars:
- Volatility Breakout. Buy if price rises from the daily open by a part of yesterday’s range, sell if it falls by the same amount. This is the strategy Williams won the 1987 championship with.
- Oops! The day opens with a gap below yesterday’s low and then price comes back up to that low — buy: “the crowd got it wrong”. The reverse for sells.
- Smash Day. The day closes below yesterday’s low — the next day buy with a stop order above that day’s high: a reversal after a false breakout.
- Outside Day. A candle engulfs yesterday’s on both sides and closes below yesterday’s low — buy at the next open.
- 3-bar high/low system. Two 3-period moving averages — of the highs and of the lows. Enter on a pullback to the average of the lows, exit at the average of the highs.
- Williams %R. Williams’ oscillator: leaving the oversold zone −80 upwards — buy, leaving the overbought zone −20 downwards — sell.
Testing the classics: Williams’ strategies on daily charts
First we tested all six strategies as written: daily candles, 19 markets (forex pairs, gold, NAS100 and the S&P 500), 1-minute quotes from 2005 to 2026 — so that we know honestly what is hit first inside the day, the stop or the target. Spread included.
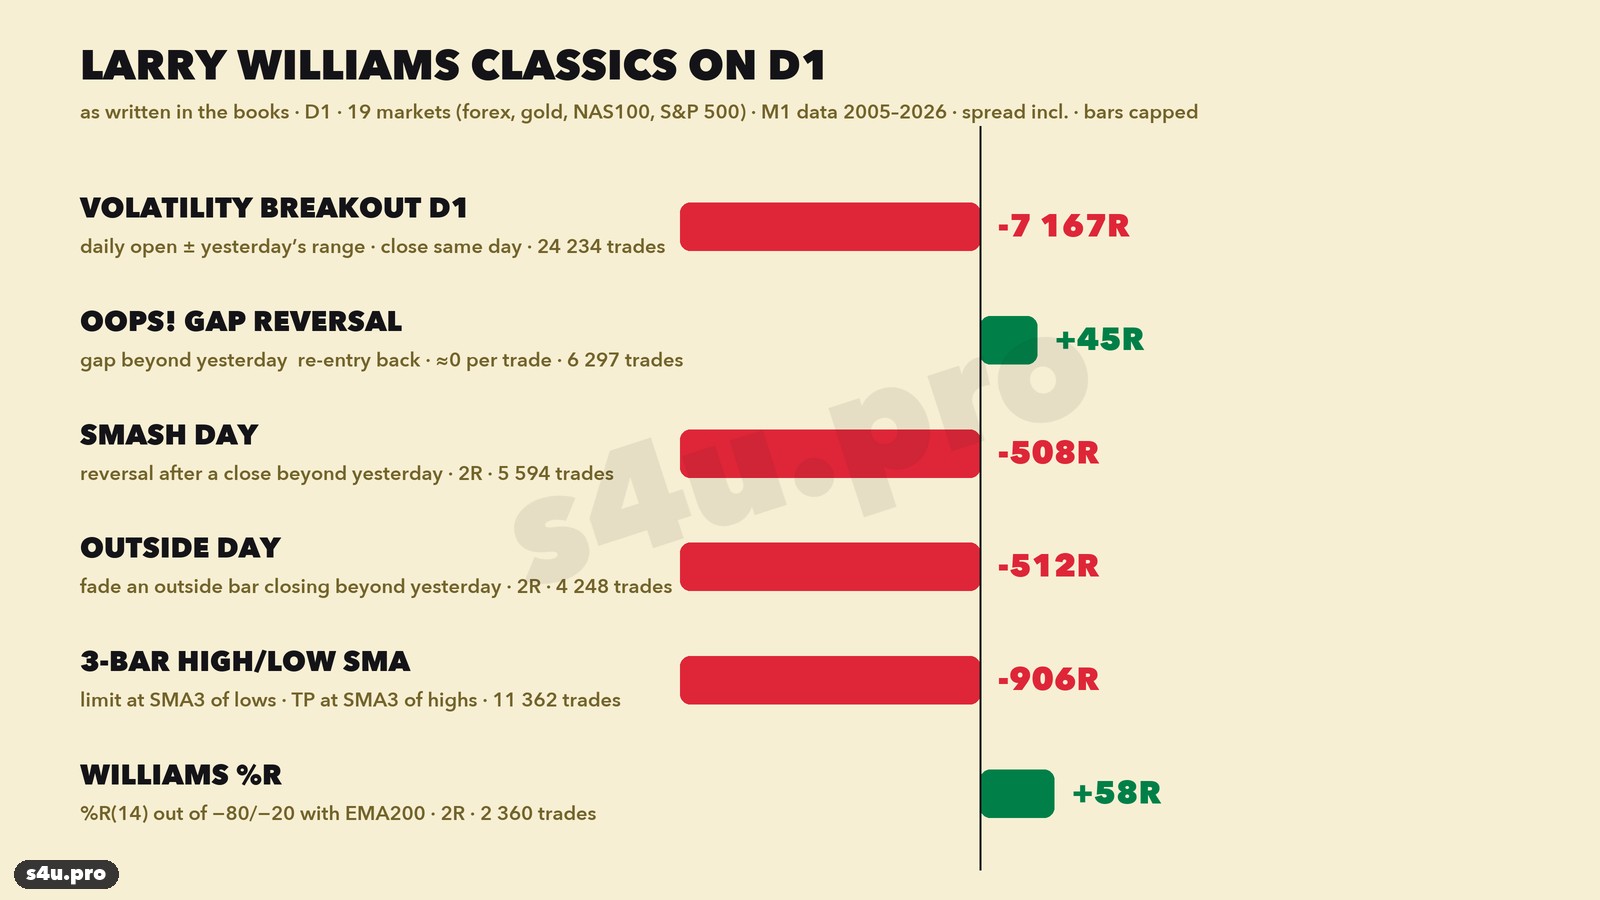
- Volatility breakout on daily charts (from the daily open at 00:00 server time, exit on the close) — a heavy loss: at night and in the Asian session price jerks around, stop orders are filled on random moves, and on forex the spread eats the rest.
- Oops! — about zero (+0.007R per trade). Around-the-clock markets have almost no real gaps.
- Smash Day, Outside Day, the 3-bar system — negative on most markets and timeframes (we checked D1, H4 and H1).
- Williams %R — a small profit, almost all of it from buys: markets simply went up over these years.
Why? Williams traded futures with a day session: in the 1980s the S&P 500 day began with the exchange open, not at midnight. The exchange open is the moment when all orders collected overnight hit the market at once and price chooses a direction for the day. So we took Williams’ main idea — the volatility breakout — and tied it to the New York stock exchange open at 9:30.
Larry Williams strategy: the rules
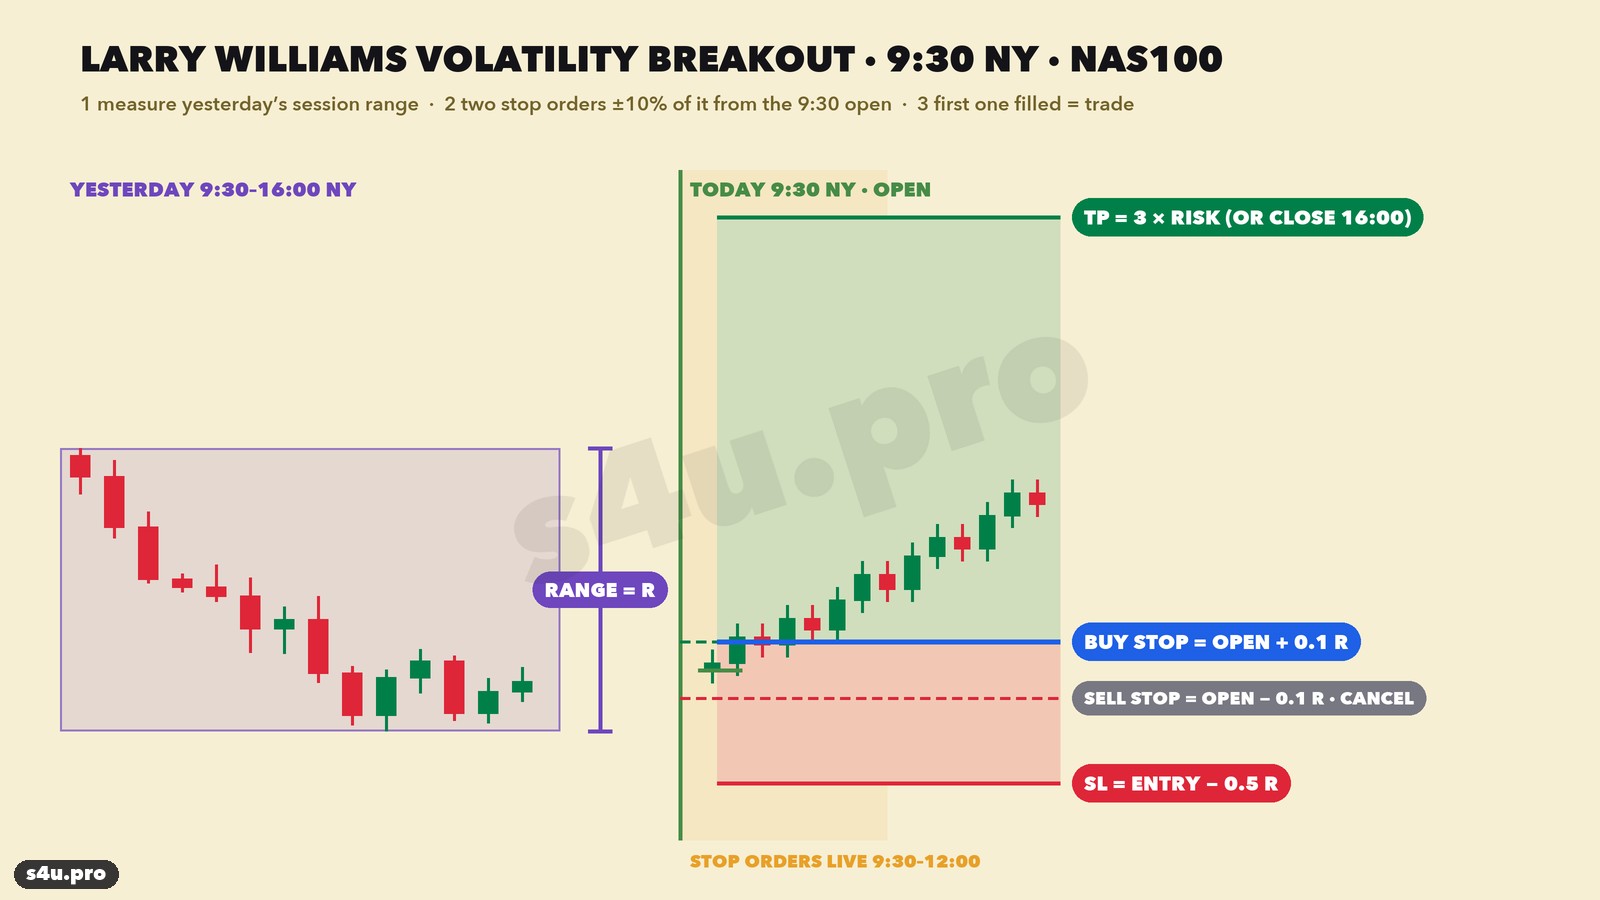
Market: NAS100 (Nasdaq 100, CFD or futures). Timeframe: any intraday chart, M5 is convenient. Time: New York.
- Yesterday’s range. Take the high and the low of yesterday’s session from 9:30 to 16:00 New York (16:30–23:00 server time GMT+2/GMT+3). The difference is the range D. Night hours are not counted.
- Orders at 9:30. Today at 9:30 New York (16:30 server time) note the opening price. Place a buy stop at open + 0.1 × D and a sell stop at open − 0.1 × D.
- Entry. Whichever order fills first is the trade. Delete the other order at once. If neither is filled by 12:00 New York (19:00 server time), there is no trade today (in practice the order fills within the first half hour on 99% of days).
- Stop — 0.5 × D away from the entry price: below for a buy, above for a sell.
- Target — 3R, i.e. three stop sizes (1.5 × D from the entry). If neither the stop nor the target is hit by 16:00 New York (23:00 server time), close the trade at market. On short days before US holidays the exchange closes early — then close before the session ends.
- One trade per day. No positions overnight.
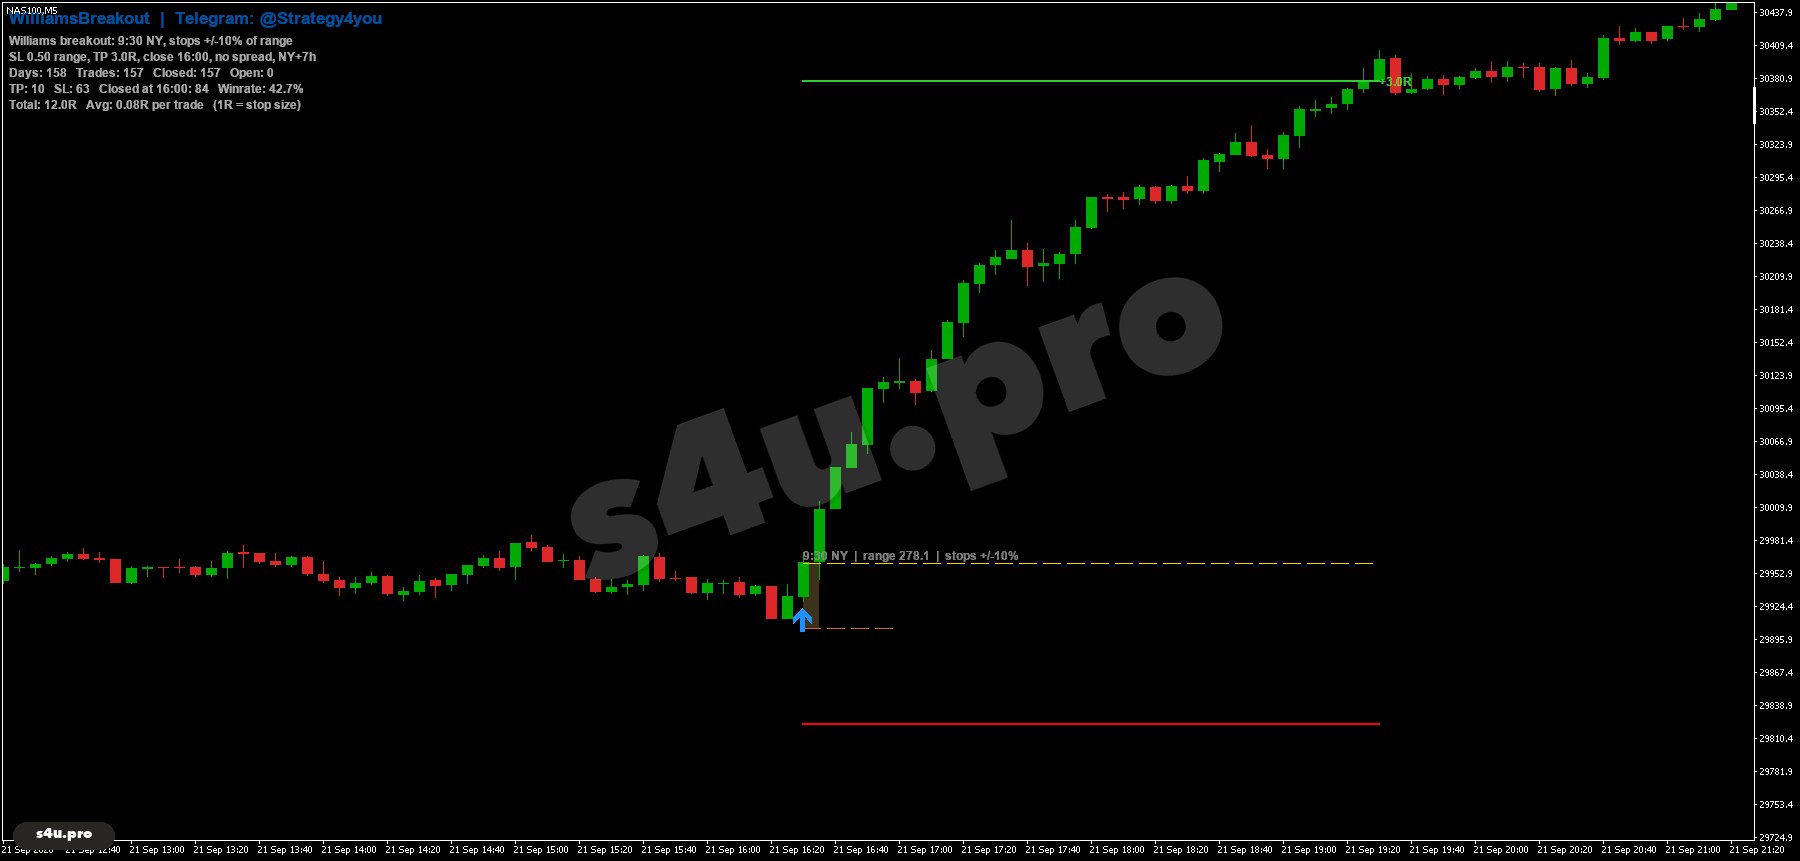
A worked example: yesterday NAS100 traded between 28,972 and 29,166 from 9:30 to 16:00 — the range D = 194 points. Today the 9:30 open is 29,204. Buy stop = 29,204 + 19 = 29,223, sell stop = 29,204 − 19 = 29,184. The buy stop is filled — the stop is 97 points below the entry (29,126), the target 291 points above (29,514). This is a real trade from 3 September 2026 — it is among the examples below.
The median yesterday’s NAS100 range in 2026 was about 340 points, the stop about 170 points. A trade usually lasts until the exchange close: more than half of all trades are closed by time at 16:00.
Statistics: 4,016 trades over 16 years
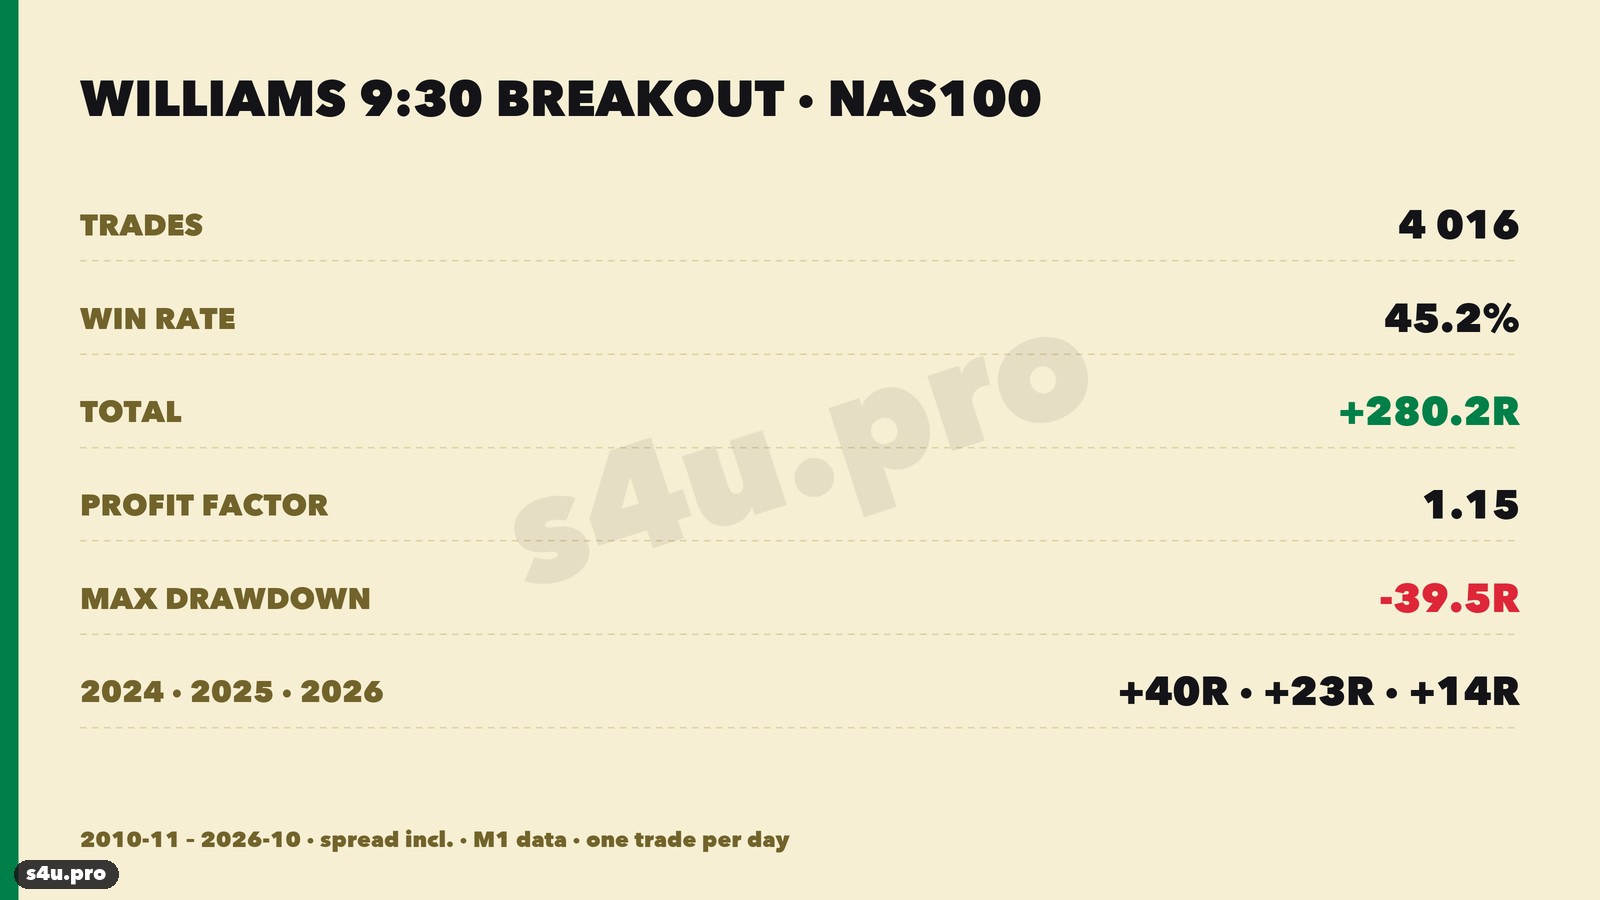
4,016 trades · 45% winners · +280.2R · +0.070R per trade · profit factor 1.15 · max drawdown −39.5R · up to 15 losses in a row · 15 of 17 years in profit · 2025–2026: 470 trades, +36.2R · with a 3× spread +109R.
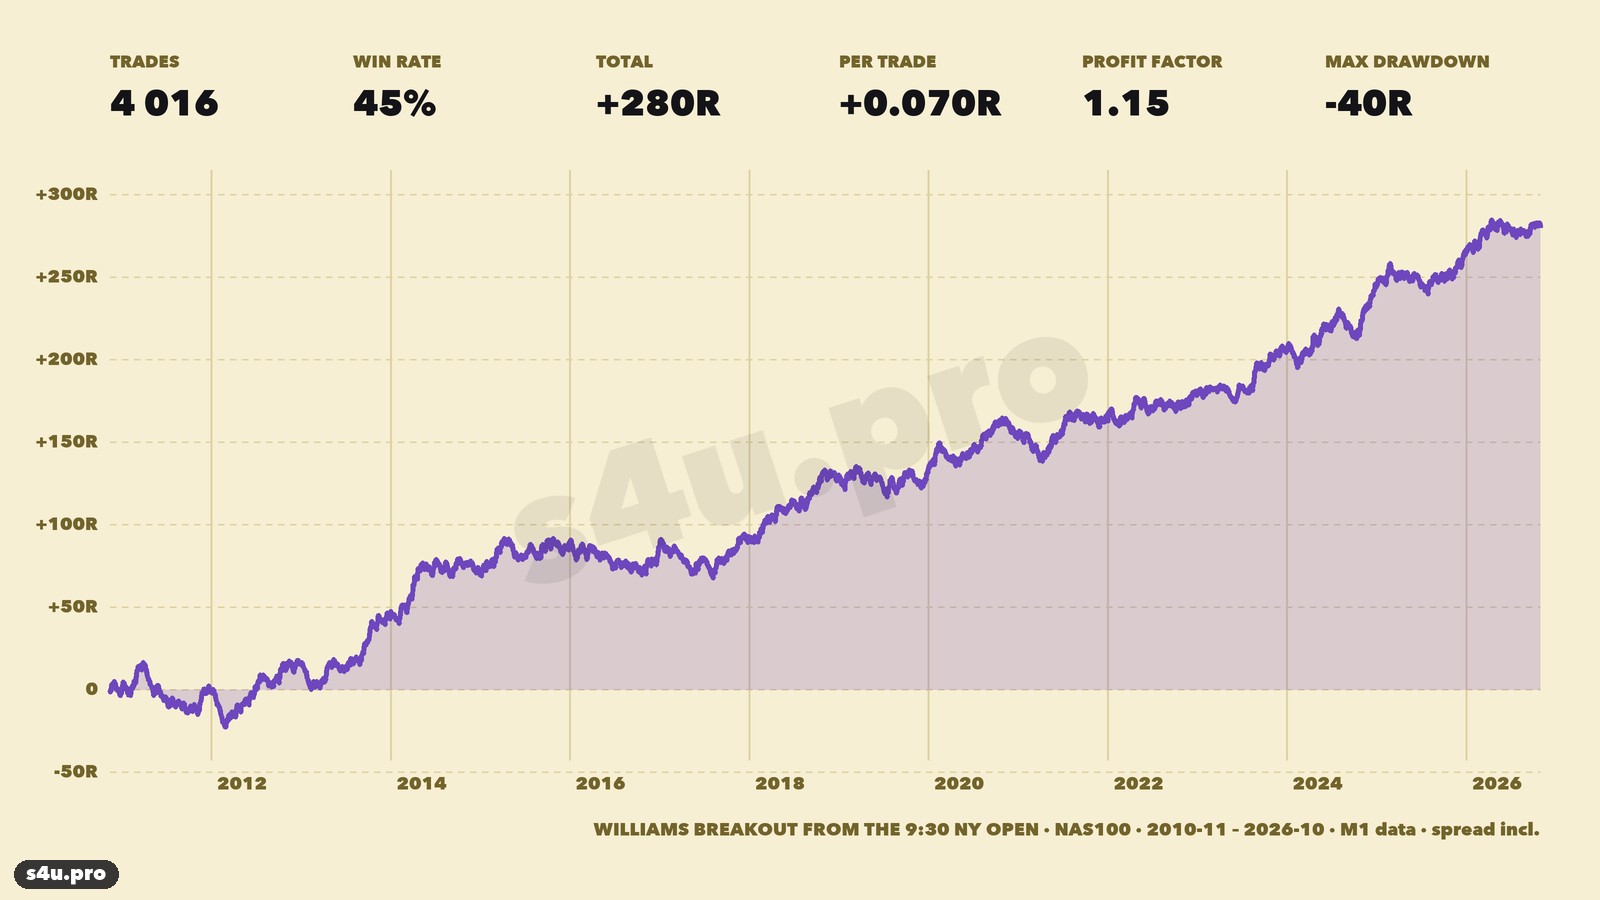
The curve grows steadily without long dips: the maximum drawdown is −39.5R, the longest losing streak is 15 trades. There are only two losing years, both close to zero: 2010 (only November and December in the test) −3R and 2016 −3R. The best years are 2024 (+40R), 2018 (+34R) and 2013 (+29R).
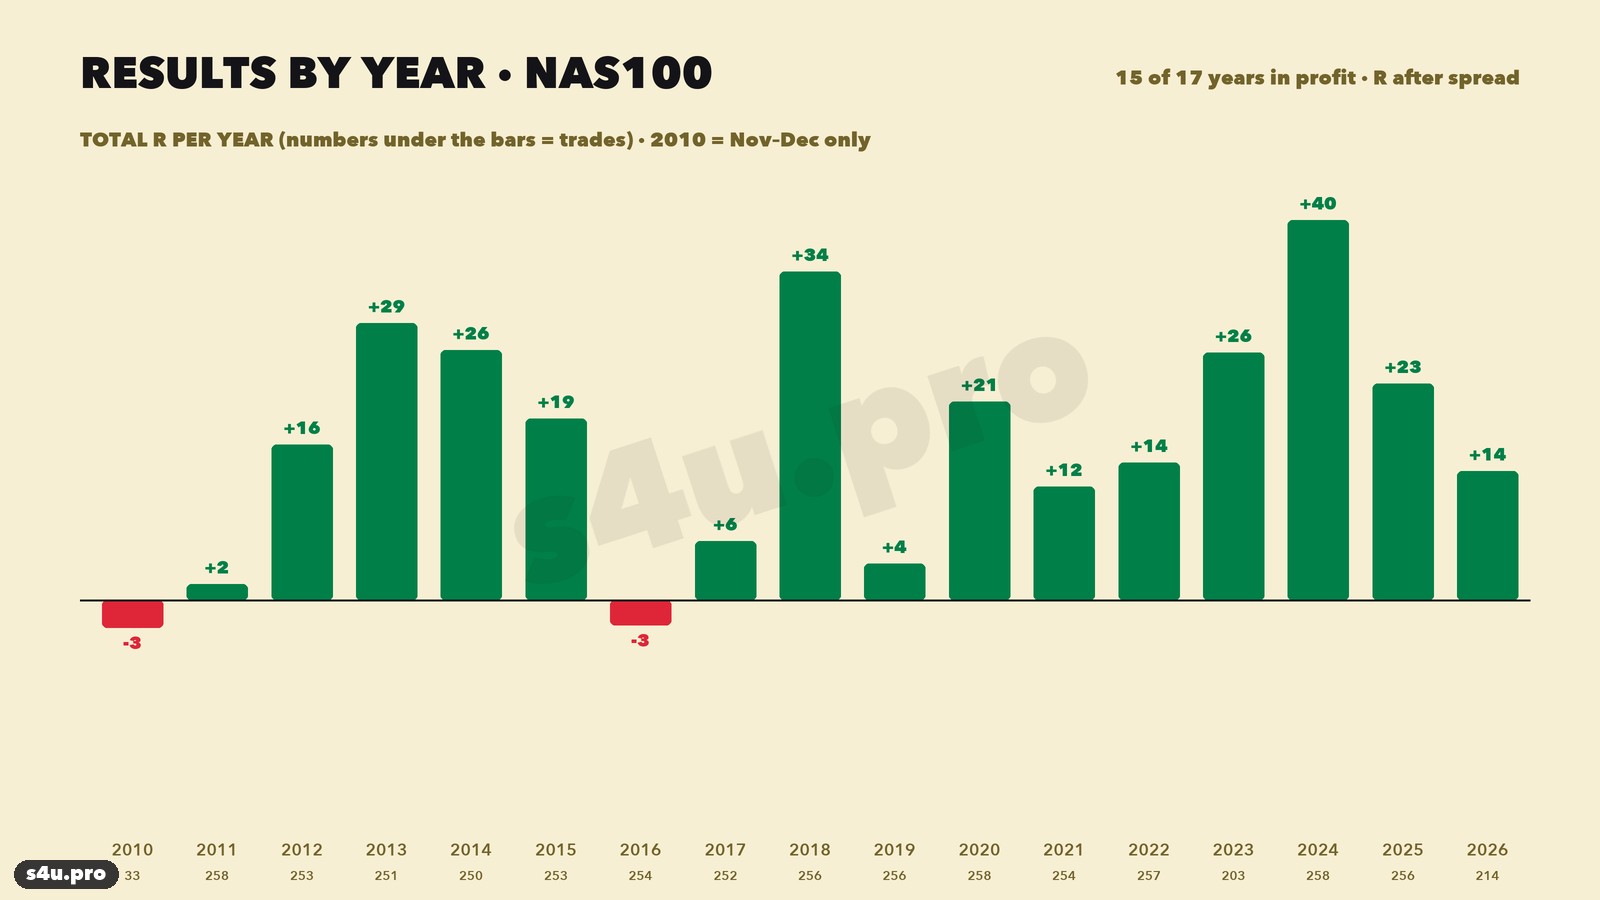
Recent years: 2023 +26R, 2024 +40R, 2025 +23R, 2026 (January–October) +14R.
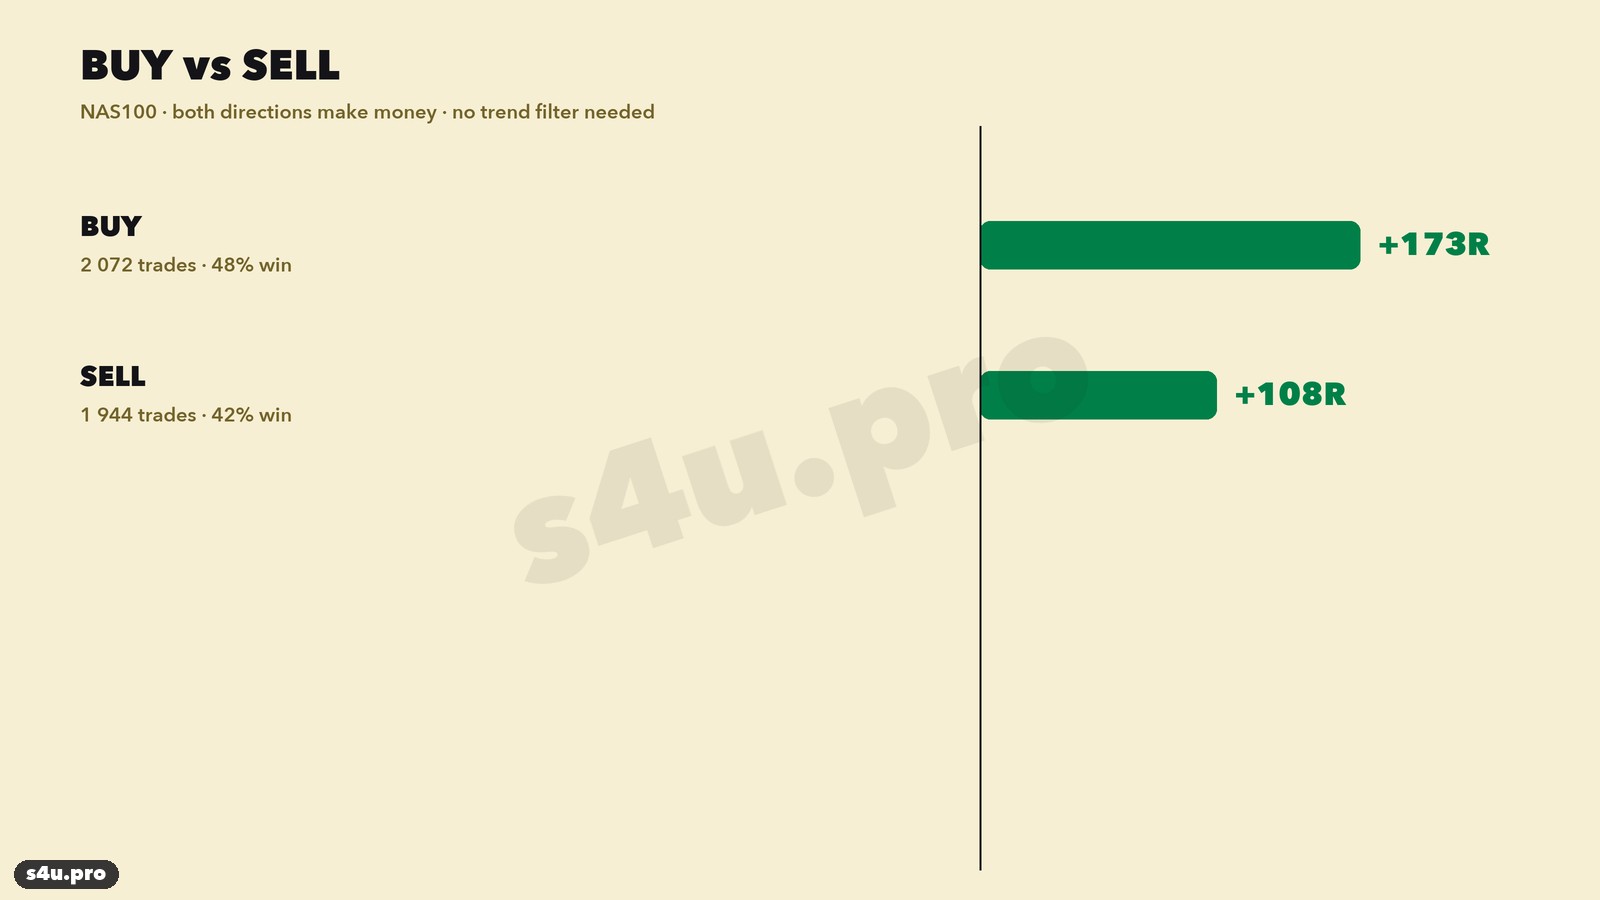
Buys made +173R on 2,072 trades (48% winners), sells +108R on 1,944 trades (42%). No trend filter is needed: the strategy simply follows the first move of the day, and that move goes both ways.
Of the 4,016 trades, 238 hit the target (+706R), 1,572 were stopped out (−1,611R) and 2,206 were closed by time at 16:00 (+1,186R, 72% of them in profit). The main source of profit is trades held all day: once the direction of the day is set, price usually goes further by the close.
What changes the result
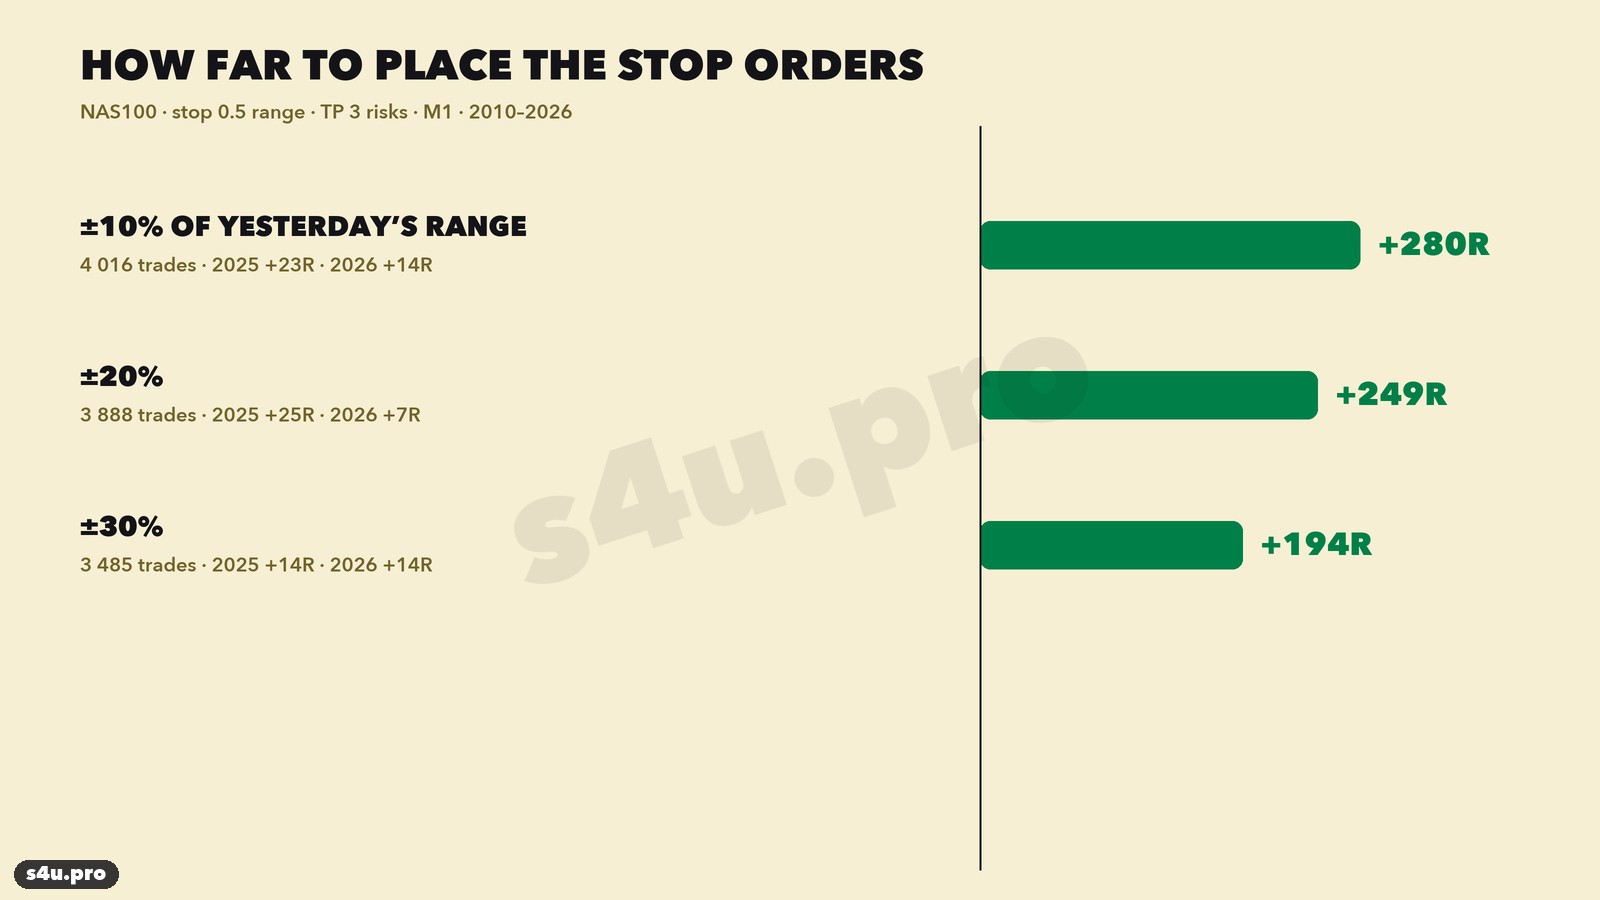
Order distance. 10% of yesterday’s range — +280R, 20% — +249R, 30% — +194R. The closer the orders are to the open, the earlier the entry and the more of the day’s move the trade catches. Every variant is profitable, in 2025 and in 2026 as well.
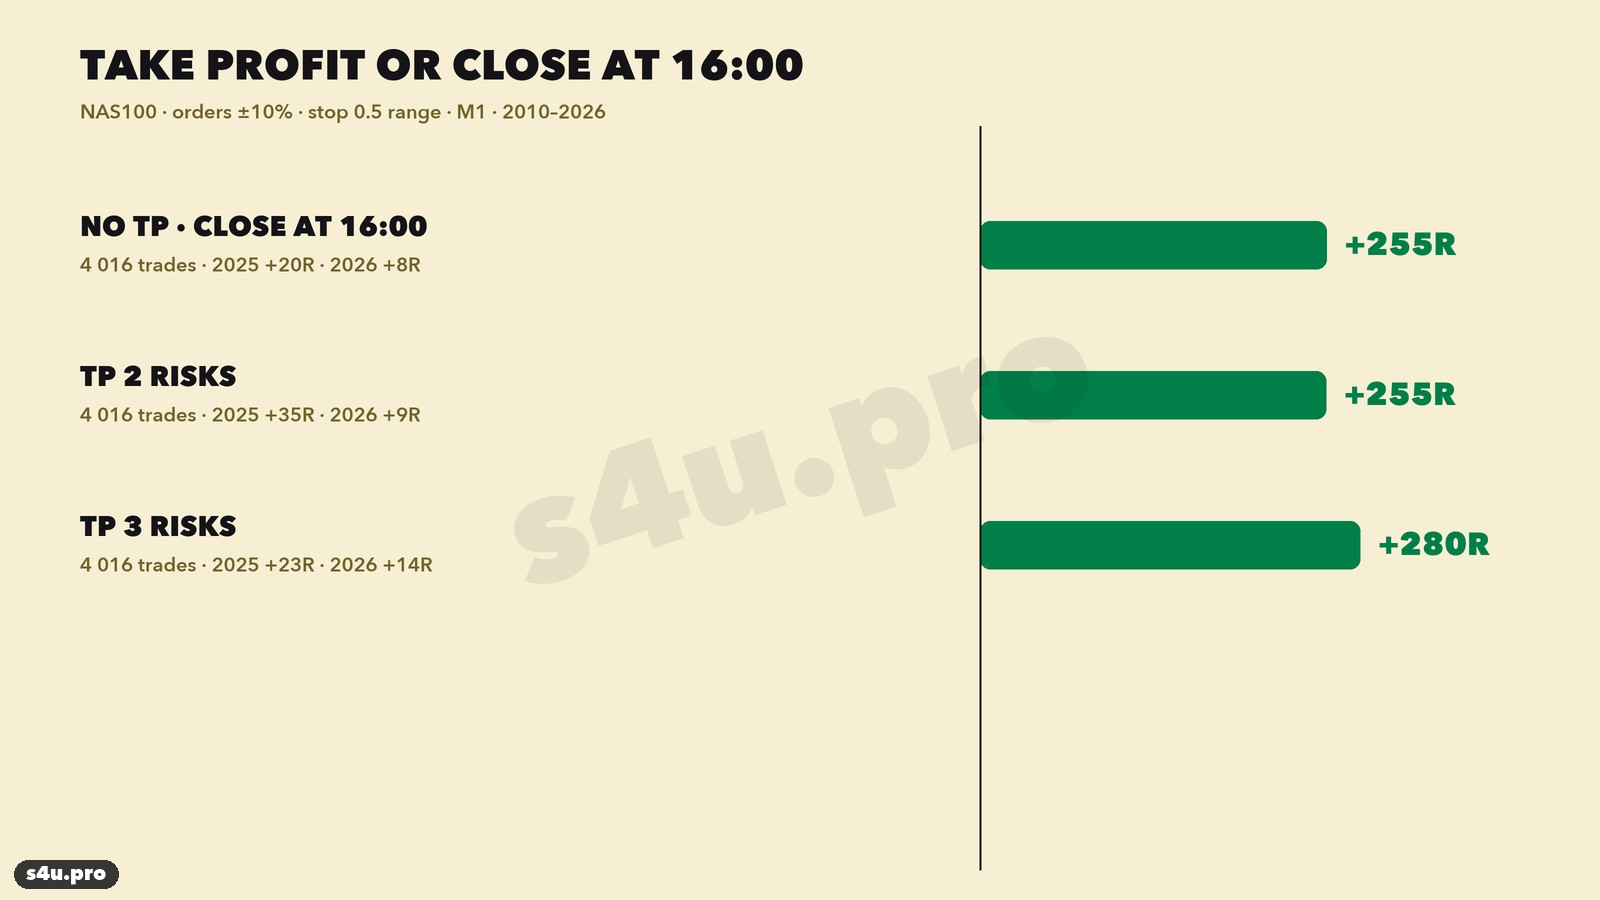
Target. No target, exit at 16:00 — +255R; a 2R target — +255R; a 3R target — +280R. The difference is small because the target is rarely reached (6% of trades) — the exit at the exchange close does most of the work.
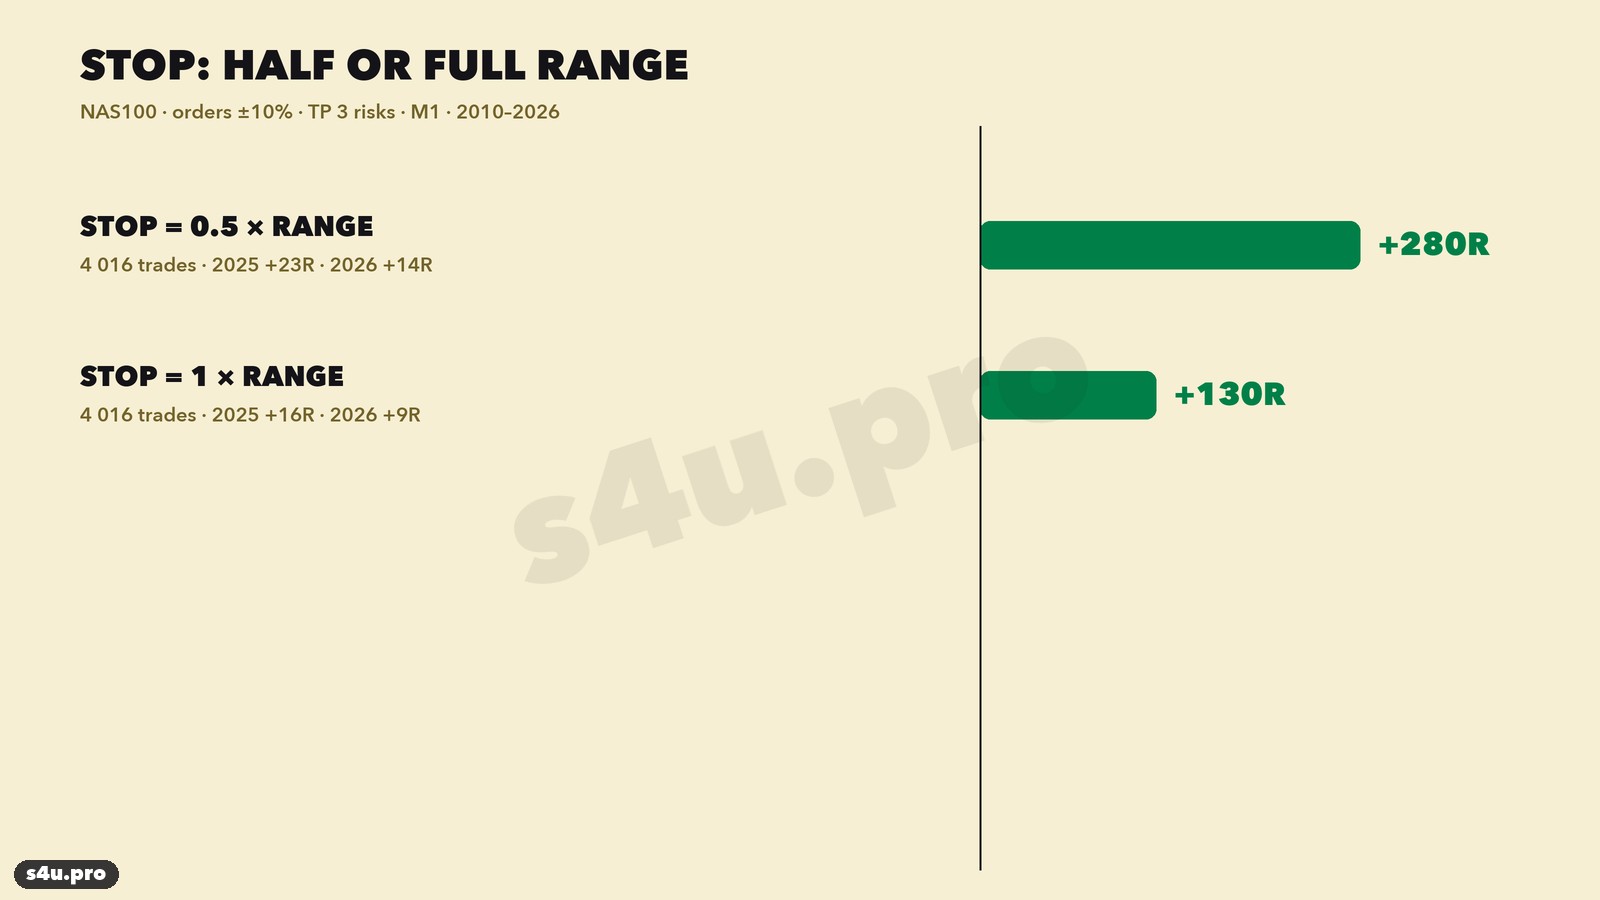
Stop. Half of the range — +280R, the full range — +130R. A wider stop is hit less often, but every trade becomes twice as “small” in R.
We checked 18 combinations: order distance 10/20/30%, a stop of 0.5 or 1 range, a 2R or 3R target or a 16:00 exit. All 18 are profitable (from +62R to +280R), and in every one of them 2025 and 2026 are in profit too. So the result does not hinge on one lucky setting.
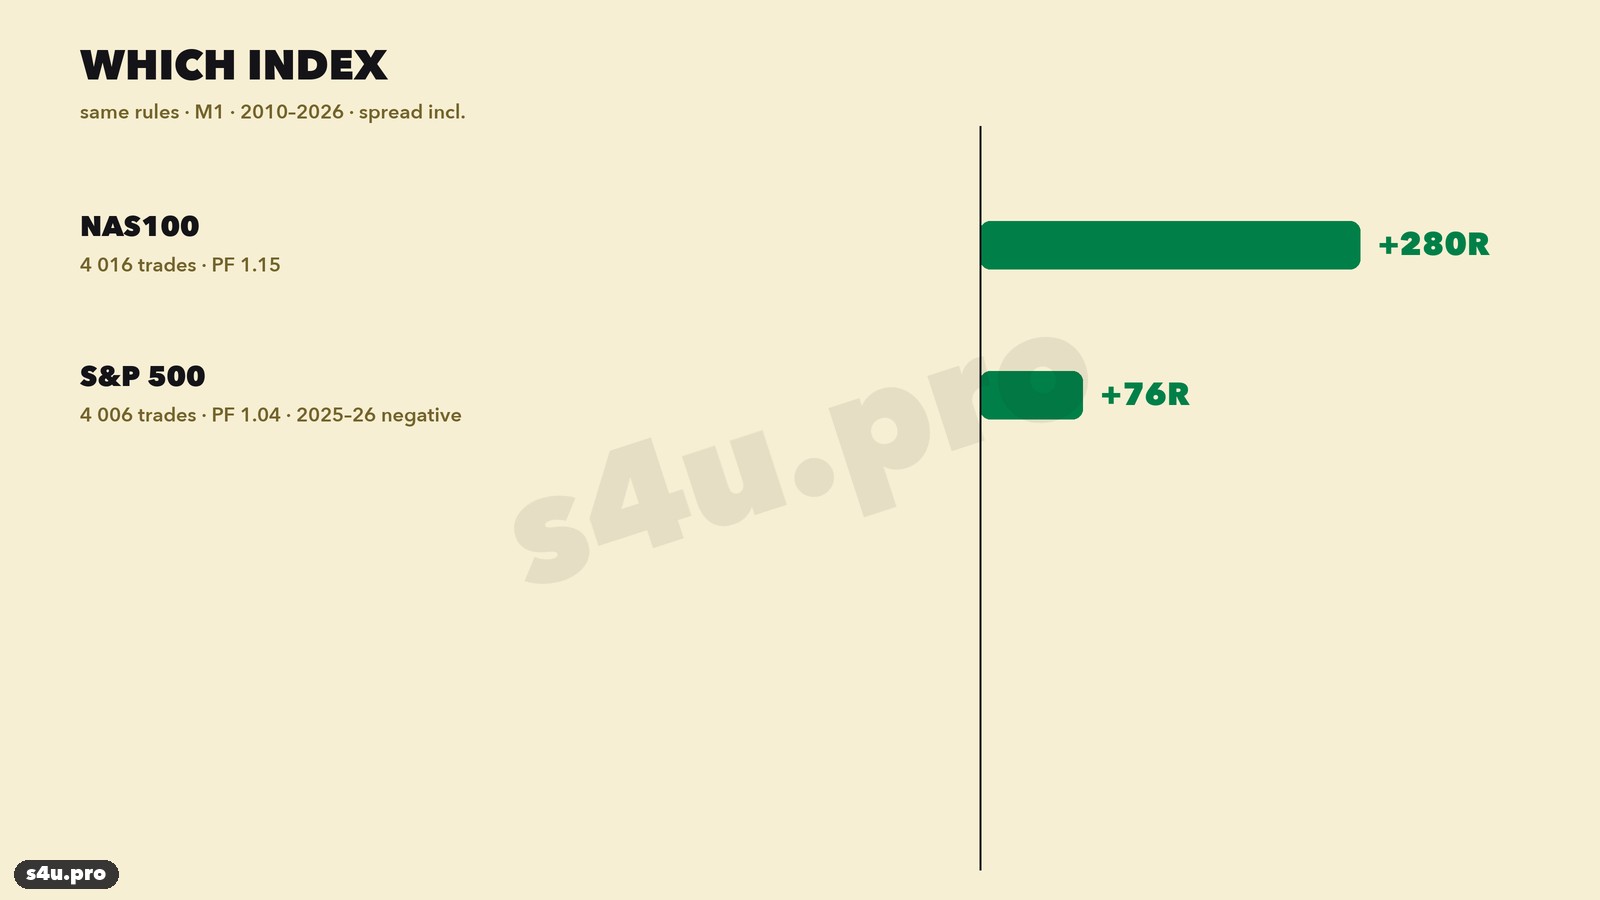
Market. On the S&P 500 the same rules give only +76R on 4,006 trades, and 2025 and 2026 are negative. The S&P 500 is calmer than the Nasdaq: morning moves are shorter and reverse more often. So the strategy is for NAS100.
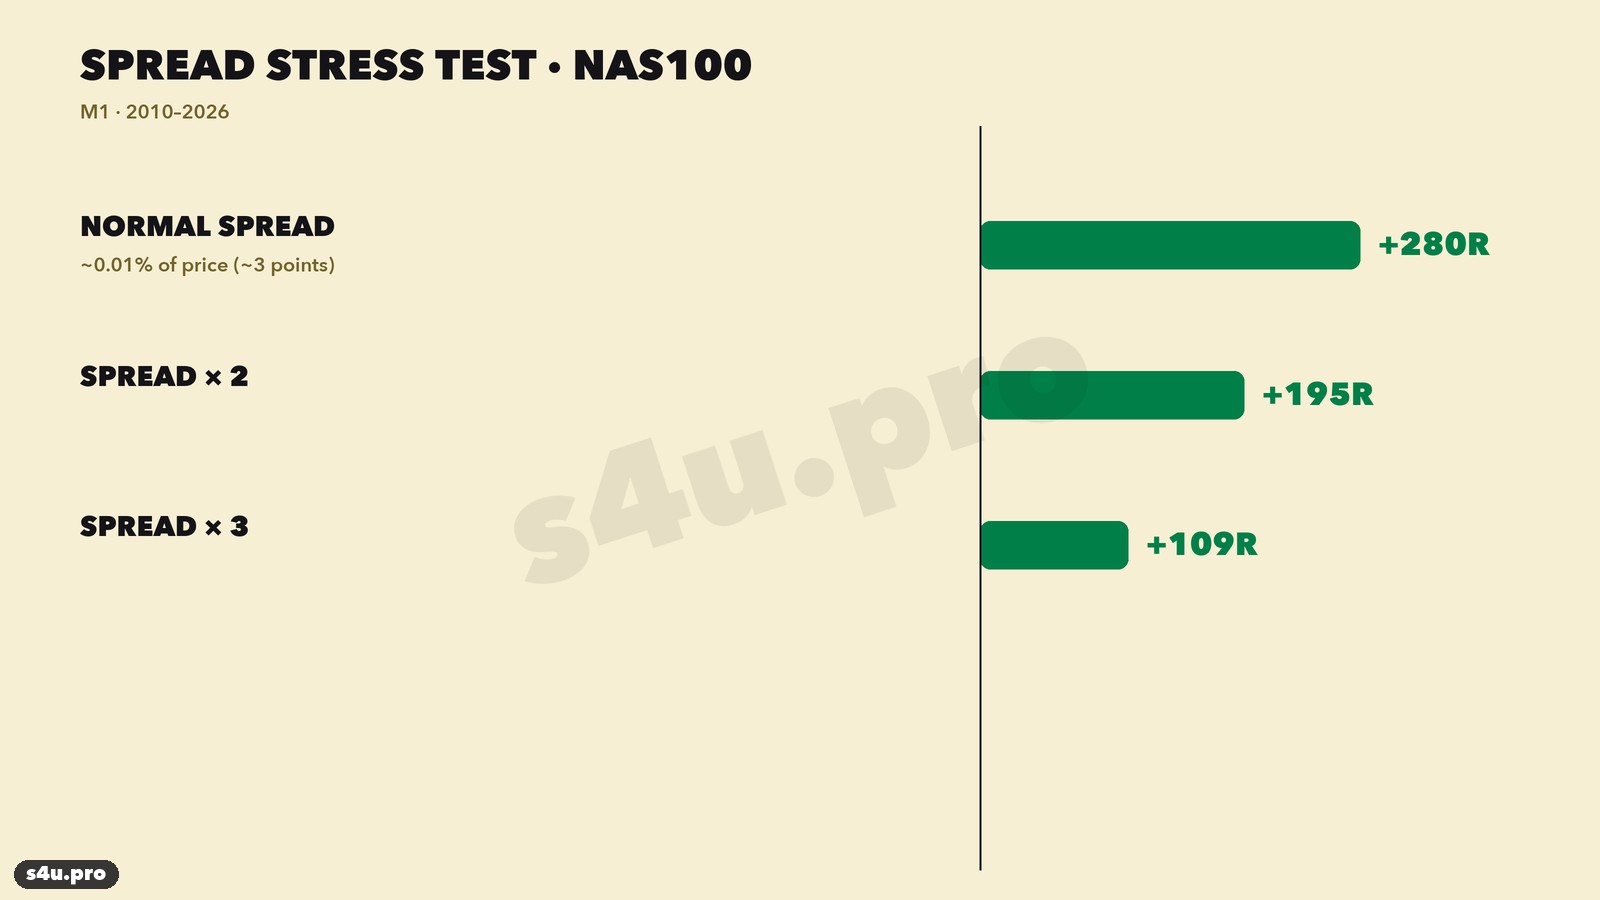
Spread. We used 0.01% of the price (about 3 points). With a 2× spread the result is +195R, with a 3× spread +109R, and the recent years stay positive. The stop is large (hundreds of points), so the spread and slippage on the stop order hardly matter.
Why it works
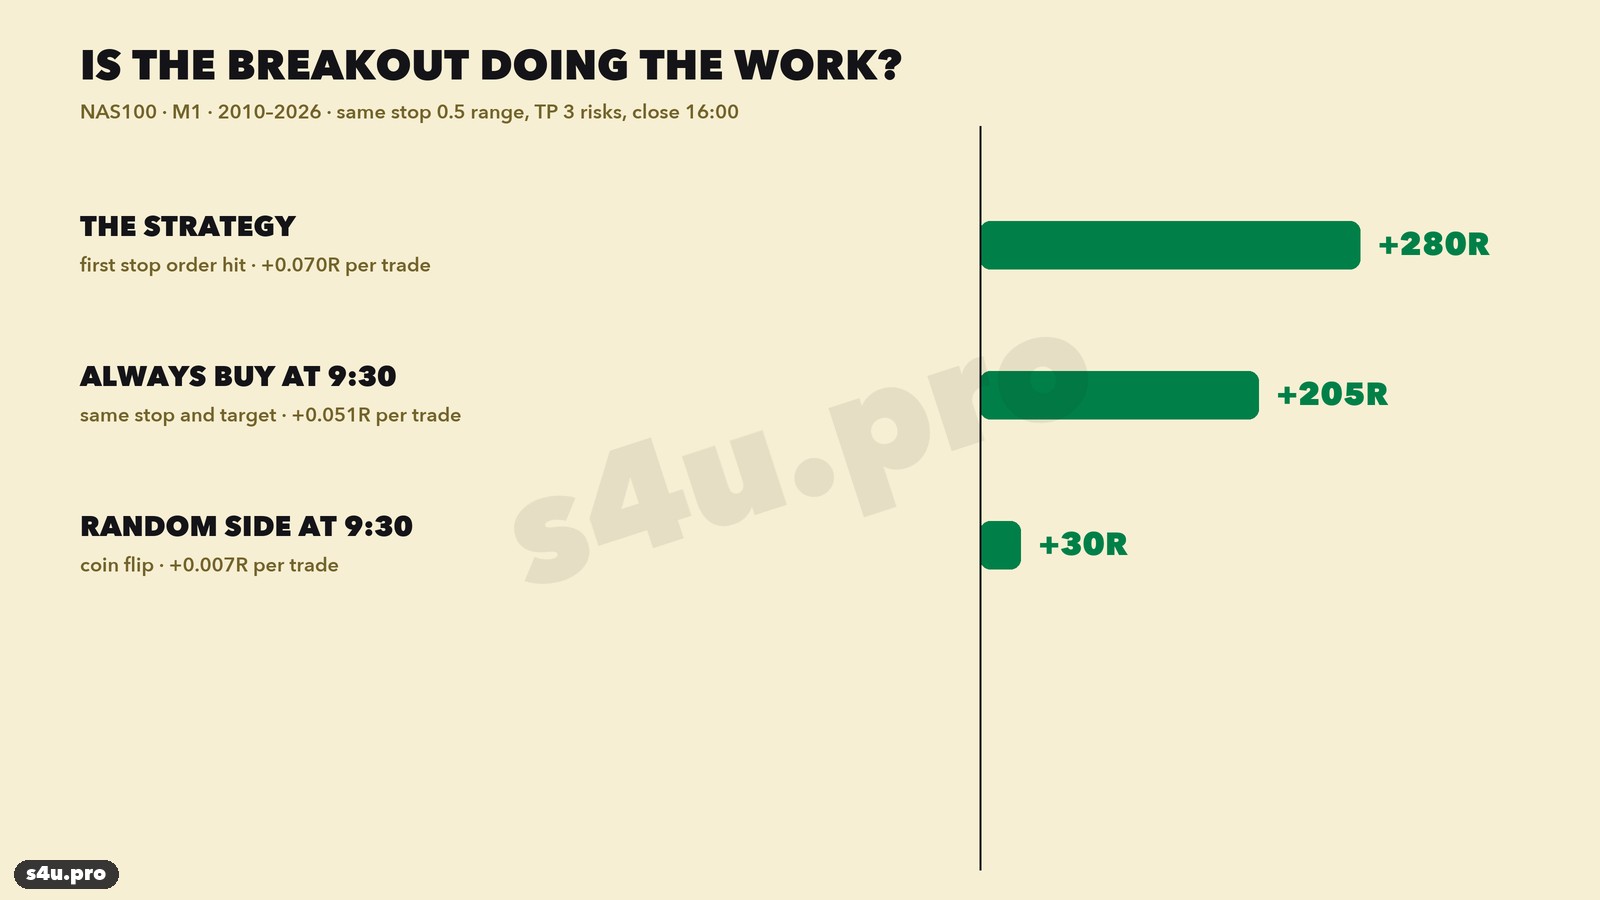
We checked separately that it is the breakout that works, not just the rise of the Nasdaq. On the same days, with the same stop and target:
- a random direction at 9:30 (“coin flip”) — +30R, i.e. +0.007R per trade — practically zero;
- always buying at 9:30 — +205R, +0.051R per trade: this is simply the index growth over 16 years;
- the Williams breakout — +280R, +0.070R per trade, and sells are profitable as well.
The logic: at 9:30 the exchange opens and in the first minutes all the orders collected overnight are executed. If buyers dominate, price quickly moves 10% of yesterday’s range up — and more often keeps rising into the evening, because large funds build their positions all day long. Yesterday’s range adapts the order distance and the stop to the current volatility: on quiet days they are closer, on wild days further away.
Williams and Silver Bullet: two strategies on one index
On NAS100 we have one more tested morning strategy — Silver Bullet (an FVG entry at 10:00–11:00 New York). The timing is similar, so we checked whether they duplicate each other.
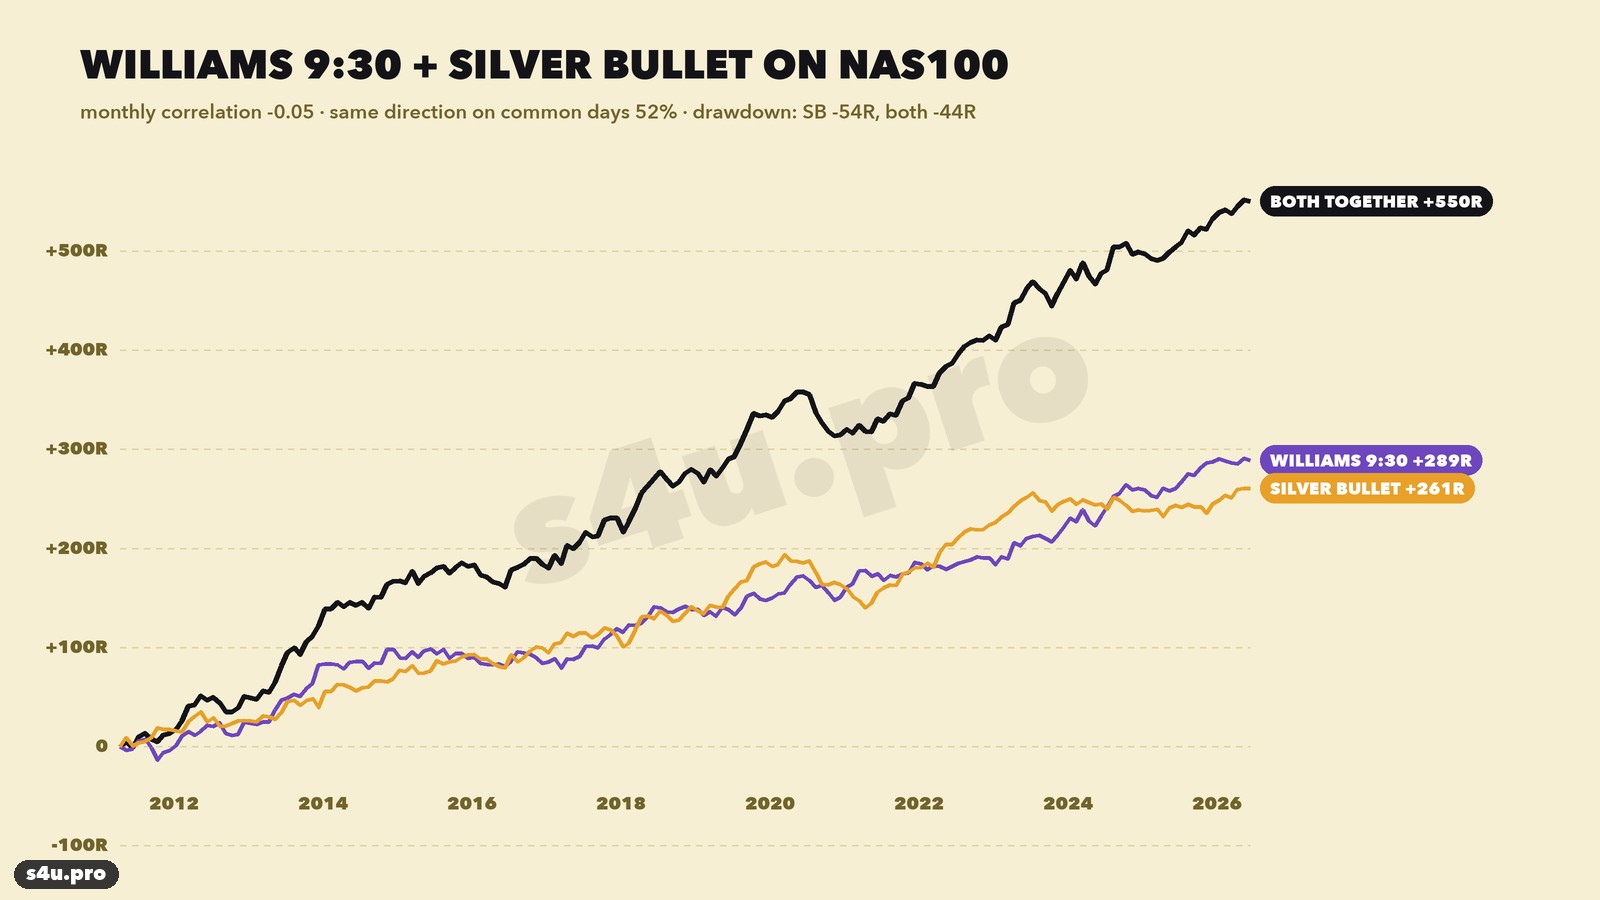
- On days when both strategies trade, the direction matches only 52% of the time — the same as random entries.
- The correlation of monthly results is −0.05, i.e. practically zero.
- Together on NAS100 they make about +550R, and the monthly drawdown of the pair (−45R) is smaller than that of Silver Bullet alone (−54R).
So these are two different strategies: Silver Bullet catches a pullback into the gap after an impulse, Williams follows the first move of the day. They can be traded together — each with its own risk.
Trade examples step by step
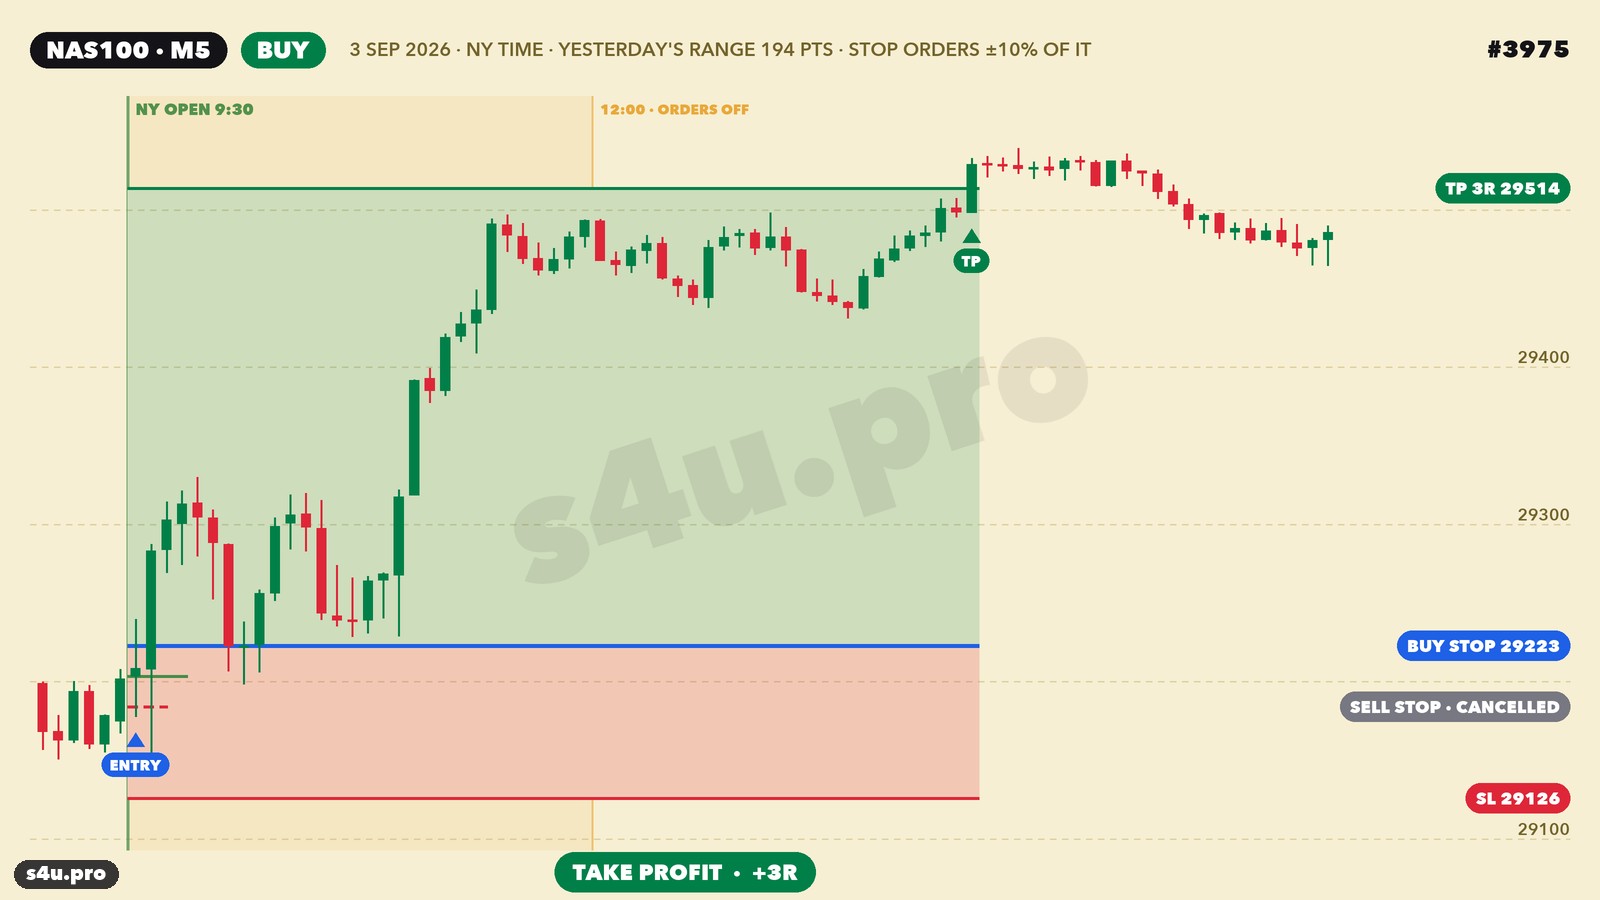
NAS100, 3 September 2026, buy. Yesterday’s 9:30–16:00 range was 194 points, 10% of it is 19 points. The 9:30 open is 29,204: buy stop 29,223, sell stop 29,184. Price went up right at 9:30, the buy stop was filled and the sell stop deleted. Stop 29,126 (97 points). At 14:01 price reached the 29,514 target: +3R.
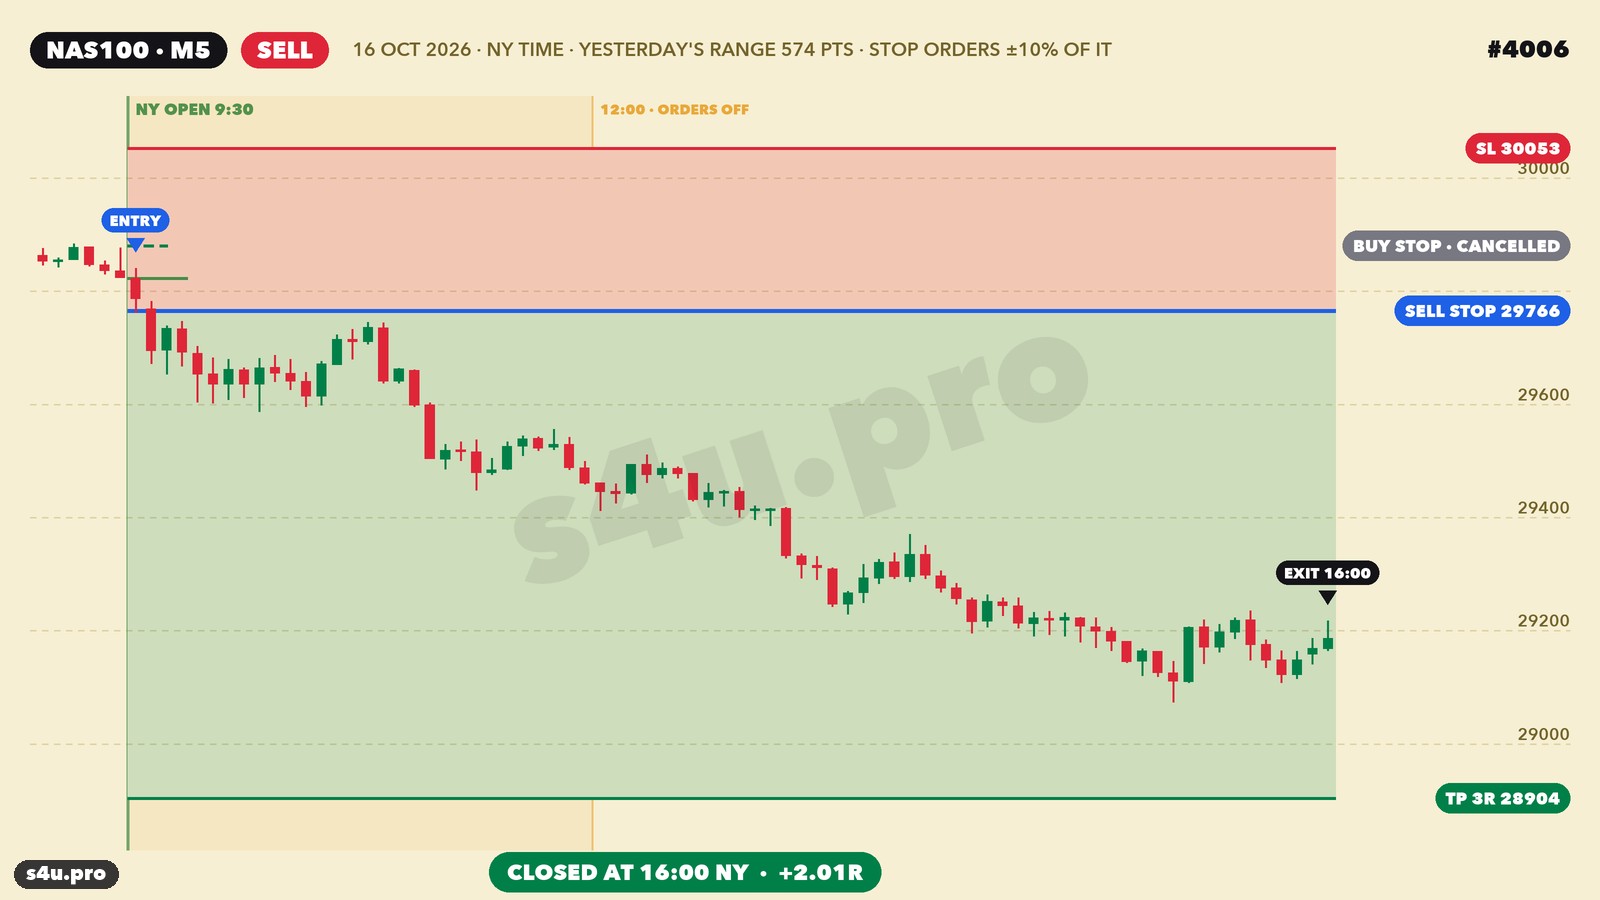
NAS100, 16 October 2026, sell. Yesterday’s range was large — 574 points, so the orders are 57 points from the 29,823 open. At 9:31 the sell stop at 29,766 was filled, stop 30,053 (287 points). Price fell all day but did not reach the target, and at 16:00 the trade was closed at 29,187: +576 points, +2.0R.
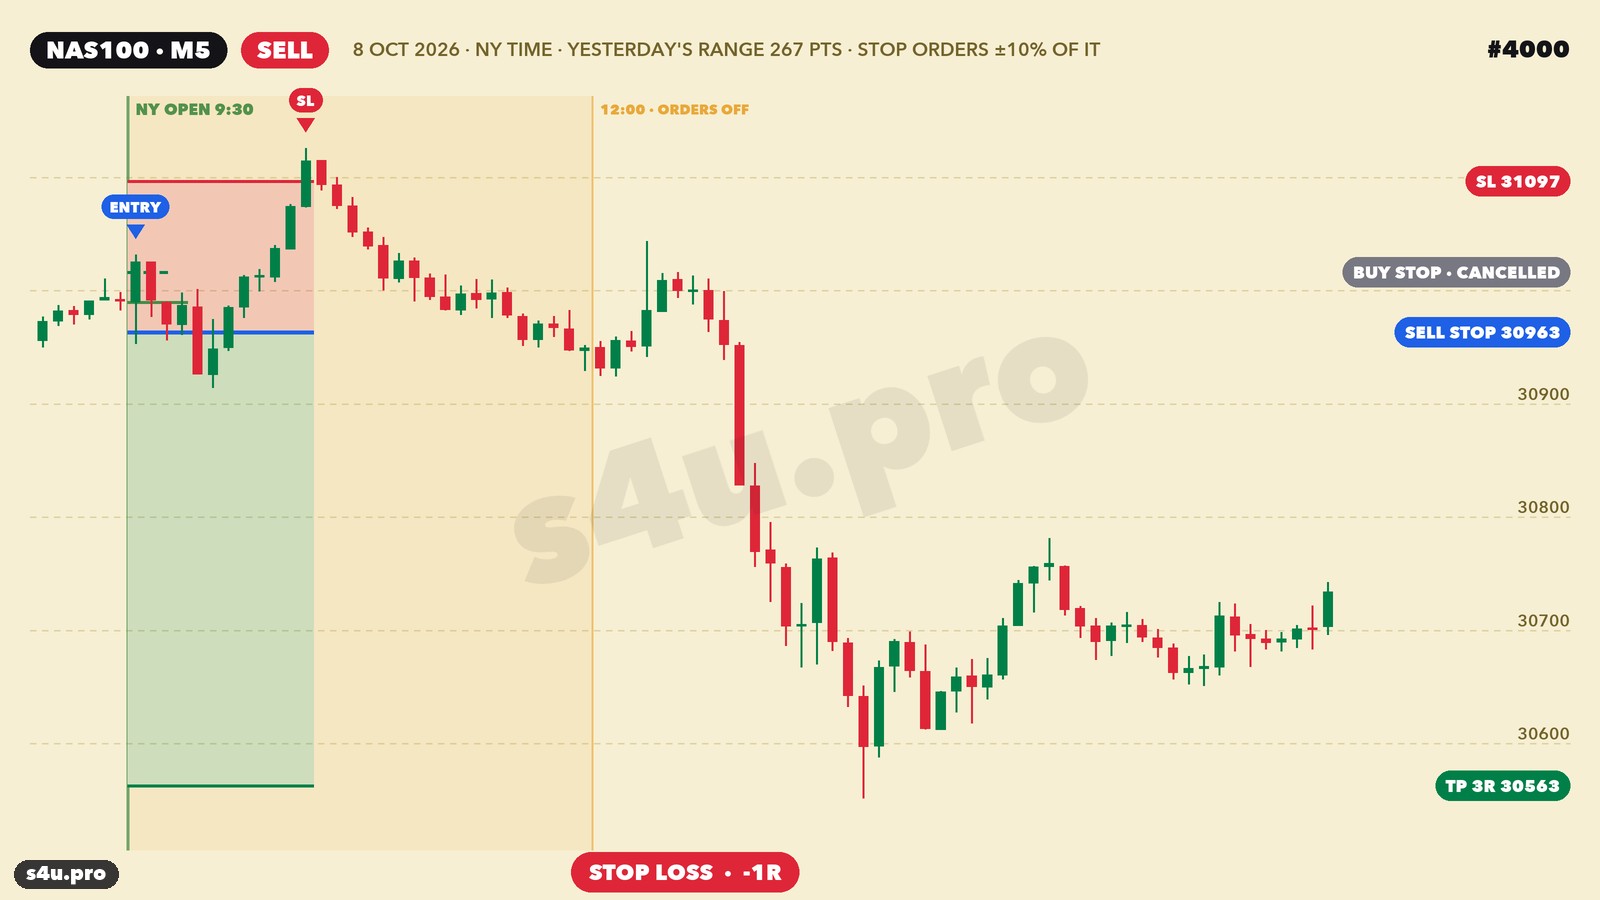
NAS100, 8 October 2026, sell — stopped out. The sell stop was filled at 30,963 in the very first minute, but an hour later price turned up and at 10:29 hit the 31,097 stop: −1R. 39% of trades end like this: the strategy makes money because winning days are on average bigger than losing ones.
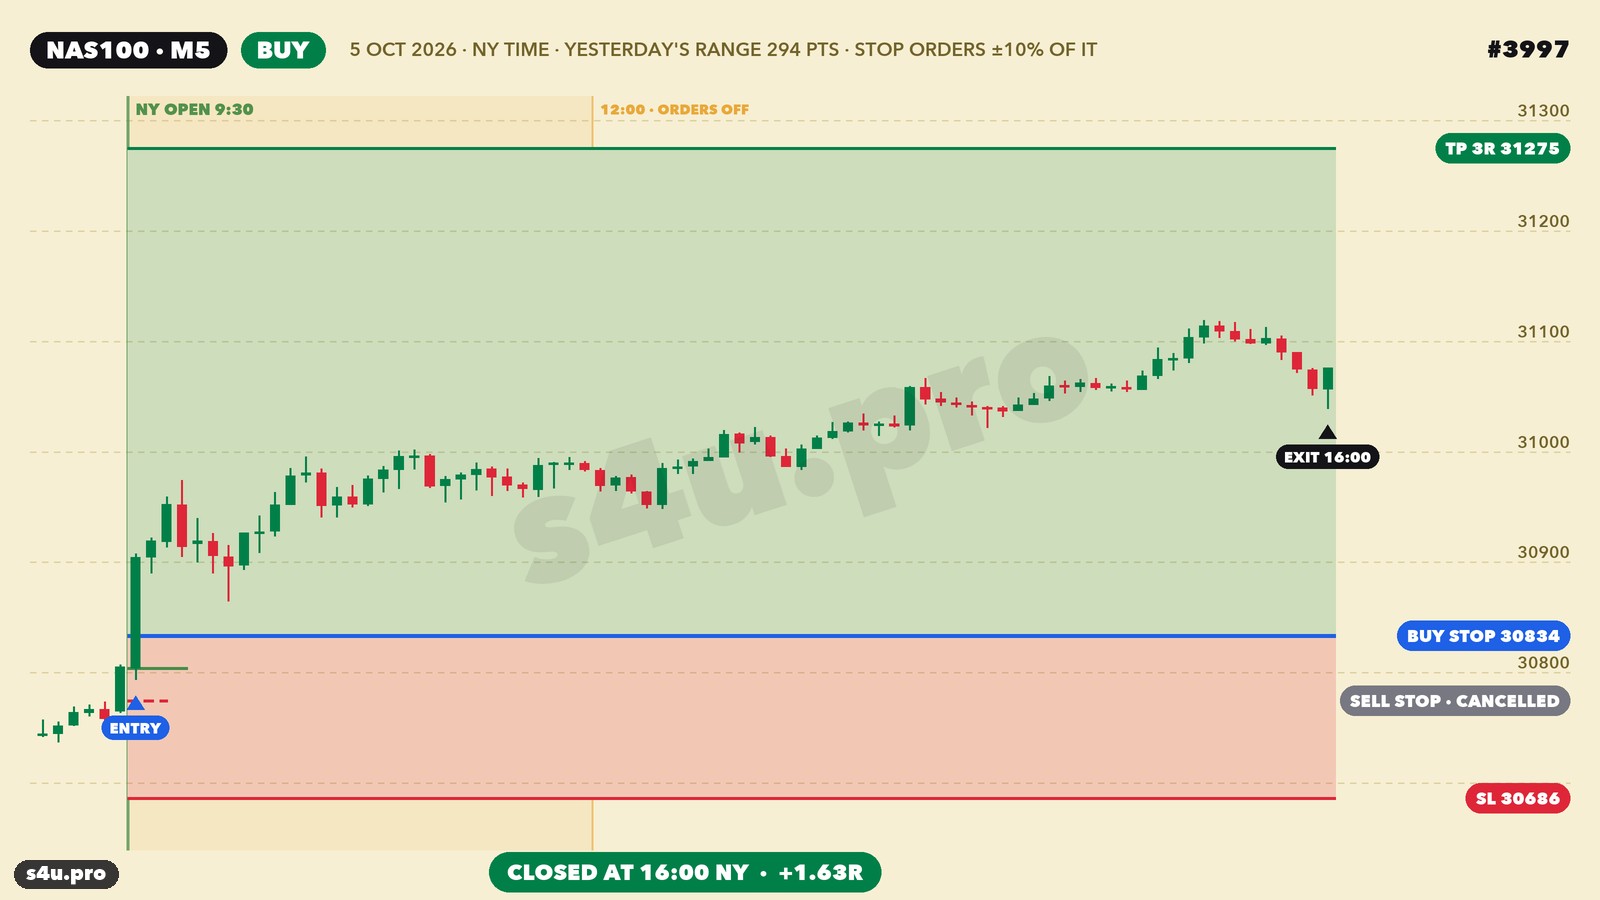
NAS100, 5 October 2026, buy. Range 294 points, the 30,834 buy stop was filled at 9:31, stop 30,686. Price rose all day but did not reach the 31,275 target. Exit at 16:00 at 31,076: +240 points, +1.6R.
Gallery: every trade of 2025–2026
All 470 trades of 2025–2026: 30 at the target, 183 stopped out, 257 closed by time, total +36.2R. Click a picture to open the chart.
| # | Market | Entry | Side | Entry price | Stop | Target | Exit | Result | Points | R | Chart |
|---|---|---|---|---|---|---|---|---|---|---|---|
| 4016 | NAS100 | 30.10.26 09:37 | BUY | 28590.06 | 28307.97 | 29436.31 | 28307.97 | SL | -284.9 | -1.01R | |
| 4015 | NAS100 | 29.10.26 09:33 | BUY | 29460.96 | 29264.05 | 30051.69 | 29264.05 | SL | -199.9 | -1.01R | |
| 4014 | NAS100 | 28.10.26 09:38 | SELL | 29659.26 | 29795.04 | 29251.93 | 29795.04 | SL | -138.7 | -1.02R | |
| 4013 | NAS100 | 27.10.26 09:31 | BUY | 29478.28 | 29341.97 | 29887.23 | 29635.65 | Time | +154.4 | +1.13R | |
| 4012 | NAS100 | 26.10.26 09:30 | SELL | 29153.55 | 29322.63 | 28646.32 | 29322.63 | SL | -172.0 | -1.02R | |
| 4011 | NAS100 | 23.10.26 09:32 | BUY | 28918.01 | 28641.33 | 29748.04 | 28958.81 | Time | +37.9 | +0.14R | |
| 4010 | NAS100 | 22.10.26 09:30 | SELL | 29297.52 | 29468.85 | 28783.52 | 28975.92 | Time | +318.7 | +1.86R | |
| 4009 | NAS100 | 21.10.26 09:37 | SELL | 29636.51 | 29892.00 | 28870.03 | 29892.00 | SL | -258.5 | -1.01R | |
| 4008 | NAS100 | 20.10.26 09:30 | SELL | 29368.50 | 29533.12 | 28874.63 | 29533.12 | SL | -167.6 | -1.02R | |
| 4007 | NAS100 | 19.10.26 09:57 | SELL | 29508.10 | 29891.24 | 28358.69 | 29528.55 | Time | -23.4 | -0.06R | |
| 4006 | NAS100 | 16.10.26 09:31 | SELL | 29765.72 | 30052.87 | 28904.27 | 29186.80 | Time | +575.9 | +2.01R | |
| 4005 | NAS100 | 15.10.26 09:30 | SELL | 29472.80 | 29762.84 | 28602.68 | 29762.84 | SL | -293.0 | -1.01R | |
| 4004 | NAS100 | 14.10.26 09:30 | BUY | 30353.49 | 30241.24 | 30690.24 | 30241.24 | SL | -115.3 | -1.03R | |
| 4003 | NAS100 | 13.10.26 09:30 | BUY | 30415.98 | 30314.12 | 30721.58 | 30567.92 | Time | +148.9 | +1.46R | |
| 4002 | NAS100 | 12.10.26 09:30 | SELL | 30800.00 | 30892.08 | 30523.77 | 30671.59 | Time | +125.3 | +1.36R | |
| 4001 | NAS100 | 09.10.26 09:36 | SELL | 30877.98 | 31164.98 | 30016.98 | 30876.56 | Time | -1.7 | -0.01R | |
| 4000 | NAS100 | 08.10.26 09:30 | SELL | 30963.23 | 31096.70 | 30562.79 | 31096.70 | SL | -136.6 | -1.02R | |
| 3999 | NAS100 | 07.10.26 09:30 | BUY | 30998.28 | 30920.13 | 31232.73 | 30920.13 | SL | -81.2 | -1.04R | |
| 3998 | NAS100 | 06.10.26 09:30 | BUY | 31295.91 | 31133.05 | 31784.50 | 31227.15 | Time | -71.9 | -0.44R | |
| 3997 | NAS100 | 05.10.26 09:31 | BUY | 30833.58 | 30686.35 | 31275.26 | 31076.31 | Time | +239.7 | +1.63R | |
| 3996 | NAS100 | 02.10.26 09:30 | SELL | 30856.81 | 31034.15 | 30324.79 | 30812.86 | Time | +40.9 | +0.23R | |
| 3995 | NAS100 | 01.10.26 09:30 | BUY | 30551.64 | 30439.52 | 30888.01 | 30439.52 | SL | -115.2 | -1.03R | |
| 3994 | NAS100 | 30.09.26 09:30 | BUY | 30448.98 | 30340.84 | 30773.42 | 30412.42 | Time | -39.6 | -0.37R | |
| 3993 | NAS100 | 29.09.26 09:30 | SELL | 30389.87 | 30590.05 | 29789.36 | 30333.92 | Time | +52.9 | +0.26R | |
| 3992 | NAS100 | 28.09.26 09:31 | SELL | 30414.60 | 30546.87 | 30017.78 | 30282.82 | Time | +128.7 | +0.97R | |
| 3991 | NAS100 | 25.09.26 09:30 | SELL | 30503.98 | 30672.00 | 29999.93 | 30672.00 | SL | -171.1 | -1.02R | |
| 3990 | NAS100 | 24.09.26 09:35 | BUY | 30261.71 | 30078.42 | 30811.60 | 30465.72 | Time | +201.0 | +1.10R | |
| 3989 | NAS100 | 23.09.26 09:30 | SELL | 30677.50 | 30830.17 | 30219.46 | 30478.32 | Time | +196.1 | +1.28R | |
| 3988 | NAS100 | 22.09.26 09:31 | BUY | 30524.13 | 30211.26 | 31462.74 | 30729.92 | Time | +202.7 | +0.65R | |
| 3987 | NAS100 | 21.09.26 09:30 | BUY | 29961.37 | 29822.34 | 30378.47 | 30378.47 | TP | +414.1 | +2.98R | |
| 3986 | NAS100 | 18.09.26 09:31 | BUY | 29534.97 | 29441.62 | 29815.00 | 29441.62 | SL | -96.3 | -1.03R | |
| 3985 | NAS100 | 17.09.26 09:32 | SELL | 29362.98 | 29610.89 | 28619.25 | 29425.90 | Time | -65.9 | -0.27R | |
| 3984 | NAS100 | 16.09.26 09:30 | BUY | 29107.23 | 28988.13 | 29464.51 | 28988.13 | SL | -122.0 | -1.02R | |
| 3983 | NAS100 | 15.09.26 09:31 | SELL | 29062.12 | 29275.42 | 28422.21 | 28943.74 | Time | +115.5 | +0.54R | |
| 3982 | NAS100 | 14.09.26 09:30 | BUY | 28900.68 | 28818.07 | 29148.49 | 29148.49 | TP | +244.9 | +2.96R | |
| 3981 | NAS100 | 11.09.26 09:30 | SELL | 29375.86 | 29484.81 | 29049.03 | 29364.83 | Time | +8.1 | +0.07R | |
| 3980 | NAS100 | 10.09.26 09:30 | BUY | 29090.20 | 28972.69 | 29442.71 | 29108.39 | Time | +15.3 | +0.13R | |
| 3979 | NAS100 | 09.09.26 09:30 | SELL | 29402.18 | 29532.56 | 29011.04 | 29532.56 | SL | -133.3 | -1.02R | |
| 3978 | NAS100 | 08.09.26 09:30 | BUY | 29619.67 | 29579.12 | 29741.33 | 29579.12 | SL | -43.5 | -1.07R | |
| 3977 | NAS100 | 07.09.26 09:32 | BUY | 29601.74 | 29490.41 | 29935.73 | 29571.25 | Time | -33.4 | -0.30R | |
| 3976 | NAS100 | 04.09.26 09:34 | BUY | 29587.64 | 29395.54 | 30163.96 | 29532.47 | Time | -58.1 | -0.30R | |
| 3975 | NAS100 | 03.09.26 09:30 | BUY | 29222.97 | 29126.03 | 29513.81 | 29513.81 | TP | +287.9 | +2.97R | |
| 3974 | NAS100 | 02.09.26 09:30 | SELL | 29020.46 | 29177.82 | 28548.36 | 29144.31 | Time | -126.8 | -0.81R | |
| 3973 | NAS100 | 01.09.26 09:30 | SELL | 29044.68 | 29136.76 | 28768.45 | 29136.76 | SL | -95.0 | -1.03R | |
| 3972 | NAS100 | 31.08.26 09:30 | BUY | 29422.36 | 29234.65 | 29985.50 | 29449.17 | Time | +23.9 | +0.13R | |
| 3971 | NAS100 | 28.08.26 09:30 | SELL | 29541.97 | 29681.55 | 29123.24 | 29681.55 | SL | -142.5 | -1.02R | |
| 3970 | NAS100 | 27.08.26 09:30 | BUY | 29485.30 | 29379.53 | 29802.61 | 29379.53 | SL | -108.7 | -1.03R | |
| 3969 | NAS100 | 26.08.26 09:30 | BUY | 29129.19 | 29004.19 | 29504.19 | 29233.99 | Time | +101.9 | +0.81R | |
| 3968 | NAS100 | 25.08.26 09:31 | BUY | 29248.96 | 29103.38 | 29685.69 | 29103.38 | SL | -148.5 | -1.02R | |
| 3967 | NAS100 | 24.08.26 09:30 | SELL | 29135.37 | 29270.00 | 28731.47 | 29020.88 | Time | +111.6 | +0.83R | |
| 3966 | NAS100 | 21.08.26 09:30 | SELL | 29361.44 | 29493.91 | 28964.02 | 29317.32 | Time | +41.2 | +0.31R | |
| 3965 | NAS100 | 20.08.26 09:30 | BUY | 29294.33 | 29111.60 | 29842.52 | 29209.03 | Time | -88.2 | -0.48R | |
| 3964 | NAS100 | 19.08.26 09:30 | SELL | 29582.96 | 29710.43 | 29200.54 | 29427.56 | Time | +152.4 | +1.20R | |
| 3963 | NAS100 | 18.08.26 09:30 | BUY | 29619.92 | 29510.14 | 29949.27 | 29510.14 | SL | -112.7 | -1.03R | |
| 3962 | NAS100 | 17.08.26 09:30 | BUY | 30151.10 | 30027.26 | 30522.60 | 30027.26 | SL | -126.8 | -1.02R | |
| 3961 | NAS100 | 14.08.26 09:35 | SELL | 30103.83 | 30306.83 | 29494.83 | 30047.04 | Time | +53.8 | +0.27R | |
| 3960 | NAS100 | 13.08.26 09:30 | SELL | 29789.52 | 29880.36 | 29517.02 | 29880.36 | SL | -93.8 | -1.03R | |
| 3959 | NAS100 | 12.08.26 09:31 | SELL | 29855.61 | 30007.18 | 29400.89 | 29749.43 | Time | +103.2 | +0.68R | |
| 3958 | NAS100 | 11.08.26 09:30 | SELL | 29710.10 | 29800.60 | 29438.60 | 29438.60 | TP | +268.5 | +2.97R | |
| 3957 | NAS100 | 10.08.26 09:30 | BUY | 29721.56 | 29575.31 | 30160.31 | 29629.85 | Time | -94.7 | -0.65R | |
| 3956 | NAS100 | 07.08.26 09:33 | BUY | 29662.14 | 29437.04 | 30337.46 | 29715.30 | Time | +50.2 | +0.22R | |
| 3955 | NAS100 | 06.08.26 09:32 | SELL | 29164.05 | 29402.90 | 28447.50 | 29402.90 | SL | -241.8 | -1.01R | |
| 3954 | NAS100 | 05.08.26 09:43 | BUY | 29923.49 | 29553.47 | 31033.54 | 29553.47 | SL | -373.0 | -1.01R | |
| 3953 | NAS100 | 04.08.26 09:30 | BUY | 29177.61 | 28859.82 | 30130.98 | 29736.13 | Time | +555.6 | +1.75R | |
| 3952 | NAS100 | 03.08.26 09:31 | SELL | 28233.34 | 28556.31 | 27264.44 | 28556.31 | SL | -325.8 | -1.01R | |
| 3951 | NAS100 | 31.07.26 09:32 | BUY | 28499.61 | 28256.47 | 29229.04 | 28256.47 | SL | -246.0 | -1.01R | |
| 3950 | NAS100 | 30.07.26 09:43 | BUY | 27811.07 | 27421.06 | 28981.07 | 28107.22 | Time | +293.4 | +0.75R | |
| 3949 | NAS100 | 29.07.26 09:30 | SELL | 27719.97 | 27955.77 | 27012.57 | 27200.16 | Time | +517.0 | +2.19R | |
| 3948 | NAS100 | 28.07.26 09:32 | SELL | 27720.53 | 28058.71 | 26705.96 | 27763.89 | Time | -46.1 | -0.14R | |
| 3947 | NAS100 | 27.07.26 09:32 | SELL | 28398.85 | 28607.55 | 27772.73 | 28039.29 | Time | +356.7 | +1.71R | |
| 3946 | NAS100 | 24.07.26 09:33 | BUY | 28429.82 | 28206.23 | 29100.57 | 28206.23 | SL | -226.4 | -1.01R | |
| 3945 | NAS100 | 23.07.26 09:30 | SELL | 28523.79 | 28651.44 | 28140.86 | 28651.44 | SL | -130.5 | -1.02R | |
| 3944 | NAS100 | 22.07.26 09:30 | BUY | 28947.97 | 28801.09 | 29388.62 | 28997.28 | Time | +46.4 | +0.32R | |
| 3943 | NAS100 | 21.07.26 09:31 | SELL | 29009.01 | 29219.00 | 28379.05 | 29137.10 | Time | -131.0 | -0.62R | |
| 3942 | NAS100 | 20.07.26 09:33 | BUY | 28931.82 | 28611.23 | 29893.60 | 28611.23 | SL | -323.5 | -1.01R | |
| 3941 | NAS100 | 17.07.26 09:30 | BUY | 28464.90 | 28239.29 | 29141.72 | 28239.29 | SL | -228.4 | -1.01R | |
| 3940 | NAS100 | 16.07.26 09:30 | BUY | 29327.00 | 29036.45 | 30198.65 | 29036.45 | SL | -293.5 | -1.01R | |
| 3939 | NAS100 | 15.07.26 09:31 | SELL | 29722.38 | 29885.42 | 29233.27 | 29233.27 | TP | +486.1 | +2.98R | |
| 3938 | NAS100 | 14.07.26 09:30 | SELL | 29570.94 | 29750.10 | 29033.46 | 29585.75 | Time | -17.8 | -0.10R | |
| 3937 | NAS100 | 13.07.26 09:30 | SELL | 29458.71 | 29655.74 | 28867.63 | 29260.74 | Time | +195.0 | +0.99R | |
| 3936 | NAS100 | 10.07.26 09:30 | BUY | 29661.95 | 29474.70 | 30223.70 | 29474.70 | SL | -190.2 | -1.02R | |
| 3935 | NAS100 | 09.07.26 09:30 | SELL | 29477.55 | 29713.73 | 28769.02 | 29713.73 | SL | -239.1 | -1.01R | |
| 3934 | NAS100 | 08.07.26 09:30 | BUY | 29019.25 | 28782.65 | 29729.03 | 29234.59 | Time | +212.4 | +0.90R | |
| 3933 | NAS100 | 07.07.26 09:30 | BUY | 29385.68 | 29233.10 | 29843.43 | 29233.10 | SL | -155.5 | -1.02R | |
| 3932 | NAS100 | 06.07.26 09:30 | BUY | 29598.09 | 29563.02 | 29703.29 | 29563.02 | SL | -38.0 | -1.08R | |
| 3931 | NAS100 | 02.07.26 09:30 | SELL | 29790.59 | 29943.06 | 29333.19 | 29943.06 | SL | -155.4 | -1.02R | |
| 3930 | NAS100 | 01.07.26 09:30 | SELL | 29904.28 | 30191.15 | 29043.67 | 29819.90 | Time | +81.4 | +0.28R | |
| 3929 | NAS100 | 30.06.26 09:31 | BUY | 29842.93 | 29442.50 | 31044.22 | 30247.97 | Time | +402.1 | +1.00R | |
| 3928 | NAS100 | 29.06.26 09:30 | SELL | 29303.75 | 29567.95 | 28511.18 | 29567.95 | SL | -267.1 | -1.01R | |
| 3927 | NAS100 | 26.06.26 09:33 | SELL | 28973.39 | 29425.07 | 27618.36 | 29085.85 | Time | -115.4 | -0.26R | |
| 3926 | NAS100 | 25.06.26 09:31 | SELL | 29788.78 | 30107.45 | 28832.75 | 29440.81 | Time | +345.0 | +1.08R | |
| 3925 | NAS100 | 24.06.26 09:30 | SELL | 29356.51 | 29592.95 | 28647.22 | 29592.95 | SL | -239.4 | -1.01R | |
| 3924 | NAS100 | 23.06.26 09:30 | SELL | 29361.08 | 29592.10 | 28668.01 | 29592.10 | SL | -234.0 | -1.01R | |
| 3923 | NAS100 | 22.06.26 09:30 | BUY | 30520.70 | 30485.32 | 30626.83 | 30485.32 | SL | -38.4 | -1.09R | |
| 3922 | NAS100 | 19.06.26 09:56 | BUY | 30374.27 | 30179.51 | 30958.57 | 30336.89 | Time | -40.4 | -0.21R | |
| 3921 | NAS100 | 18.06.26 09:34 | SELL | 30213.16 | 30519.14 | 29295.22 | 30383.45 | Time | -173.3 | -0.57R | |
| 3920 | NAS100 | 17.06.26 09:31 | SELL | 30133.40 | 30432.97 | 29234.68 | 29673.41 | Time | +457.0 | +1.52R | |
| 3919 | NAS100 | 16.06.26 09:30 | SELL | 30459.80 | 30610.98 | 30006.29 | 30006.29 | TP | +450.5 | +2.98R | |
| 3918 | NAS100 | 15.06.26 09:32 | BUY | 30357.04 | 30091.94 | 31152.34 | 30540.45 | Time | +180.4 | +0.68R | |
| 3917 | NAS100 | 12.06.26 09:30 | SELL | 29370.59 | 29851.36 | 27928.25 | 29625.14 | Time | -257.5 | -0.54R | |
| 3916 | NAS100 | 11.06.26 09:34 | SELL | 28643.98 | 29022.40 | 27508.71 | 29022.40 | SL | -381.3 | -1.01R | |
| 3915 | NAS100 | 10.06.26 09:38 | BUY | 28971.21 | 28187.38 | 31322.71 | 28490.55 | Time | -483.5 | -0.62R | |
| 3914 | NAS100 | 09.06.26 09:30 | SELL | 29657.73 | 29862.00 | 29044.94 | 29044.94 | TP | +609.8 | +2.98R | |
| 3913 | NAS100 | 08.06.26 09:35 | SELL | 29372.27 | 29930.00 | 27699.06 | 29408.69 | Time | -39.4 | -0.07R | |
| 3912 | NAS100 | 05.06.26 09:31 | BUY | 30024.64 | 29800.40 | 30697.39 | 29800.40 | SL | -227.2 | -1.01R | |
| 3911 | NAS100 | 04.06.26 09:30 | SELL | 30181.64 | 30336.94 | 29715.71 | 30336.94 | SL | -158.3 | -1.02R | |
| 3910 | NAS100 | 03.06.26 09:31 | BUY | 30738.03 | 30589.25 | 31184.36 | 30589.25 | SL | -151.8 | -1.02R | |
| 3909 | NAS100 | 02.06.26 09:30 | SELL | 30462.22 | 30663.67 | 29857.89 | 30663.67 | SL | -204.5 | -1.01R | |
| 3908 | NAS100 | 01.06.26 09:30 | SELL | 30256.45 | 30386.66 | 29865.81 | 30386.66 | SL | -133.2 | -1.02R | |
| 3907 | NAS100 | 29.05.26 09:32 | BUY | 30350.80 | 30143.59 | 30972.44 | 30328.84 | Time | -25.0 | -0.12R | |
| 3906 | NAS100 | 28.05.26 09:30 | BUY | 30014.56 | 29860.64 | 30476.35 | 29860.64 | SL | -156.9 | -1.02R | |
| 3905 | NAS100 | 27.05.26 09:30 | SELL | 30086.20 | 30230.98 | 29651.84 | 29971.31 | Time | +111.9 | +0.77R | |
| 3904 | NAS100 | 26.05.26 09:30 | BUY | 29838.35 | 29796.63 | 29963.51 | 29796.63 | SL | -44.7 | -1.07R | |
| 3903 | NAS100 | 25.05.26 09:37 | BUY | 29889.85 | 29762.85 | 30270.86 | 29879.66 | Time | -13.2 | -0.10R | |
| 3902 | NAS100 | 22.05.26 09:31 | BUY | 29545.29 | 29333.34 | 30181.17 | 29474.30 | Time | -73.9 | -0.35R | |
| 3901 | NAS100 | 21.05.26 09:31 | SELL | 29084.72 | 29279.62 | 28499.99 | 29279.62 | SL | -197.8 | -1.01R | |
| 3900 | NAS100 | 20.05.26 09:31 | BUY | 29026.61 | 28794.33 | 29723.47 | 29302.69 | Time | +273.2 | +1.18R | |
| 3899 | NAS100 | 19.05.26 09:30 | BUY | 28807.31 | 28536.02 | 29621.21 | 28826.23 | Time | +16.0 | +0.06R | |
| 3898 | NAS100 | 18.05.26 09:32 | SELL | 29203.62 | 29403.09 | 28605.19 | 28997.78 | Time | +202.9 | +1.02R | |
| 3897 | NAS100 | 15.05.26 09:30 | SELL | 29148.85 | 29311.21 | 28661.78 | 29311.21 | SL | -165.3 | -1.02R | |
| 3896 | NAS100 | 14.05.26 09:32 | BUY | 29417.94 | 29175.97 | 30143.83 | 29581.75 | Time | +160.9 | +0.67R | |
| 3895 | NAS100 | 13.05.26 09:31 | SELL | 29128.24 | 29405.40 | 28296.76 | 29405.40 | SL | -280.1 | -1.01R | |
| 3894 | NAS100 | 12.05.26 09:30 | SELL | 29081.43 | 29195.69 | 28738.63 | 28738.63 | TP | +339.9 | +2.98R | |
| 3893 | NAS100 | 11.05.26 09:31 | BUY | 29243.43 | 29005.59 | 29956.95 | 29317.18 | Time | +70.8 | +0.30R | |
| 3892 | NAS100 | 08.05.26 09:31 | BUY | 28804.64 | 28608.62 | 29392.72 | 29223.90 | Time | +416.4 | +2.12R | |
| 3891 | NAS100 | 07.05.26 09:45 | SELL | 28595.33 | 28789.01 | 28014.31 | 28789.01 | SL | -196.5 | -1.01R | |
| 3890 | NAS100 | 06.05.26 09:30 | SELL | 28249.12 | 28354.27 | 27933.70 | 28354.27 | SL | -108.0 | -1.03R | |
| 3889 | NAS100 | 05.05.26 09:30 | BUY | 27902.60 | 27747.28 | 28368.53 | 28013.76 | Time | +108.4 | +0.70R | |
| 3888 | NAS100 | 04.05.26 09:31 | SELL | 27704.64 | 27854.24 | 27255.86 | 27661.37 | Time | +40.5 | +0.27R | |
| 3887 | NAS100 | 01.05.26 09:31 | BUY | 27550.30 | 27323.63 | 28230.33 | 27713.89 | Time | +160.8 | +0.71R | |
| 3886 | NAS100 | 30.04.26 09:30 | SELL | 27340.18 | 27446.22 | 27022.08 | 27446.22 | SL | -108.8 | -1.03R | |
| 3885 | NAS100 | 29.04.26 09:30 | SELL | 27048.53 | 27168.53 | 26688.53 | 27168.53 | SL | -122.7 | -1.02R | |
| 3884 | NAS100 | 28.04.26 09:32 | BUY | 26983.57 | 26907.79 | 27210.91 | 26907.79 | SL | -78.5 | -1.04R | |
| 3883 | NAS100 | 27.04.26 09:30 | SELL | 27241.31 | 27403.99 | 26753.28 | 27307.19 | Time | -68.6 | -0.42R | |
| 3882 | NAS100 | 24.04.26 09:42 | BUY | 27115.38 | 26879.96 | 27821.62 | 27295.43 | Time | +177.3 | +0.75R | |
| 3881 | NAS100 | 23.04.26 09:30 | SELL | 26839.56 | 26978.51 | 26422.70 | 26978.51 | SL | -141.6 | -1.02R | |
| 3880 | NAS100 | 22.04.26 09:32 | SELL | 26696.62 | 26862.09 | 26200.23 | 26862.09 | SL | -168.1 | -1.02R | |
| 3879 | NAS100 | 21.04.26 09:30 | SELL | 26628.11 | 26756.38 | 26243.28 | 26488.54 | Time | +136.9 | +1.07R | |
| 3878 | NAS100 | 20.04.26 09:30 | BUY | 26663.06 | 26541.38 | 27028.10 | 26541.38 | SL | -124.3 | -1.02R | |
| 3877 | NAS100 | 17.04.26 09:32 | SELL | 26510.49 | 26653.15 | 26082.51 | 26653.15 | SL | -145.3 | -1.02R | |
| 3876 | NAS100 | 16.04.26 09:30 | SELL | 26239.44 | 26434.81 | 25653.32 | 26323.12 | Time | -86.3 | -0.44R | |
| 3875 | NAS100 | 15.04.26 09:40 | BUY | 25894.18 | 25723.68 | 26405.67 | 26199.00 | Time | +302.2 | +1.77R | |
| 3874 | NAS100 | 14.04.26 09:30 | BUY | 25534.15 | 25338.79 | 26120.20 | 25835.49 | Time | +298.8 | +1.53R | |
| 3873 | NAS100 | 13.04.26 09:30 | BUY | 25069.20 | 24983.97 | 25324.88 | 25324.88 | TP | +253.2 | +2.97R | |
| 3872 | NAS100 | 10.04.26 09:31 | BUY | 25180.75 | 25026.07 | 25644.80 | 25116.85 | Time | -66.4 | -0.43R | |
| 3871 | NAS100 | 09.04.26 09:32 | SELL | 24877.56 | 25034.69 | 24406.17 | 25034.69 | SL | -159.6 | -1.02R | |
| 3870 | NAS100 | 08.04.26 09:31 | SELL | 24984.84 | 25202.31 | 24332.43 | 24906.35 | Time | +76.0 | +0.35R | |
| 3869 | NAS100 | 07.04.26 09:30 | BUY | 24097.58 | 23977.23 | 24458.65 | 23977.23 | SL | -122.8 | -1.02R | |
| 3868 | NAS100 | 06.04.26 09:30 | BUY | 24145.90 | 23872.50 | 24966.09 | 24190.69 | Time | +42.4 | +0.15R | |
| 3867 | NAS100 | 02.04.26 09:30 | BUY | 23616.81 | 23468.00 | 24063.21 | 24045.90 | Time | +426.7 | +2.87R | |
| 3866 | NAS100 | 01.04.26 09:34 | BUY | 23967.97 | 23670.93 | 24859.08 | 24017.81 | Time | +47.4 | +0.16R | |
| 3865 | NAS100 | 31.03.26 09:31 | BUY | 23250.93 | 22993.41 | 24023.48 | 23731.05 | Time | +477.8 | +1.85R | |
| 3864 | NAS100 | 30.03.26 09:34 | SELL | 23293.92 | 23461.32 | 22791.72 | 22952.20 | Time | +339.4 | +2.03R | |
| 3863 | NAS100 | 27.03.26 09:50 | BUY | 23331.50 | 23103.83 | 24014.51 | 23103.83 | SL | -230.0 | -1.01R | |
| 3862 | NAS100 | 26.03.26 09:31 | BUY | 23987.23 | 23870.88 | 24336.28 | 23870.88 | SL | -118.7 | -1.02R | |
| 3861 | NAS100 | 25.03.26 09:35 | BUY | 24290.75 | 24179.68 | 24623.94 | 24179.68 | SL | -113.5 | -1.02R | |
| 3860 | NAS100 | 24.03.26 09:42 | BUY | 24031.25 | 23844.09 | 24592.72 | 24025.08 | Time | -8.6 | -0.05R | |
| 3859 | NAS100 | 23.03.26 09:45 | SELL | 24374.14 | 24566.80 | 23796.17 | 24193.88 | Time | +177.8 | +0.92R | |
| 3858 | NAS100 | 20.03.26 09:32 | BUY | 24087.68 | 23933.67 | 24549.74 | 23933.67 | SL | -156.4 | -1.02R | |
| 3857 | NAS100 | 19.03.26 09:31 | BUY | 24239.05 | 24083.28 | 24706.36 | 24388.88 | Time | +147.4 | +0.95R | |
| 3856 | NAS100 | 18.03.26 09:30 | BUY | 24609.94 | 24539.21 | 24822.10 | 24539.21 | SL | -73.2 | -1.03R | |
| 3855 | NAS100 | 17.03.26 09:31 | SELL | 24811.01 | 24908.52 | 24518.49 | 24795.30 | Time | +13.2 | +0.14R | |
| 3854 | NAS100 | 16.03.26 09:33 | SELL | 24663.28 | 24851.77 | 24097.79 | 24663.01 | Time | -2.2 | -0.01R | |
| 3853 | NAS100 | 13.03.26 09:30 | BUY | 24676.87 | 24580.19 | 24966.90 | 24580.19 | SL | -99.1 | -1.03R | |
| 3852 | NAS100 | 12.03.26 09:33 | SELL | 24577.31 | 24684.50 | 24255.76 | 24684.50 | SL | -109.6 | -1.02R | |
| 3851 | NAS100 | 11.03.26 09:32 | SELL | 24975.80 | 25113.50 | 24562.70 | 24939.74 | Time | +33.6 | +0.24R | |
| 3850 | NAS100 | 10.03.26 09:37 | BUY | 25041.04 | 24715.76 | 26016.89 | 25005.54 | Time | -38.0 | -0.12R | |
| 3849 | NAS100 | 09.03.26 09:30 | BUY | 24405.76 | 24248.14 | 24878.62 | 24878.62 | TP | +470.4 | +2.98R | |
| 3848 | NAS100 | 06.03.26 09:33 | BUY | 24698.36 | 24483.15 | 25343.99 | 24639.53 | Time | -61.3 | -0.28R | |
| 3847 | NAS100 | 05.03.26 09:30 | BUY | 24992.65 | 24798.26 | 25575.84 | 24798.26 | SL | -196.9 | -1.01R | |
| 3846 | NAS100 | 04.03.26 09:30 | BUY | 24867.28 | 24619.49 | 25610.64 | 25087.12 | Time | +217.4 | +0.88R | |
| 3845 | NAS100 | 03.03.26 09:30 | BUY | 24537.84 | 24293.10 | 25272.07 | 24718.84 | Time | +178.6 | +0.73R | |
| 3844 | NAS100 | 02.03.26 09:30 | BUY | 24632.48 | 24506.38 | 25010.79 | 25010.79 | TP | +375.8 | +2.98R | |
| 3843 | NAS100 | 27.02.26 09:30 | BUY | 24818.69 | 24580.76 | 25532.46 | 24953.84 | Time | +132.7 | +0.56R | |
| 3842 | NAS100 | 26.02.26 09:30 | SELL | 25270.43 | 25390.34 | 24910.69 | 24910.69 | TP | +357.2 | +2.98R | |
| 3841 | NAS100 | 25.02.26 09:30 | BUY | 25147.29 | 24958.31 | 25714.23 | 25334.05 | Time | +184.3 | +0.97R | |
| 3840 | NAS100 | 24.02.26 09:31 | SELL | 24717.83 | 24902.27 | 24164.52 | 24902.27 | SL | -186.9 | -1.01R | |
| 3839 | NAS100 | 23.02.26 09:30 | BUY | 24970.07 | 24740.65 | 25658.35 | 24740.65 | SL | -231.9 | -1.01R | |
| 3838 | NAS100 | 20.02.26 09:30 | BUY | 24676.74 | 24573.26 | 24987.20 | 24987.20 | TP | +308.0 | +2.98R | |
| 3837 | NAS100 | 19.02.26 09:31 | BUY | 24804.02 | 24617.80 | 25362.67 | 24796.50 | Time | -10.0 | -0.05R | |
| 3836 | NAS100 | 18.02.26 09:30 | SELL | 24701.70 | 24920.77 | 24044.49 | 24920.77 | SL | -221.5 | -1.01R | |
| 3835 | NAS100 | 17.02.26 09:30 | BUY | 24600.92 | 24537.91 | 24789.93 | 24537.91 | SL | -65.5 | -1.04R | |
| 3834 | NAS100 | 16.02.26 09:42 | SELL | 24652.67 | 24860.94 | 24027.88 | 24666.25 | Time | -16.0 | -0.08R | |
| 3833 | NAS100 | 13.02.26 09:39 | SELL | 24602.92 | 24937.44 | 23599.37 | 24733.72 | Time | -133.3 | -0.40R | |
| 3832 | NAS100 | 12.02.26 09:38 | BUY | 25306.76 | 25103.80 | 25915.64 | 25103.80 | SL | -205.5 | -1.01R | |
| 3831 | NAS100 | 11.02.26 09:30 | BUY | 25361.11 | 25237.54 | 25731.82 | 25237.54 | SL | -126.1 | -1.02R | |
| 3830 | NAS100 | 10.02.26 09:36 | SELL | 25243.31 | 25478.16 | 24538.79 | 25134.33 | Time | +106.5 | +0.45R | |
| 3829 | NAS100 | 09.02.26 09:30 | SELL | 24918.54 | 25179.69 | 24135.08 | 25179.69 | SL | -263.7 | -1.01R | |
| 3828 | NAS100 | 06.02.26 09:32 | BUY | 24709.57 | 24504.45 | 25324.94 | 25056.78 | Time | +344.7 | +1.68R | |
| 3827 | NAS100 | 05.02.26 09:30 | SELL | 24610.94 | 24911.67 | 23708.76 | 24540.24 | Time | +68.2 | +0.23R | |
| 3826 | NAS100 | 04.02.26 09:30 | SELL | 25205.64 | 25570.42 | 24111.30 | 24896.76 | Time | +306.4 | +0.84R | |
| 3825 | NAS100 | 03.02.26 09:31 | SELL | 25782.81 | 25984.92 | 25176.47 | 25176.47 | TP | +603.8 | +2.99R | |
| 3824 | NAS100 | 02.02.26 09:30 | BUY | 25465.46 | 25282.62 | 26013.98 | 25741.13 | Time | +273.1 | +1.49R | |
| 3823 | NAS100 | 30.01.26 09:30 | BUY | 25778.90 | 25460.87 | 26732.99 | 25460.87 | SL | -320.6 | -1.01R | |
| 3822 | NAS100 | 29.01.26 09:30 | BUY | 26024.46 | 25925.91 | 26320.08 | 25925.91 | SL | -101.1 | -1.03R | |
| 3821 | NAS100 | 28.01.26 09:30 | SELL | 26104.17 | 26200.89 | 25814.00 | 26018.60 | Time | +83.0 | +0.86R | |
| 3820 | NAS100 | 27.01.26 09:30 | SELL | 25831.71 | 25942.95 | 25497.98 | 25942.95 | SL | -113.8 | -1.02R | |
| 3819 | NAS100 | 26.01.26 09:30 | SELL | 25589.96 | 25730.64 | 25167.95 | 25730.64 | SL | -143.2 | -1.02R | |
| 3818 | NAS100 | 23.01.26 09:30 | BUY | 25491.19 | 25395.12 | 25779.39 | 25601.12 | Time | +107.4 | +1.12R | |
| 3817 | NAS100 | 22.01.26 09:30 | SELL | 25535.37 | 25794.10 | 24759.18 | 25519.58 | Time | +13.2 | +0.05R | |
| 3816 | NAS100 | 21.01.26 09:31 | SELL | 25020.15 | 25185.25 | 24524.84 | 25185.25 | SL | -167.6 | -1.01R | |
| 3815 | NAS100 | 20.01.26 09:30 | BUY | 25110.19 | 25020.10 | 25380.49 | 25020.10 | SL | -92.6 | -1.03R | |
| 3814 | NAS100 | 19.01.26 09:33 | SELL | 25105.93 | 25255.21 | 24658.08 | 25255.21 | SL | -151.8 | -1.02R | |
| 3813 | NAS100 | 16.01.26 09:33 | SELL | 25686.56 | 25823.96 | 25274.38 | 25527.80 | Time | +156.2 | +1.14R | |
| 3812 | NAS100 | 15.01.26 09:34 | SELL | 25726.42 | 25908.33 | 25180.72 | 25552.79 | Time | +171.1 | +0.94R | |
| 3811 | NAS100 | 14.01.26 09:30 | SELL | 25553.09 | 25671.44 | 25198.03 | 25472.43 | Time | +78.1 | +0.66R | |
| 3810 | NAS100 | 13.01.26 09:34 | BUY | 25811.86 | 25674.42 | 26224.16 | 25674.42 | SL | -140.0 | -1.02R | |
| 3809 | NAS100 | 12.01.26 09:30 | BUY | 25614.77 | 25430.18 | 26168.52 | 25782.93 | Time | +165.6 | +0.90R | |
| 3808 | NAS100 | 09.01.26 09:30 | SELL | 25518.50 | 25633.65 | 25173.06 | 25633.65 | SL | -117.7 | -1.02R | |
| 3807 | NAS100 | 08.01.26 09:30 | SELL | 25586.11 | 25698.08 | 25250.20 | 25504.23 | Time | +79.3 | +0.71R | |
| 3806 | NAS100 | 07.01.26 09:33 | BUY | 25630.19 | 25517.67 | 25967.73 | 25653.56 | Time | +20.8 | +0.18R | |
| 3805 | NAS100 | 06.01.26 09:30 | BUY | 25466.60 | 25385.08 | 25711.17 | 25628.21 | Time | +159.1 | +1.95R | |
| 3804 | NAS100 | 05.01.26 09:32 | SELL | 25408.82 | 25669.33 | 24627.29 | 25401.80 | Time | +4.5 | +0.02R | |
| 3803 | NAS100 | 02.01.26 09:30 | BUY | 25509.45 | 25387.37 | 25875.67 | 25387.37 | SL | -124.6 | -1.02R | |
| 3802 | NAS100 | 31.12.25 09:30 | SELL | 25458.00 | 25519.52 | 25273.43 | 25273.43 | TP | +182.0 | +2.96R | |
| 3801 | NAS100 | 30.12.25 09:30 | BUY | 25496.32 | 25413.76 | 25743.97 | 25465.53 | Time | -33.3 | -0.40R | |
| 3800 | NAS100 | 29.12.25 09:30 | SELL | 25481.57 | 25531.60 | 25331.47 | 25531.60 | SL | -52.6 | -1.05R | |
| 3799 | NAS100 | 26.12.25 09:30 | SELL | 25669.04 | 25722.38 | 25509.00 | 25647.18 | Time | +19.3 | +0.36R | |
| 3798 | NAS100 | 24.12.25 09:30 | BUY | 25588.64 | 25493.94 | 25872.75 | 25642.84 | Time | +51.6 | +0.55R | |
| 3797 | NAS100 | 23.12.25 09:30 | BUY | 25429.27 | 25347.26 | 25675.30 | 25578.06 | Time | +146.3 | +1.78R | |
| 3796 | NAS100 | 22.12.25 09:30 | SELL | 25519.65 | 25637.72 | 25165.42 | 25453.08 | Time | +64.0 | +0.54R | |
| 3795 | NAS100 | 19.12.25 09:30 | BUY | 25156.79 | 25037.65 | 25514.21 | 25342.15 | Time | +182.9 | +1.53R | |
| 3794 | NAS100 | 18.12.25 09:38 | SELL | 24987.09 | 25260.52 | 24166.83 | 25008.89 | Time | -24.3 | -0.09R | |
| 3793 | NAS100 | 17.12.25 09:35 | SELL | 25143.85 | 25284.62 | 24721.54 | 24721.54 | TP | +419.8 | +2.98R | |
| 3792 | NAS100 | 16.12.25 09:30 | BUY | 25003.22 | 24813.85 | 25571.36 | 25120.04 | Time | +114.3 | +0.60R | |
| 3791 | NAS100 | 15.12.25 09:33 | SELL | 25343.94 | 25593.06 | 24596.58 | 25062.52 | Time | +278.9 | +1.12R | |
| 3790 | NAS100 | 12.12.25 09:36 | BUY | 25568.98 | 25402.19 | 26069.36 | 25402.19 | SL | -169.3 | -1.01R | |
| 3789 | NAS100 | 11.12.25 09:30 | SELL | 25584.26 | 25751.05 | 25083.92 | 25687.99 | Time | -106.3 | -0.64R | |
| 3788 | NAS100 | 10.12.25 09:30 | BUY | 25631.44 | 25544.94 | 25890.95 | 25544.94 | SL | -89.1 | -1.03R | |
| 3787 | NAS100 | 09.12.25 09:31 | SELL | 25555.10 | 25702.16 | 25113.93 | 25668.68 | Time | -116.1 | -0.79R | |
| 3786 | NAS100 | 08.12.25 09:30 | BUY | 25776.16 | 25669.75 | 26095.40 | 25669.75 | SL | -109.0 | -1.02R | |
| 3785 | NAS100 | 05.12.25 09:30 | BUY | 25661.34 | 25550.31 | 25994.43 | 25687.01 | Time | +23.1 | +0.21R | |
| 3784 | NAS100 | 04.12.25 09:30 | SELL | 25640.55 | 25768.09 | 25257.93 | 25580.81 | Time | +57.2 | +0.45R | |
| 3783 | NAS100 | 03.12.25 09:30 | SELL | 25422.41 | 25549.48 | 25041.20 | 25549.48 | SL | -129.6 | -1.02R | |
| 3782 | NAS100 | 02.12.25 09:33 | BUY | 25471.93 | 25328.91 | 25900.99 | 25551.30 | Time | +76.8 | +0.54R | |
| 3781 | NAS100 | 01.12.25 09:30 | BUY | 25220.51 | 25136.45 | 25472.67 | 25350.08 | Time | +127.1 | +1.51R | |
| 3780 | NAS100 | 28.11.25 09:30 | BUY | 25307.35 | 25291.56 | 25354.73 | 25354.73 | TP | +44.9 | +2.84R | |
| 3779 | NAS100 | 26.11.25 09:51 | BUY | 25213.54 | 24947.30 | 26012.27 | 25233.29 | Time | +17.2 | +0.07R | |
| 3778 | NAS100 | 25.11.25 09:40 | SELL | 24740.63 | 24975.75 | 24035.28 | 24975.75 | SL | -237.6 | -1.01R | |
| 3777 | NAS100 | 24.11.25 09:31 | BUY | 24519.15 | 24186.00 | 25518.62 | 24864.79 | Time | +343.2 | +1.03R | |
| 3776 | NAS100 | 21.11.25 10:03 | SELL | 24009.30 | 24609.82 | 22207.74 | 24241.53 | Time | -234.6 | -0.39R | |
| 3775 | NAS100 | 20.11.25 09:30 | SELL | 25076.65 | 25314.34 | 24363.57 | 24363.57 | TP | +710.6 | +2.99R | |
| 3774 | NAS100 | 19.11.25 09:35 | BUY | 24574.29 | 24349.42 | 25248.88 | 24642.52 | Time | +65.8 | +0.29R | |
| 3773 | NAS100 | 18.11.25 09:31 | SELL | 24580.79 | 24840.63 | 23801.28 | 24496.83 | Time | +81.5 | +0.31R | |
| 3772 | NAS100 | 17.11.25 09:32 | BUY | 24977.05 | 24642.56 | 25980.49 | 24799.75 | Time | -179.8 | -0.54R | |
| 3771 | NAS100 | 14.11.25 09:32 | SELL | 24579.07 | 24826.07 | 23838.05 | 24826.07 | SL | -249.5 | -1.01R | |
| 3770 | NAS100 | 13.11.25 09:31 | SELL | 25347.54 | 25491.62 | 24915.30 | 24915.30 | TP | +429.7 | +2.98R | |
| 3769 | NAS100 | 12.11.25 09:30 | SELL | 25653.14 | 25758.87 | 25335.96 | 25523.09 | Time | +127.5 | +1.21R | |
| 3768 | NAS100 | 11.11.25 09:37 | BUY | 25532.01 | 25380.23 | 25987.33 | 25380.23 | SL | -154.3 | -1.02R | |
| 3767 | NAS100 | 10.11.25 09:33 | BUY | 25479.01 | 25247.07 | 26174.83 | 25607.78 | Time | +126.2 | +0.54R | |
| 3766 | NAS100 | 07.11.25 09:30 | SELL | 24951.44 | 25192.44 | 24228.47 | 25057.27 | Time | -108.3 | -0.45R | |
| 3765 | NAS100 | 06.11.25 09:32 | SELL | 25513.27 | 25707.07 | 24931.87 | 25140.40 | Time | +370.3 | +1.91R | |
| 3764 | NAS100 | 05.11.25 09:34 | SELL | 25384.00 | 25556.78 | 24865.67 | 25556.78 | SL | -175.3 | -1.01R | |
| 3763 | NAS100 | 04.11.25 09:30 | SELL | 25587.37 | 25711.44 | 25215.17 | 25711.44 | SL | -126.6 | -1.02R | |
| 3762 | NAS100 | 03.11.25 09:33 | BUY | 26128.25 | 25982.26 | 26566.24 | 25982.26 | SL | -148.6 | -1.02R | |
| 3761 | NAS100 | 31.10.25 09:33 | BUY | 25994.94 | 25873.19 | 26360.16 | 25873.19 | SL | -124.3 | -1.02R | |
| 3760 | NAS100 | 30.10.25 09:30 | BUY | 25911.00 | 25748.64 | 26398.08 | 25748.64 | SL | -164.9 | -1.02R | |
| 3759 | NAS100 | 29.10.25 09:44 | SELL | 26133.16 | 26244.35 | 25799.59 | 26084.96 | Time | +45.6 | +0.41R | |
| 3758 | NAS100 | 28.10.25 09:31 | SELL | 25889.49 | 25954.34 | 25694.92 | 25954.34 | SL | -67.4 | -1.04R | |
| 3757 | NAS100 | 27.10.25 09:36 | BUY | 25734.97 | 25666.77 | 25939.56 | 25827.80 | Time | +90.3 | +1.32R | |
| 3756 | NAS100 | 24.10.25 09:30 | SELL | 25290.39 | 25430.29 | 24870.68 | 25359.01 | Time | -71.2 | -0.51R | |
| 3755 | NAS100 | 23.10.25 09:37 | BUY | 24910.52 | 24669.88 | 25632.42 | 25094.15 | Time | +181.1 | +0.75R | |
| 3754 | NAS100 | 22.10.25 09:30 | SELL | 25090.46 | 25162.17 | 24875.36 | 24875.36 | TP | +212.6 | +2.96R | |
| 3753 | NAS100 | 21.10.25 09:31 | SELL | 25113.06 | 25229.81 | 24762.81 | 25127.41 | Time | -16.9 | -0.14R | |
| 3752 | NAS100 | 20.10.25 09:30 | BUY | 24991.28 | 24803.02 | 25556.08 | 25132.85 | Time | +139.1 | +0.74R | |
| 3751 | NAS100 | 17.10.25 09:34 | BUY | 24624.59 | 24359.14 | 25420.94 | 24818.20 | Time | +191.2 | +0.72R | |
| 3750 | NAS100 | 16.10.25 09:31 | BUY | 24917.77 | 24693.01 | 25592.04 | 24693.01 | SL | -227.2 | -1.01R | |
| 3749 | NAS100 | 15.10.25 09:34 | SELL | 24775.05 | 25036.70 | 23990.11 | 24750.25 | Time | +22.3 | +0.09R | |
| 3748 | NAS100 | 14.10.25 09:30 | SELL | 24437.58 | 24553.22 | 24090.67 | 24553.22 | SL | -118.1 | -1.02R | |
| 3747 | NAS100 | 13.10.25 09:36 | SELL | 24549.37 | 25045.31 | 23061.52 | 24740.28 | Time | -193.4 | -0.39R | |
| 3746 | NAS100 | 10.10.25 09:30 | SELL | 25106.74 | 25191.20 | 24853.35 | 25191.20 | SL | -87.0 | -1.03R | |
| 3745 | NAS100 | 09.10.25 09:33 | SELL | 25101.69 | 25233.94 | 24704.96 | 25099.41 | Time | -0.2 | -0.00R | |
| 3744 | NAS100 | 08.10.25 09:31 | BUY | 24908.43 | 24768.99 | 25326.77 | 25127.80 | Time | +216.9 | +1.55R | |
| 3743 | NAS100 | 07.10.25 09:30 | SELL | 25015.48 | 25085.73 | 24804.74 | 24804.74 | TP | +208.2 | +2.96R | |
| 3742 | NAS100 | 06.10.25 09:30 | SELL | 24984.91 | 25107.42 | 24617.38 | 24973.94 | Time | +8.5 | +0.07R | |
| 3741 | NAS100 | 03.10.25 09:31 | BUY | 24941.60 | 24855.34 | 25200.40 | 24855.34 | SL | -88.8 | -1.03R | |
| 3740 | NAS100 | 02.10.25 09:32 | SELL | 24919.47 | 25074.76 | 24453.61 | 24894.52 | Time | +22.5 | +0.14R | |
| 3739 | NAS100 | 01.10.25 09:30 | SELL | 24524.43 | 24618.98 | 24240.76 | 24618.98 | SL | -97.0 | -1.03R | |
| 3738 | NAS100 | 30.09.25 09:31 | SELL | 24577.36 | 24673.44 | 24289.14 | 24673.44 | SL | -98.5 | -1.03R | |
| 3737 | NAS100 | 29.09.25 09:31 | BUY | 24647.47 | 24541.03 | 24966.80 | 24610.45 | Time | -39.5 | -0.37R | |
| 3736 | NAS100 | 26.09.25 09:30 | SELL | 24397.03 | 24534.42 | 23984.88 | 24497.36 | Time | -102.8 | -0.75R | |
| 3735 | NAS100 | 25.09.25 09:30 | SELL | 24313.39 | 24448.08 | 23909.31 | 24448.08 | SL | -137.1 | -1.02R | |
| 3734 | NAS100 | 24.09.25 09:32 | SELL | 24620.51 | 24735.71 | 24274.91 | 24498.41 | Time | +119.6 | +1.04R | |
| 3733 | NAS100 | 23.09.25 09:36 | SELL | 24737.46 | 24845.48 | 24413.41 | 24585.99 | Time | +149.0 | +1.38R | |
| 3732 | NAS100 | 22.09.25 09:30 | BUY | 24582.23 | 24498.28 | 24834.06 | 24753.97 | Time | +169.3 | +2.02R | |
| 3731 | NAS100 | 19.09.25 09:33 | SELL | 24501.21 | 24608.53 | 24179.27 | 24608.53 | SL | -109.8 | -1.02R | |
| 3730 | NAS100 | 18.09.25 09:36 | BUY | 24458.32 | 24307.00 | 24912.29 | 24444.95 | Time | -15.8 | -0.10R | |
| 3729 | NAS100 | 17.09.25 09:30 | BUY | 24281.45 | 24232.76 | 24427.51 | 24232.76 | SL | -51.1 | -1.05R | |
| 3728 | NAS100 | 16.09.25 09:33 | SELL | 24317.72 | 24388.36 | 24105.78 | 24272.14 | Time | +43.1 | +0.61R | |
| 3727 | NAS100 | 15.09.25 09:30 | BUY | 24175.64 | 24099.00 | 24405.57 | 24293.06 | Time | +115.0 | +1.50R | |
| 3726 | NAS100 | 12.09.25 09:30 | BUY | 24034.00 | 23968.70 | 24229.88 | 24087.34 | Time | +50.9 | +0.78R | |
| 3725 | NAS100 | 11.09.25 09:36 | SELL | 23930.52 | 24037.99 | 23608.12 | 23983.20 | Time | -55.1 | -0.51R | |
| 3724 | NAS100 | 10.09.25 09:30 | SELL | 23953.03 | 24033.49 | 23711.64 | 23845.30 | Time | +105.3 | +1.31R | |
| 3723 | NAS100 | 09.09.25 09:30 | BUY | 23817.00 | 23753.70 | 24006.91 | 23753.70 | SL | -65.7 | -1.04R | |
| 3722 | NAS100 | 08.09.25 09:35 | BUY | 23789.55 | 23591.63 | 24383.34 | 23765.66 | Time | -26.3 | -0.13R | |
| 3721 | NAS100 | 05.09.25 09:30 | BUY | 23863.56 | 23729.37 | 24266.12 | 23729.37 | SL | -136.6 | -1.02R | |
| 3720 | NAS100 | 04.09.25 09:30 | SELL | 23418.58 | 23520.05 | 23114.15 | 23520.05 | SL | -103.8 | -1.02R | |
| 3719 | NAS100 | 03.09.25 09:31 | SELL | 23354.65 | 23486.17 | 22960.09 | 23408.12 | Time | -55.8 | -0.42R | |
| 3718 | NAS100 | 02.09.25 09:30 | SELL | 23048.96 | 23080.77 | 22953.52 | 23080.77 | SL | -34.1 | -1.07R | |
| 3717 | NAS100 | 01.09.25 09:31 | SELL | 23402.59 | 23534.11 | 23008.02 | 23452.28 | Time | -52.0 | -0.40R | |
| 3716 | NAS100 | 29.08.25 09:35 | SELL | 23576.32 | 23689.93 | 23235.49 | 23421.86 | Time | +152.1 | +1.34R | |
| 3715 | NAS100 | 28.08.25 09:30 | BUY | 23592.30 | 23522.11 | 23802.87 | 23522.11 | SL | -72.5 | -1.03R | |
| 3714 | NAS100 | 27.08.25 09:30 | BUY | 23492.01 | 23407.18 | 23746.49 | 23558.04 | Time | +63.7 | +0.75R | |
| 3713 | NAS100 | 26.08.25 09:30 | BUY | 23420.71 | 23334.26 | 23680.04 | 23519.58 | Time | +96.5 | +1.12R | |
| 3712 | NAS100 | 25.08.25 09:33 | SELL | 23380.36 | 23600.99 | 22718.48 | 23426.90 | Time | -48.9 | -0.22R | |
| 3711 | NAS100 | 22.08.25 09:30 | SELL | 23166.67 | 23279.90 | 22826.99 | 23279.90 | SL | -115.5 | -1.02R | |
| 3710 | NAS100 | 21.08.25 09:31 | SELL | 23141.58 | 23336.89 | 22555.65 | 23140.81 | Time | -1.5 | -0.01R | |
| 3709 | NAS100 | 20.08.25 09:30 | SELL | 23310.17 | 23481.53 | 22796.10 | 23248.61 | Time | +59.2 | +0.35R | |
| 3708 | NAS100 | 19.08.25 09:30 | SELL | 23666.29 | 23718.78 | 23508.83 | 23508.83 | TP | +155.1 | +2.96R | |
| 3707 | NAS100 | 18.08.25 09:30 | BUY | 23696.89 | 23610.54 | 23955.94 | 23710.69 | Time | +11.4 | +0.13R | |
| 3706 | NAS100 | 15.08.25 09:30 | SELL | 23802.72 | 23884.37 | 23557.77 | 23715.49 | Time | +84.9 | +1.04R | |
| 3705 | NAS100 | 14.08.25 09:31 | BUY | 23779.58 | 23688.88 | 24051.70 | 23824.37 | Time | +42.4 | +0.47R | |
| 3704 | NAS100 | 13.08.25 09:56 | SELL | 23910.41 | 24071.79 | 23426.26 | 23847.47 | Time | +60.5 | +0.38R | |
| 3703 | NAS100 | 12.08.25 09:38 | BUY | 23646.47 | 23538.24 | 23971.15 | 23538.24 | SL | -110.6 | -1.02R | |
| 3702 | NAS100 | 11.08.25 09:31 | SELL | 23591.47 | 23685.89 | 23308.22 | 23685.89 | SL | -96.8 | -1.02R | |
| 3701 | NAS100 | 08.08.25 09:31 | BUY | 23474.29 | 23306.34 | 23978.14 | 23609.26 | Time | +132.6 | +0.79R | |
| 3700 | NAS100 | 07.08.25 09:34 | BUY | 23518.53 | 23372.72 | 23955.93 | 23372.72 | SL | -148.1 | -1.02R | |
| 3699 | NAS100 | 06.08.25 09:31 | BUY | 23086.71 | 22946.85 | 23506.30 | 23310.45 | Time | +221.4 | +1.58R | |
| 3698 | NAS100 | 05.08.25 09:30 | SELL | 23209.53 | 23317.81 | 22884.72 | 23021.15 | Time | +186.1 | +1.72R | |
| 3697 | NAS100 | 04.08.25 09:33 | BUY | 23006.07 | 22856.14 | 23455.87 | 23178.15 | Time | +169.8 | +1.13R | |
| 3696 | NAS100 | 01.08.25 09:30 | SELL | 22915.88 | 23138.40 | 22248.32 | 22761.88 | Time | +151.7 | +0.68R | |
| 3695 | NAS100 | 31.07.25 09:30 | SELL | 23587.73 | 23703.42 | 23240.66 | 23240.66 | TP | +344.7 | +2.98R | |
| 3694 | NAS100 | 30.07.25 09:31 | SELL | 23325.59 | 23441.19 | 22978.77 | 23441.19 | SL | -117.9 | -1.02R | |
| 3693 | NAS100 | 29.07.25 09:30 | BUY | 23464.67 | 23419.87 | 23599.07 | 23419.87 | SL | -47.1 | -1.05R | |
| 3692 | NAS100 | 28.07.25 09:30 | BUY | 23342.28 | 23270.82 | 23556.66 | 23350.11 | Time | +5.5 | +0.08R | |
| 3691 | NAS100 | 25.07.25 09:30 | SELL | 23203.84 | 23264.86 | 23020.77 | 23264.86 | SL | -63.3 | -1.04R | |
| 3690 | NAS100 | 24.07.25 09:30 | BUY | 23239.90 | 23152.49 | 23502.15 | 23152.49 | SL | -89.7 | -1.03R | |
| 3689 | NAS100 | 23.07.25 09:30 | SELL | 23084.05 | 23200.96 | 22733.30 | 23171.04 | Time | -89.3 | -0.76R | |
| 3688 | NAS100 | 22.07.25 09:30 | SELL | 23168.52 | 23252.03 | 22917.96 | 23066.71 | Time | +99.5 | +1.19R | |
| 3687 | NAS100 | 21.07.25 09:30 | BUY | 23110.21 | 23044.42 | 23307.60 | 23185.50 | Time | +73.0 | +1.11R | |
| 3686 | NAS100 | 18.07.25 09:30 | SELL | 23114.10 | 23219.82 | 22796.92 | 23064.45 | Time | +47.3 | +0.45R | |
| 3685 | NAS100 | 17.07.25 09:33 | SELL | 22903.54 | 23034.28 | 22511.35 | 23034.28 | SL | -133.0 | -1.02R | |
| 3684 | NAS100 | 16.07.25 09:31 | SELL | 22881.75 | 22967.69 | 22623.94 | 22903.58 | Time | -24.1 | -0.28R | |
| 3683 | NAS100 | 15.07.25 09:30 | BUY | 23044.61 | 22932.93 | 23379.64 | 22932.93 | SL | -114.0 | -1.02R | |
| 3682 | NAS100 | 14.07.25 09:30 | BUY | 22779.34 | 22700.65 | 23015.38 | 22700.65 | SL | -81.0 | -1.03R | |
| 3681 | NAS100 | 11.07.25 09:30 | BUY | 22751.03 | 22657.63 | 23031.25 | 22773.84 | Time | +20.5 | +0.22R | |
| 3680 | NAS100 | 10.07.25 09:32 | SELL | 22864.78 | 22958.63 | 22583.23 | 22826.95 | Time | +35.5 | +0.38R | |
| 3679 | NAS100 | 09.07.25 09:30 | BUY | 22795.65 | 22735.08 | 22977.35 | 22735.08 | SL | -62.8 | -1.04R | |
| 3678 | NAS100 | 08.07.25 09:32 | SELL | 22718.85 | 22818.05 | 22421.25 | 22695.70 | Time | +20.9 | +0.21R | |
| 3677 | NAS100 | 07.07.25 09:30 | BUY | 22755.66 | 22727.34 | 22840.65 | 22727.34 | SL | -30.6 | -1.08R | |
| 3676 | NAS100 | 04.07.25 09:35 | SELL | 22704.26 | 22793.21 | 22437.43 | 22708.95 | Time | -7.0 | -0.08R | |
| 3675 | NAS100 | 03.07.25 09:30 | BUY | 22741.00 | 22640.07 | 23043.78 | 22866.39 | Time | +123.1 | +1.22R | |
| 3674 | NAS100 | 02.07.25 09:32 | BUY | 22468.05 | 22343.74 | 22840.97 | 22632.13 | Time | +161.8 | +1.30R | |
| 3673 | NAS100 | 01.07.25 09:30 | BUY | 22603.17 | 22526.69 | 22832.62 | 22526.69 | SL | -78.7 | -1.03R | |
| 3672 | NAS100 | 30.06.25 09:31 | SELL | 22630.70 | 22741.04 | 22299.66 | 22669.67 | Time | -41.2 | -0.37R | |
| 3671 | NAS100 | 27.06.25 09:34 | BUY | 22512.04 | 22404.94 | 22833.36 | 22404.94 | SL | -109.4 | -1.02R | |
| 3670 | NAS100 | 26.06.25 09:32 | SELL | 22314.81 | 22395.38 | 22073.07 | 22395.38 | SL | -82.8 | -1.03R | |
| 3669 | NAS100 | 25.06.25 09:30 | BUY | 22294.94 | 22204.79 | 22565.39 | 22204.79 | SL | -92.4 | -1.02R | |
| 3668 | NAS100 | 24.06.25 09:42 | BUY | 22103.70 | 21926.75 | 22634.55 | 22182.78 | Time | +76.9 | +0.43R | |
| 3667 | NAS100 | 23.06.25 09:31 | SELL | 21614.05 | 21794.94 | 21071.39 | 21794.94 | SL | -183.1 | -1.01R | |
| 3666 | NAS100 | 20.06.25 09:30 | BUY | 21864.56 | 21797.01 | 22067.23 | 21797.01 | SL | -69.7 | -1.03R | |
| 3665 | NAS100 | 19.06.25 09:30 | SELL | 21534.39 | 21639.47 | 21219.17 | 21477.32 | Time | +54.9 | +0.52R | |
| 3664 | NAS100 | 18.06.25 09:30 | SELL | 21737.29 | 21849.60 | 21400.38 | 21849.60 | SL | -114.5 | -1.02R | |
| 3663 | NAS100 | 17.06.25 09:30 | BUY | 21846.19 | 21744.52 | 22151.21 | 21744.52 | SL | -103.9 | -1.02R | |
| 3662 | NAS100 | 16.06.25 09:30 | BUY | 21803.73 | 21678.69 | 22178.84 | 21936.63 | Time | +130.7 | +1.04R | |
| 3661 | NAS100 | 13.06.25 09:30 | BUY | 21678.01 | 21598.84 | 21915.52 | 21598.84 | SL | -81.3 | -1.03R | |
| 3660 | NAS100 | 12.06.25 09:30 | BUY | 21832.16 | 21694.52 | 22245.06 | 21914.88 | Time | +80.5 | +0.58R | |
| 3659 | NAS100 | 11.06.25 09:31 | SELL | 21967.54 | 22091.51 | 21595.62 | 21864.59 | Time | +100.7 | +0.81R | |
| 3658 | NAS100 | 10.06.25 09:30 | BUY | 21822.67 | 21754.11 | 22028.35 | 21754.11 | SL | -70.7 | -1.03R | |
| 3657 | NAS100 | 09.06.25 09:30 | BUY | 21782.22 | 21708.27 | 22004.09 | 21790.80 | Time | +6.4 | +0.09R | |
| 3656 | NAS100 | 06.06.25 09:42 | BUY | 21807.89 | 21594.20 | 22448.96 | 21756.12 | Time | -53.9 | -0.25R | |
| 3655 | NAS100 | 05.06.25 09:30 | BUY | 21794.55 | 21714.40 | 22034.98 | 21714.40 | SL | -82.3 | -1.03R | |
| 3654 | NAS100 | 04.06.25 09:31 | BUY | 21713.43 | 21589.65 | 22084.78 | 21718.87 | Time | +3.3 | +0.03R | |
| 3653 | NAS100 | 03.06.25 09:30 | BUY | 21536.96 | 21383.16 | 21998.34 | 21664.29 | Time | +125.2 | +0.81R | |
| 3652 | NAS100 | 02.06.25 09:30 | BUY | 21283.00 | 21101.09 | 21828.72 | 21491.15 | Time | +206.0 | +1.13R | |
| 3651 | NAS100 | 30.05.25 09:31 | SELL | 21296.70 | 21484.79 | 20732.42 | 21322.05 | Time | -27.5 | -0.15R | |
| 3650 | NAS100 | 29.05.25 09:30 | SELL | 21599.75 | 21707.22 | 21277.33 | 21277.33 | TP | +320.3 | +2.98R | |
| 3649 | NAS100 | 28.05.25 09:37 | BUY | 21476.60 | 21331.16 | 21912.90 | 21331.16 | SL | -147.6 | -1.01R | |
| 3648 | NAS100 | 27.05.25 09:30 | BUY | 21214.49 | 21168.66 | 21351.97 | 21168.66 | SL | -47.9 | -1.05R | |
| 3647 | NAS100 | 26.05.25 09:32 | BUY | 21230.77 | 21098.31 | 21628.13 | 21224.28 | Time | -8.6 | -0.07R | |
| 3646 | NAS100 | 23.05.25 09:30 | BUY | 20807.73 | 20696.94 | 21140.11 | 20920.85 | Time | +111.0 | +1.00R | |
| 3645 | NAS100 | 22.05.25 09:32 | BUY | 21147.31 | 20904.88 | 21874.59 | 21115.08 | Time | -34.3 | -0.14R | |
| 3644 | NAS100 | 21.05.25 09:30 | BUY | 21223.90 | 21136.31 | 21486.69 | 21136.31 | SL | -89.7 | -1.02R | |
| 3643 | NAS100 | 20.05.25 09:47 | SELL | 21302.88 | 21473.18 | 20792.00 | 21373.61 | Time | -72.9 | -0.43R | |
| 3642 | NAS100 | 19.05.25 09:30 | BUY | 21142.39 | 21046.92 | 21428.82 | 21428.82 | TP | +284.3 | +2.98R | |
| 3641 | NAS100 | 16.05.25 09:30 | SELL | 21356.78 | 21496.13 | 20938.73 | 21424.75 | Time | -70.1 | -0.50R | |
| 3640 | NAS100 | 15.05.25 09:30 | SELL | 21205.55 | 21279.16 | 20984.73 | 21279.16 | SL | -75.7 | -1.03R | |
| 3639 | NAS100 | 14.05.25 09:32 | BUY | 21270.55 | 21084.21 | 21829.57 | 21315.53 | Time | +42.9 | +0.23R | |
| 3638 | NAS100 | 13.05.25 09:31 | SELL | 20895.75 | 21026.65 | 20503.05 | 21026.65 | SL | -133.0 | -1.02R | |
| 3637 | NAS100 | 12.05.25 09:30 | SELL | 20819.46 | 20930.15 | 20487.38 | 20864.51 | Time | -47.1 | -0.43R | |
| 3636 | NAS100 | 09.05.25 09:34 | BUY | 20181.39 | 20005.54 | 20708.94 | 20005.54 | SL | -177.9 | -1.01R | |
| 3635 | NAS100 | 08.05.25 09:32 | SELL | 20042.90 | 20230.16 | 19481.12 | 20230.16 | SL | -189.3 | -1.01R | |
| 3634 | NAS100 | 07.05.25 09:30 | SELL | 19784.20 | 19927.47 | 19354.40 | 19927.47 | SL | -145.2 | -1.01R | |
| 3633 | NAS100 | 06.05.25 09:31 | BUY | 19727.53 | 19622.30 | 20043.23 | 19787.15 | Time | +57.6 | +0.55R | |
| 3632 | NAS100 | 05.05.25 09:35 | BUY | 19940.02 | 19814.35 | 20317.06 | 19974.78 | Time | +32.8 | +0.26R | |
| 3631 | NAS100 | 02.05.25 09:32 | BUY | 20023.87 | 19889.73 | 20426.29 | 20087.88 | Time | +62.0 | +0.46R | |
| 3630 | NAS100 | 01.05.25 09:39 | SELL | 19812.92 | 20116.44 | 18902.33 | 19773.75 | Time | +37.2 | +0.12R | |
| 3629 | NAS100 | 30.04.25 09:30 | SELL | 19170.69 | 19311.28 | 18748.93 | 19311.28 | SL | -142.5 | -1.01R | |
| 3628 | NAS100 | 29.04.25 09:32 | BUY | 19361.12 | 19179.96 | 19904.61 | 19540.50 | Time | +177.4 | +0.98R | |
| 3627 | NAS100 | 28.04.25 09:33 | SELL | 19409.25 | 19567.66 | 18934.02 | 19421.95 | Time | -14.6 | -0.09R | |
| 3626 | NAS100 | 25.04.25 09:35 | BUY | 19242.63 | 18999.02 | 19973.48 | 19421.71 | Time | +177.2 | +0.73R | |
| 3625 | NAS100 | 24.04.25 09:40 | BUY | 18801.42 | 18583.14 | 19456.25 | 19204.64 | Time | +401.3 | +1.84R | |
| 3624 | NAS100 | 23.04.25 09:32 | BUY | 18877.80 | 18673.81 | 19489.77 | 18673.81 | SL | -205.9 | -1.01R | |
| 3623 | NAS100 | 22.04.25 09:30 | SELL | 17997.16 | 18225.74 | 17311.43 | 18225.74 | SL | -230.4 | -1.01R | |
| 3622 | NAS100 | 21.04.25 09:31 | BUY | 18032.31 | 17904.19 | 18416.66 | 17904.19 | SL | -129.9 | -1.01R | |
| 3621 | NAS100 | 17.04.25 09:31 | SELL | 18321.23 | 18627.89 | 17401.25 | 18250.05 | Time | +69.3 | +0.23R | |
| 3620 | NAS100 | 16.04.25 09:30 | BUY | 18475.07 | 18346.19 | 18861.72 | 18346.19 | SL | -130.7 | -1.01R | |
| 3619 | NAS100 | 15.04.25 09:33 | BUY | 18899.13 | 18642.70 | 19668.43 | 18823.45 | Time | -77.6 | -0.30R | |
| 3618 | NAS100 | 14.04.25 09:35 | SELL | 19031.98 | 19329.06 | 18140.75 | 18799.42 | Time | +230.7 | +0.78R | |
| 3617 | NAS100 | 11.04.25 09:39 | BUY | 18371.58 | 17902.45 | 19778.98 | 18668.41 | Time | +295.0 | +0.63R | |
| 3616 | NAS100 | 10.04.25 11:16 | SELL | 18419.38 | 19495.79 | 15190.15 | 18339.88 | Time | +77.6 | +0.07R | |
| 3615 | NAS100 | 09.04.25 09:32 | BUY | 17213.48 | 16523.77 | 19282.62 | 19124.31 | Time | +1909.1 | +2.77R | |
| 3614 | NAS100 | 08.04.25 10:05 | BUY | 18187.89 | 17344.97 | 20716.68 | 17344.97 | SL | -844.7 | -1.00R | |
| 3613 | NAS100 | 07.04.25 09:35 | SELL | 16713.49 | 17065.80 | 15656.55 | 17065.80 | SL | -354.0 | -1.00R | |
| 3612 | NAS100 | 04.04.25 09:30 | BUY | 18032.60 | 17833.31 | 18630.47 | 17833.31 | SL | -201.1 | -1.01R | |
| 3611 | NAS100 | 03.04.25 09:30 | BUY | 18806.34 | 18521.48 | 19660.89 | 18521.48 | SL | -286.7 | -1.01R | |
| 3610 | NAS100 | 02.04.25 09:33 | BUY | 19195.43 | 19004.76 | 19767.46 | 19573.26 | Time | +375.9 | +1.97R | |
| 3609 | NAS100 | 01.04.25 09:33 | BUY | 19257.81 | 19000.48 | 20029.77 | 19430.00 | Time | +170.3 | +0.66R | |
| 3608 | NAS100 | 31.03.25 09:31 | SELL | 18963.10 | 19085.86 | 18594.84 | 19085.86 | SL | -124.7 | -1.01R | |
| 3607 | NAS100 | 28.03.25 09:33 | SELL | 19431.16 | 19542.02 | 19098.56 | 19231.16 | Time | +198.0 | +1.79R | |
| 3606 | NAS100 | 27.03.25 09:37 | BUY | 19950.60 | 19814.36 | 20359.30 | 19814.36 | SL | -138.2 | -1.01R | |
| 3605 | NAS100 | 26.03.25 09:30 | SELL | 20075.37 | 20128.40 | 19916.29 | 19916.29 | TP | +157.1 | +2.96R | |
| 3604 | NAS100 | 25.03.25 09:31 | SELL | 20244.69 | 20293.84 | 20097.26 | 20293.84 | SL | -51.2 | -1.04R | |
| 3603 | NAS100 | 24.03.25 10:07 | BUY | 20165.22 | 20020.60 | 20599.07 | 20163.74 | Time | -3.5 | -0.02R | |
| 3602 | NAS100 | 21.03.25 09:40 | SELL | 19512.20 | 19663.93 | 19057.02 | 19663.93 | SL | -153.7 | -1.01R | |
| 3601 | NAS100 | 20.03.25 09:43 | BUY | 19877.85 | 19697.20 | 20419.78 | 19697.20 | SL | -182.6 | -1.01R | |
| 3600 | NAS100 | 19.03.25 09:42 | SELL | 19616.82 | 19705.33 | 19351.27 | 19705.33 | SL | -90.5 | -1.02R | |
| 3599 | NAS100 | 18.03.25 09:42 | BUY | 19519.38 | 19354.35 | 20014.47 | 19508.48 | Time | -12.9 | -0.08R | |
| 3598 | NAS100 | 17.03.25 09:36 | SELL | 19673.92 | 19810.69 | 19263.60 | 19810.69 | SL | -138.7 | -1.01R | |
| 3597 | NAS100 | 14.03.25 09:32 | BUY | 19494.39 | 19313.92 | 20035.83 | 19644.06 | Time | +147.7 | +0.82R | |
| 3596 | NAS100 | 13.03.25 09:30 | BUY | 19492.44 | 19326.30 | 19990.85 | 19326.30 | SL | -168.1 | -1.01R | |
| 3595 | NAS100 | 12.03.25 09:31 | SELL | 19561.89 | 19802.65 | 18839.61 | 19550.80 | Time | +9.1 | +0.04R | |
| 3594 | NAS100 | 11.03.25 09:30 | BUY | 19337.68 | 19122.72 | 19982.58 | 19411.11 | Time | +71.5 | +0.33R | |
| 3593 | NAS100 | 10.03.25 09:45 | SELL | 19584.70 | 19845.18 | 18803.29 | 19433.70 | Time | +149.0 | +0.57R | |
| 3592 | NAS100 | 07.03.25 09:33 | BUY | 20054.87 | 19800.47 | 20818.07 | 19800.47 | SL | -256.4 | -1.01R | |
| 3591 | NAS100 | 06.03.25 09:30 | SELL | 20225.94 | 20479.01 | 19466.74 | 20056.71 | Time | +167.2 | +0.66R | |
| 3590 | NAS100 | 05.03.25 09:36 | SELL | 20312.94 | 20641.08 | 19328.52 | 20641.08 | SL | -330.2 | -1.01R | |
| 3589 | NAS100 | 04.03.25 09:32 | SELL | 20221.19 | 20620.34 | 19023.74 | 20620.34 | SL | -401.2 | -1.00R | |
| 3588 | NAS100 | 03.03.25 09:33 | BUY | 21057.02 | 20815.86 | 21780.49 | 20815.86 | SL | -243.3 | -1.01R | |
| 3587 | NAS100 | 28.02.25 09:31 | SELL | 20462.23 | 20852.16 | 19292.45 | 20852.16 | SL | -392.0 | -1.00R | |
| 3586 | NAS100 | 27.02.25 09:36 | BUY | 21318.49 | 21146.65 | 21834.02 | 21146.65 | SL | -174.0 | -1.01R | |
| 3585 | NAS100 | 26.02.25 09:30 | SELL | 21134.53 | 21337.66 | 20525.13 | 21337.66 | SL | -205.3 | -1.01R | |
| 3584 | NAS100 | 25.02.25 09:31 | SELL | 21288.10 | 21484.27 | 20699.56 | 21085.66 | Time | +200.3 | +1.02R | |
| 3583 | NAS100 | 24.02.25 09:37 | SELL | 21634.17 | 21894.78 | 20852.31 | 21356.29 | Time | +275.7 | +1.06R | |
| 3582 | NAS100 | 21.02.25 09:31 | SELL | 22087.55 | 22222.46 | 21682.81 | 21682.81 | TP | +402.5 | +2.98R | |
| 3581 | NAS100 | 20.02.25 09:33 | SELL | 22110.83 | 22201.07 | 21840.09 | 22070.09 | Time | +38.5 | +0.43R | |
| 3580 | NAS100 | 19.02.25 09:31 | SELL | 22112.27 | 22196.07 | 21860.87 | 22196.07 | SL | -86.0 | -1.03R | |
| 3579 | NAS100 | 18.02.25 09:30 | SELL | 22177.07 | 22206.53 | 22088.70 | 22088.70 | TP | +86.2 | +2.92R | |
| 3578 | NAS100 | 17.02.25 09:30 | SELL | 22150.72 | 22218.54 | 21947.29 | 22156.81 | Time | -8.3 | -0.12R | |
| 3577 | NAS100 | 14.02.25 09:31 | BUY | 22052.30 | 21909.13 | 22481.78 | 22115.82 | Time | +61.3 | +0.43R | |
| 3576 | NAS100 | 13.02.25 09:31 | BUY | 21811.52 | 21659.56 | 22267.40 | 22020.83 | Time | +207.1 | +1.36R | |
| 3575 | NAS100 | 12.02.25 09:30 | BUY | 21476.58 | 21390.01 | 21736.30 | 21736.30 | TP | +257.6 | +2.98R | |
| 3574 | NAS100 | 11.02.25 09:30 | BUY | 21625.24 | 21552.75 | 21842.72 | 21697.32 | Time | +69.9 | +0.96R | |
| 3573 | NAS100 | 10.02.25 09:45 | BUY | 21712.18 | 21507.93 | 22324.93 | 21747.91 | Time | +33.6 | +0.16R | |
| 3572 | NAS100 | 07.02.25 09:30 | SELL | 21774.12 | 21858.74 | 21520.25 | 21858.74 | SL | -86.8 | -1.03R | |
| 3571 | NAS100 | 06.02.25 09:31 | SELL | 21647.10 | 21779.07 | 21251.22 | 21767.93 | Time | -123.0 | -0.93R | |
| 3570 | NAS100 | 05.02.25 09:32 | SELL | 21415.67 | 21558.49 | 20987.18 | 21558.49 | SL | -145.0 | -1.01R | |
| 3569 | NAS100 | 04.02.25 09:35 | BUY | 21357.97 | 21154.06 | 21969.68 | 21559.92 | Time | +199.8 | +0.98R | |
| 3568 | NAS100 | 03.02.25 09:36 | BUY | 21146.24 | 20933.36 | 21784.89 | 21294.74 | Time | +146.4 | +0.69R | |
| 3567 | NAS100 | 31.01.25 09:31 | BUY | 21692.42 | 21529.31 | 22181.74 | 21529.31 | SL | -165.3 | -1.01R | |
| 3566 | NAS100 | 30.01.25 09:34 | SELL | 21506.38 | 21624.43 | 21152.23 | 21624.43 | SL | -120.2 | -1.02R | |
| 3565 | NAS100 | 29.01.25 09:32 | SELL | 21430.86 | 21664.04 | 20731.31 | 21409.67 | Time | +19.0 | +0.08R | |
| 3564 | NAS100 | 28.01.25 09:31 | SELL | 21142.04 | 21304.48 | 20654.72 | 21304.48 | SL | -164.6 | -1.01R | |
| 3563 | NAS100 | 27.01.25 09:30 | BUY | 21015.05 | 20897.22 | 21368.55 | 21130.28 | Time | +113.1 | +0.96R | |
| 3562 | NAS100 | 24.01.25 09:32 | SELL | 21888.74 | 21979.08 | 21617.71 | 21771.04 | Time | +115.5 | +1.28R | |
| 3561 | NAS100 | 23.01.25 09:30 | SELL | 21720.89 | 21814.02 | 21441.51 | 21814.02 | SL | -95.3 | -1.02R | |
| 3560 | NAS100 | 22.01.25 09:31 | BUY | 21791.88 | 21669.97 | 22157.59 | 21846.63 | Time | +52.6 | +0.43R | |
| 3559 | NAS100 | 21.01.25 09:30 | SELL | 21542.64 | 21619.16 | 21313.06 | 21619.16 | SL | -78.7 | -1.03R | |
| 3558 | NAS100 | 20.01.25 09:35 | BUY | 21588.40 | 21493.85 | 21872.05 | 21493.85 | SL | -96.7 | -1.02R | |
| 3557 | NAS100 | 17.01.25 09:30 | SELL | 21474.00 | 21596.48 | 21106.55 | 21447.92 | Time | +23.9 | +0.20R | |
| 3556 | NAS100 | 16.01.25 09:30 | SELL | 21301.66 | 21428.66 | 20920.68 | 21087.72 | Time | +211.8 | +1.67R | |
| 3555 | NAS100 | 15.01.25 09:37 | SELL | 21059.31 | 21234.86 | 20532.67 | 21234.86 | SL | -177.7 | -1.01R | |
| 3554 | NAS100 | 14.01.25 09:30 | SELL | 20885.65 | 21016.71 | 20492.48 | 20761.67 | Time | +121.9 | +0.93R | |
| 3553 | NAS100 | 13.01.25 09:36 | SELL | 20567.79 | 20727.56 | 20088.47 | 20727.56 | SL | -161.8 | -1.01R | |
| 3552 | NAS100 | 10.01.25 09:30 | SELL | 20991.84 | 21124.80 | 20592.94 | 20848.80 | Time | +140.9 | +1.06R | |
| 3551 | NAS100 | 08.01.25 09:39 | SELL | 21118.14 | 21379.01 | 20335.52 | 21174.90 | Time | -58.9 | -0.23R | |
| 3550 | NAS100 | 07.01.25 09:33 | SELL | 21580.44 | 21703.91 | 21210.04 | 21210.04 | TP | +368.2 | +2.98R | |
| 3549 | NAS100 | 06.01.25 09:30 | BUY | 21566.20 | 21417.71 | 22011.66 | 21560.39 | Time | -8.0 | -0.05R | |
| 3548 | NAS100 | 03.01.25 09:31 | BUY | 21147.26 | 20918.06 | 21834.84 | 21310.38 | Time | +161.0 | +0.70R | |
| 3547 | NAS100 | 02.01.25 09:33 | SELL | 21112.28 | 21261.93 | 20663.33 | 20972.84 | Time | +137.3 | +0.92R | |
| Total: 470 | +36.2R | ||||||||||
How to calculate the lot size
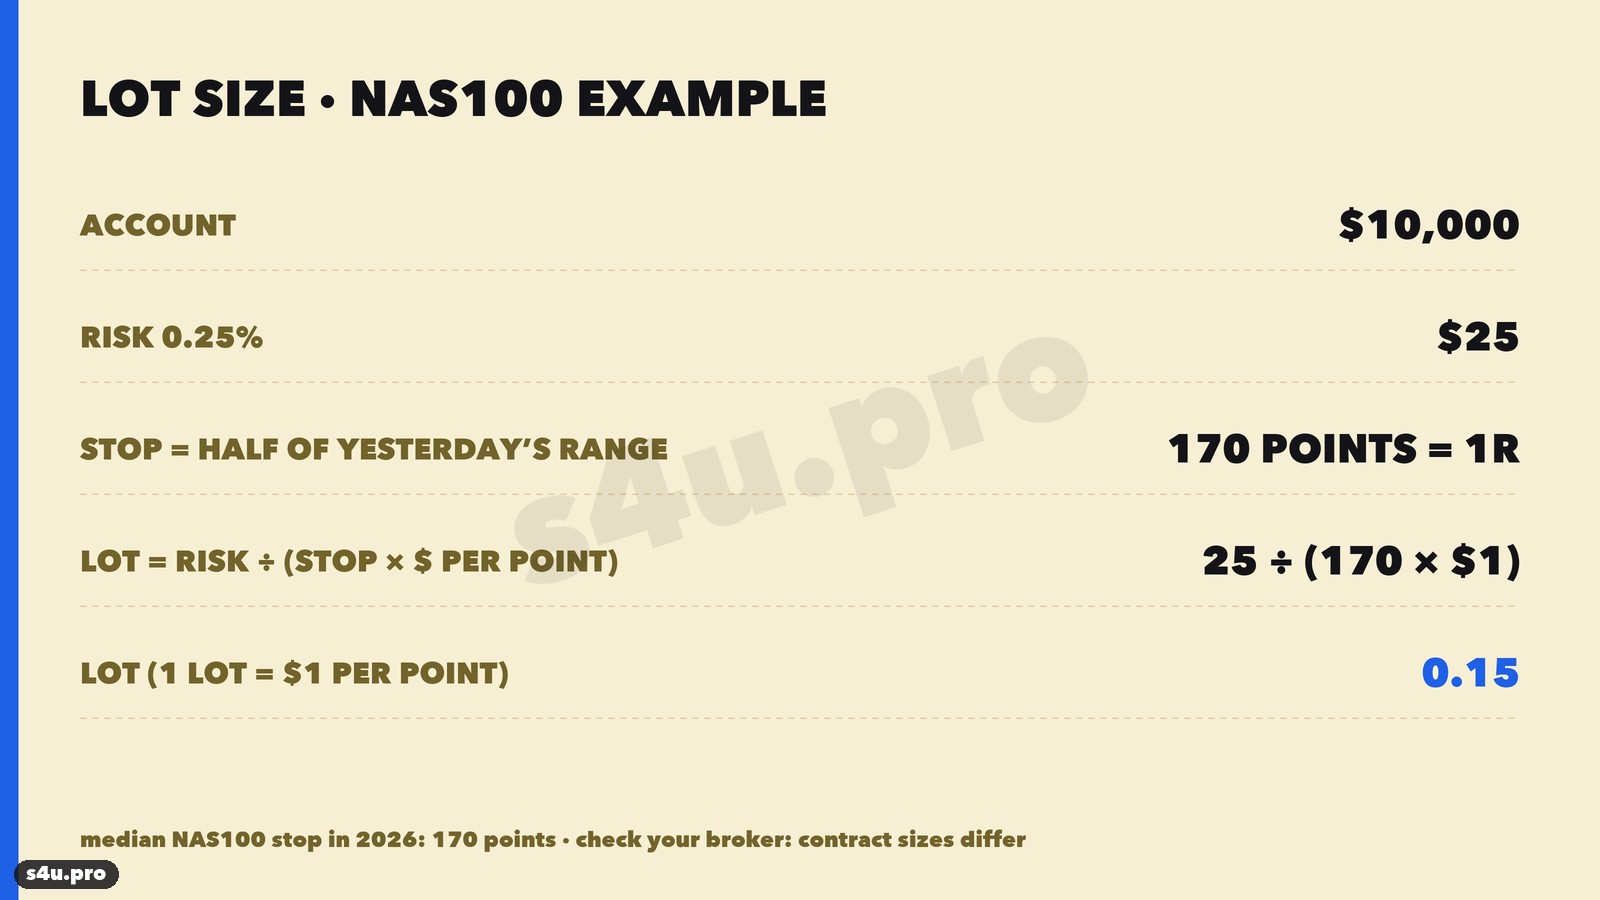
Risk is calculated from the stop: lot = risk amount ÷ (stop in points × point value per 1 lot). The NAS100 point value differs between brokers: somewhere 1 lot = $1 per point, elsewhere $10 — check the contract specification in your terminal. Example: account $10,000, risk 0.25% ($25), stop 170 points, 1 lot = $1 per point: lot = 25 ÷ 170 ≈ 0.15. The stop is different every day — recalculate the lot every day too.
45% of trades are winners, there are streaks of up to 15 losses in a row, the maximum drawdown is −39.5R. At 1% risk per trade that is −40% of the account, at 0.5% −20%, at 0.25% −10%. So keep the risk at 0.25–0.5% per trade.Common mistakes
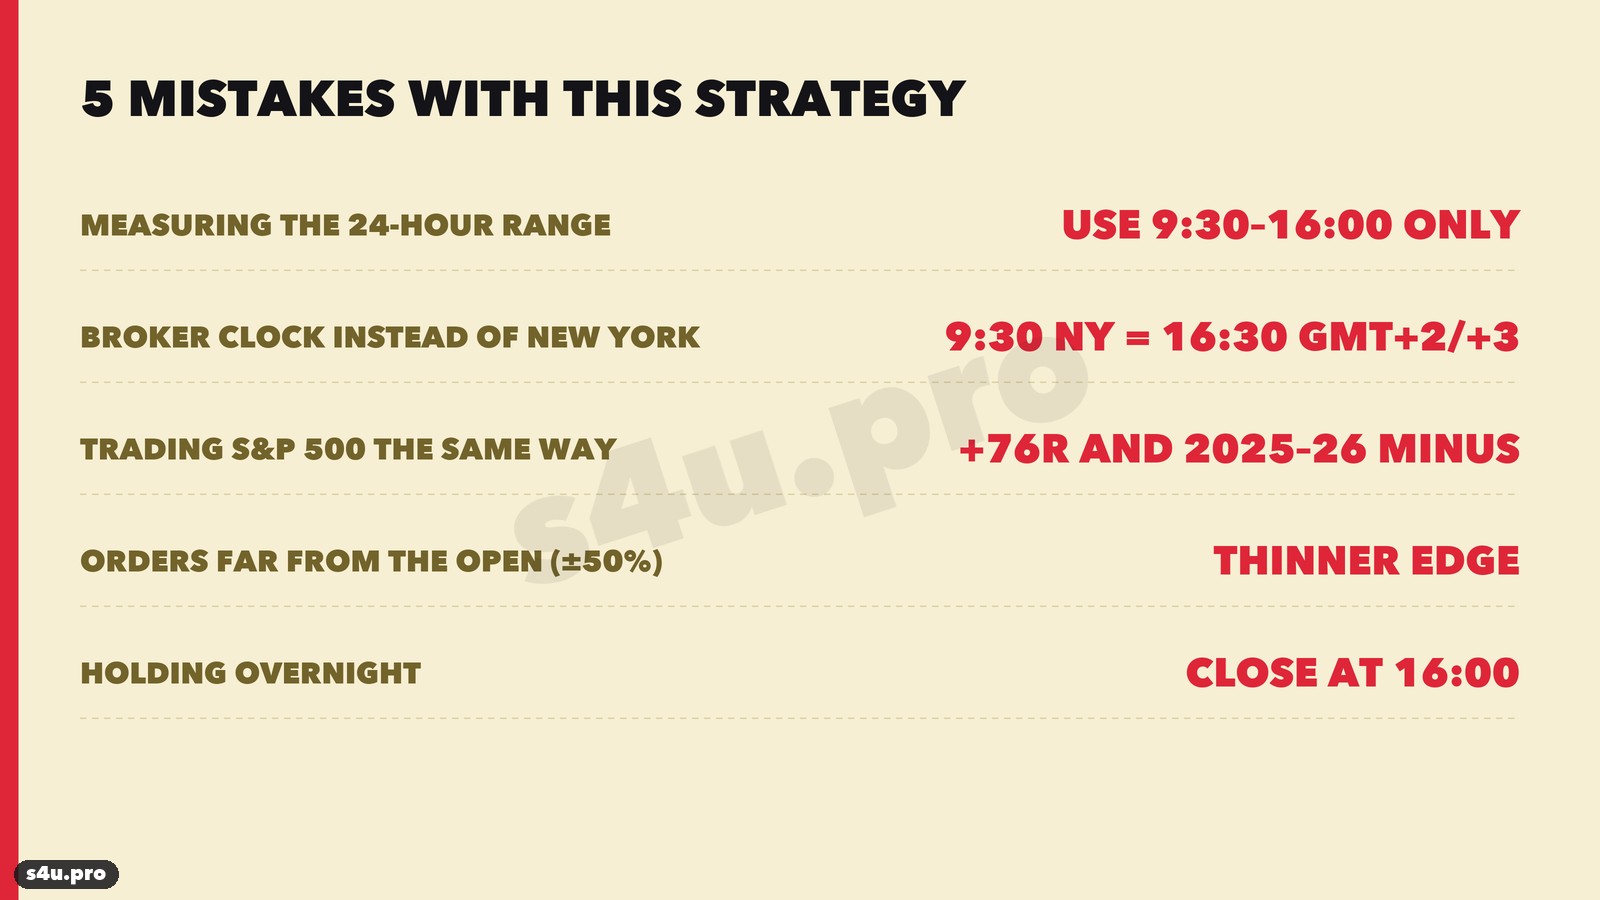
- Measuring the 24-hour range. You need the range of the exchange session, 9:30–16:00 New York. Night hours make the range wider and shift the orders.
- Placing the orders by the server clock without converting. 9:30 New York is 16:30 server time GMT+2/GMT+3. If your broker uses another server time — convert. In March and November the US and Europe change clocks in different weeks.
- Trading the S&P 500 the same way. +76R in 16 years and a loss in 2025–2026. The strategy is for NAS100.
- Moving the orders far from the open. 30% of the range is worse than 10%, and on daily charts (without the exchange open) the breakout loses money.
- Holding the trade overnight. The rule is to close at 16:00 New York. Overnight risk is not part of the test.
FAQ
What is the strategy based on?
On Larry Williams’ idea: if price moves sharply one way after the open, by the close it usually goes even further the same way. Orders 10% of yesterday’s range from the open catch that first move.
Is this the strategy that won the 1987 championship?
The same idea — a volatility breakout from the daily open. Williams traded S&P 500 futures and tuned the coefficients himself; we used NAS100, the 9:30 exchange open and 10% of yesterday’s exchange-hours range.
What time do I place the orders in GMT and in the terminal?
9:30 New York is 14:30 GMT in winter and 13:30 GMT in summer; on a GMT+2/GMT+3 server it is 16:30 all year round. The 16:00 New York close is 23:00 server time.
Do I need a trend filter?
No. Buys and sells are profitable separately (+173R and +108R).
Why not the S&P 500?
On the S&P 500 the result is three times weaker (+76R), and 2025 and 2026 are negative.
What is R?
R is the size of the stop. −1R means the stop was hit, +3R is a profit of three stops. On NAS100 in 2026 1R was about 170 points on average; at 0.25% risk 1R = 0.25% of the account.
What risk should I use?
0.25–0.5% per trade. The test drawdown is −39.5R, with streaks of up to 15 losses.
How many trades per month?
About 21 — almost every trading day: an order 10% of the range away is filled almost always.
Can I trade it together with Silver Bullet?
Yes. Their trades are almost unrelated (monthly correlation near zero), and together the drawdown is smaller than with Silver Bullet alone.
Conclusion
- The book versions of Larry Williams’ strategies on daily charts (breakout from the daily open, Oops!, Smash Day, Outside Day, the 3-bar system, %R) give zero or a loss on today’s markets.
- The working version is the volatility breakout from the 9:30 New York open on NAS100 (16:30 GMT+2 in winter / GMT+3 in summer): stop orders ±10% of yesterday’s range, a stop of 0.5 range, a 3R target or a 16:00 exit.
- +280R on 4,016 trades, 45% winners, 15 of 17 years in profit, 2024 +40R, 2025 +23R, 2026 +14R. All 18 neighbouring settings are profitable, with a 3× spread +109R.
- Both buys and sells work; a random entry on the same days makes zero — the edge is in the breakout.
- It hardly overlaps with Silver Bullet — the two can be traded together.
Before trading a live account, test the strategy on a demo and keep your own trade journal, like the one in this article.
Other strategies we have backtested
This article is for educational purposes only and is not investment advice. Trading forex and CFDs carries a high risk of losing money. Past results do not guarantee future profits. Data: 1-minute NAS100 (CFD) quotes from histdata.com, November 2010 — October 2026, converted to New York time; classic strategies — 19 markets, 2005–2026; entries, stops and targets were checked on 1-minute bars, an entry and a stop in the same minute counted as a loss; the spread is deducted from every trade, real execution may differ.
 Point your phone camera here