Contents 22
- What is a Pin Bar
- Anatomy of a pin
- Why they form
- How to trade: a trading strategy
- Trading mistakes
- Summary of the classic pin bar theory
- 2026 update · Pin Bar: a new test on 46 markets — 16 variants and a working strategy
- Pin Bar: exact rules for the test
- How we tested
- Why a «plain Pin Bar» does not work
- Comparison of all 16 variants on H1, H4 and D1
- Main strategy: Pin Bar + liquidity sweep + FVG + change of structure (H4)
- Results of the main strategy for 2024–2026
- More trades: two more types of liquidity
- And how was it before? (for reference)
- Robustness check
- All trades of 2024–2026 with charts
- How much to risk per trade
- Common mistakes
- Questions and answers
- Conclusion
- Other strategies we have backtested
The Pin Bar (the «Pinocchio bar») is one of the best-known Price Action candlestick patterns: a candle with a small body and a long wick that «pierced» the market and came back. Almost every trading book recommends it. But does the Pin Bar work on its own — on the markets and in the years we are trading right now?
We checked it with a program. Pin Bars were detected strictly by rules on 46 markets — 28 currency pairs, gold and silver, indices, oil and 12 cryptocurrencies — on three timeframes: H1, H4 and D1. The main test period is 2024–2026: today’s market. We also calculated the long history from 1999, but only for reference. In total we tested 16 variants: from a «plain Pin Bar» to a Pin Bar with a liquidity sweep, FVG and a change of structure.
❗ What is R — read this before the numbers
R is the size of the stop in a trade. 1R = the distance from entry to stop loss. If the stop is hit, the trade made −1R. If price moved three stops in our favor — +3R.
In pips: on the H4 chart the stop behind a Pin Bar on currency pairs averages about 100 pips, so 1R ≈ 100 pips and the 3R target ≈ 300 pips. On GBPUSD 1R ≈ 90–150 pips, on USDJPY ≈ 120–300, on gold ≈ 25–35 dollars.
In money: if you risk 0.5% of your deposit per trade, then 1R = 0.5% of the deposit, and +3R = +1.5%.
We count in R because every trade has its own stop: R lets us fairly add up trades on different markets. The result of the main strategy for 2024–2026 is +24.7R; on currency pairs alone that is +3 080 pips.
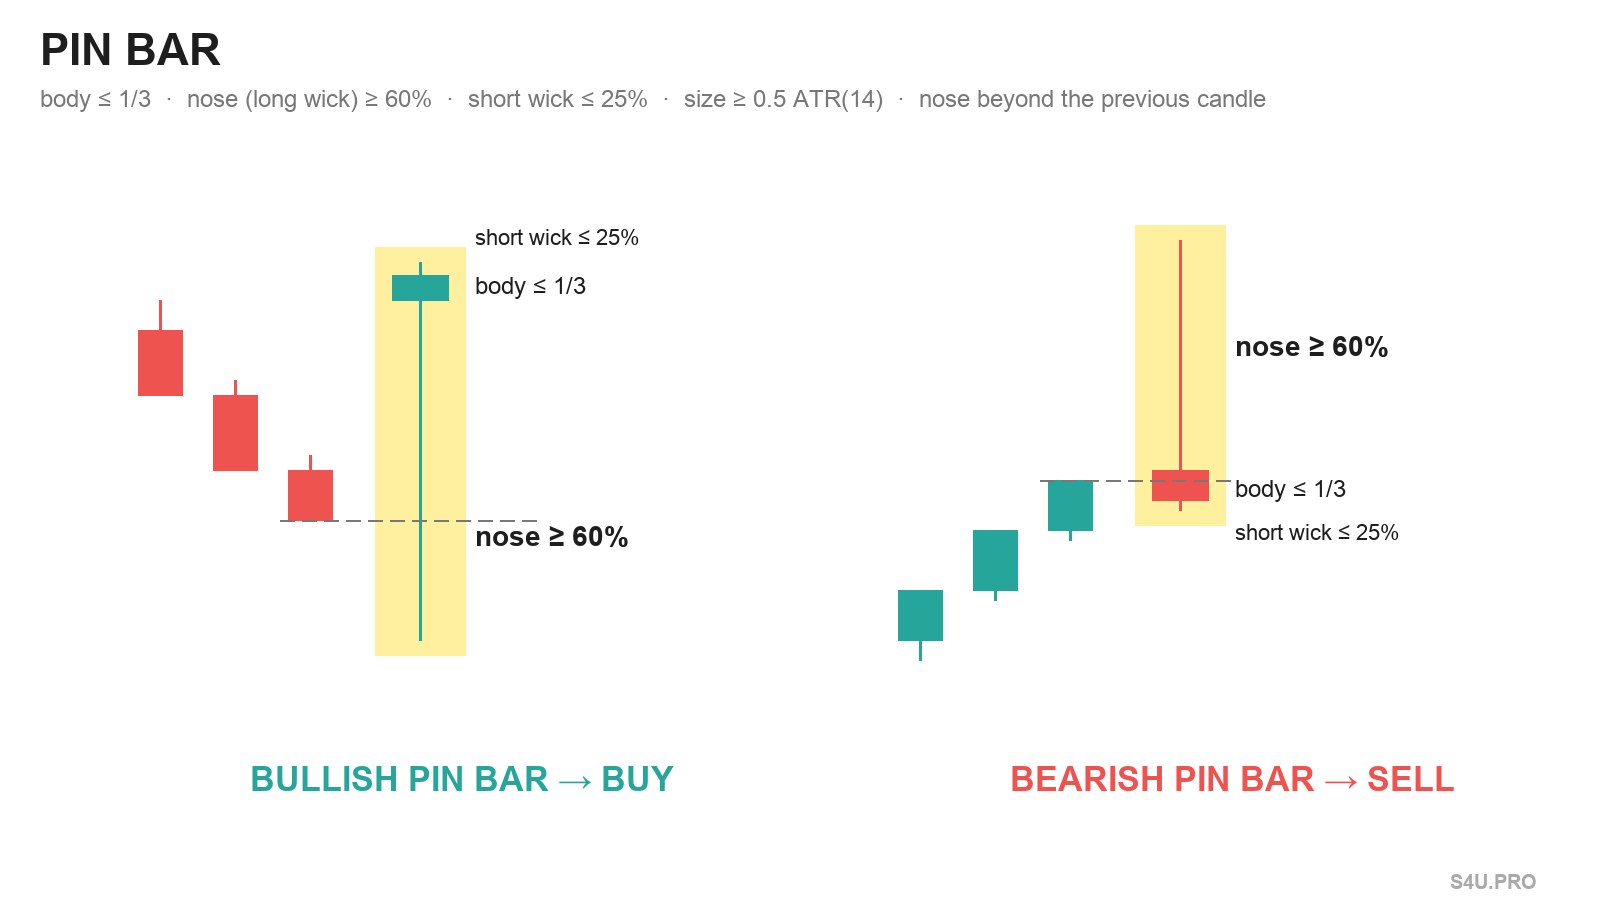
 The Pin Bar is a trading concept without which stock market participants cannot tell that a highly effective signal to enter against the trend has formed. This pattern belongs to the Price Action method.
What is a Pin Bar
In trading there are many schemes and models that show where price and demand will go next and how a trade may end, and the Pin candle is one of these patterns. It is also called the «Royal candle», the «Emperor of Price Action setups» or the «Pinocchio bar», which reflects its characteristics well.
 You can recognize the candle by its appearance:
- a small body;
- a short nose;
- a long tail-wick.
The Royal bar is a reversal pattern made of 1 candle. It has a large trading range and, in contrast, a small difference between the open and the close of the candle. You can also spot the pattern by its long wick pointing against the trend.
Where Pin Bars form
The candle forms on the chart at the place where, during the time between the open and the close, price rose and then sharply reversed and went in the opposite direction. Experienced traders note that the longer the Pin Bar’s wick, the higher the probability of not making money on the trade.

Pin candles form both at the top and at the bottom of charts. Their wick can point either up or down from the body.
Similarity to candlestick patterns
 Beginners may confuse this candle with a pin because the pattern is similar to bars such as the Hammer, the Shooting Star and the Inverted Hammer. The first model, for example, can be distinguished by its shorter nose, while the Shooting Star’s body visually looks like a regular square and may have no lower wick. The Inverted Hammer is preceded by a long candle, which is what distinguishes it from the Shooting Star.
Several factors distinguish pins from these candles. First, they remain effective on small timeframes. Second, the body of a pin candle is 2–3 times smaller than its wick. Third, the move is sharp, with a tendency to return to where it started.
 You can also find the candle of this reversal pattern in the «Tweezers» model. In this case the setup indicates that the trader can enter a trade and hold positions already within the new market structure.
Anatomy of a pin
A pin candle consists of a tail, a body and a nose. Each of these parts has its own meaning. For example, the length of the tail-wick shows whether a false breakout of a level or a pullback happened. Because of the false breakout this pattern is called the Pinocchio bar.
The tail wick of the emperor setup should be about 70–75% of the total length of the candle or more. At the same time, the body itself takes up 25–30% of the candle on the chart, no more. In addition, the wick should be longer than all the nearby wicks of other candles.

Pin Bars (their bodies) can be red or green, and this depends on the price. If the closing price was lower than the opening price, the body is red, and if higher — green. The pattern’s body can be small or absent, and this also depends on the open and close prices.
A Pin Bar indicator lets you find them on the chart. The most common ones are:
1) PinBar (you can download it in an archive for the MT4 trading terminal).

2) MTF PinBar Scan (also in an archive for MetaTrader 4).

3) Pinbar-detector — likewise in an archive for MT4.

The nose of the Royal bar is small and in most cases forms a few seconds before the candle closes.
Types
Despite the seemingly simple description, there are 4 types of pins:
 Bullish with a long wick.
- Bullish with a short wick.
- Bearish with a long wick.
- Bearish with a short wick.

Bullish Pin Bars with a long wick are considered effective for a trader if they have a red / black body, and those with a short wick — a green / white one. The same applies to bearish candles. When entering the game, a trader should remember that the right body color will bring him profit.
How to use it in trading
Having figured out what a Pin Bar is, a beginner needs to understand how to use it. Those who are new to trading like to trade when a reversal pattern appears. There are several strategies for trading royal candles:

- aggressive, with entry at the open of the bar;
- aggressive, with entry after some time;
- conservative.
Specialists note that the choice of strategy should depend on the trader’s feelings and preferences, and it does not matter which model you use. It is an extra bonus if the pin’s tail breaks a Fibonacci line or a dynamic level. The ability to set a stop loss will also come in handy.
- An example strategy — Giancone for 5 minutes:
Method 1: aggressive
The aggressive way to enter a trade using the pin is to enter in the usual way and place a stop loss beyond the tail pointing up or down, at 50–60% of the candle’s range. The method is used when the trader did not manage to use the close of the previous Royal bar and the subsequent growth of the new candle.

Method 2: also aggressive
Method No. 2 is used in daily trading, since its range is limited. In this case you need to use pending stop orders.

You buy securities if price reaches the buy stop placed above the royal candle’s wick. You sell the assets if price reaches the sell stop point located below the Price Action emperor setup.
Method 3: conservative
The Pin Bar strategy called conservative consists of entering the stock market or the forex market on a small pullback. You should get into the trade between 38% and 55% of the pullback zone.

The scheme is designed for daily charts and a large pin. The pullback and reversal of this pattern can take from 12 hours to 14 days. In this case the risk between profit and loss increases, but the stop loss gets smaller.
Why they form
The Pin Bar pattern has several constant reasons for forming and appears when deferred interest comes into play. The signal depends on:
- sellers;
- buyers;
- demand.
Sellers can be both large and small market participants. They take control of the asset’s price and push it in the direction they need. The purpose of such manipulation does not matter here.

A Pin Bar that has appeared on your screen is also formed by the actions of buyers. In this case the players interested in buying the asset put pressure on the sellers and pushed price up or down according to their needs and interests.
The mechanics of the move
A bar in trading is a candle, and the mechanics of its movement depend on a combination of different factors. For example, price was rising, but then the interest of market players faded, they stopped buying, and price reversed and went down. Most traders who paid attention to this candle had their stop losses triggered, which was the very purpose of the reversal.

The setup appeared because, after price fell, other traders who had been expecting such a development put their assets up for sale. After such manipulations the bar ends up with a small body and a long wick tail.
What happens inside a pin
Emperor setups contain hidden processes without which a candle of this pattern cannot form. As an example, consider 60 seconds and 5 minutes from the life of an hourly bar.

In each of these time segments there can be a sharp price spike or a steady move in the opposite direction. The first case — when inside the candle there is a sharp price spike followed shortly by a confident pullback — happens on small time intervals and is more typical of 60 seconds than of 5 minutes.
On a five-minute interval a steady move in the opposite direction is more common. This behavior is typical when a V-shaped reversal is forming. In 60% of cases this event can happen because of news.

Less often the royal candle behaves abnormally. In this case a pin can transform into another similar signal. The new pin will differ from the previous one by a smaller body.
How to trade: a trading strategy
To trade using any reversal indicator for MT4, remember that you enter against the trend, i.e. toward the new direction that is forming. For a trade with this scheme to pay off, the Price Action emperor setup must have a small body and a long tail.
- Example — Battle of the Bands forex strategy:
You can also trade with this reversal signal by entering in the direction of the trend. In this case you can be confident in the profitability of the trade.
Free EA for MT4 / MT5 + trade journals Get it freeTrading mistakes
There are 3 common mistakes made by beginners who want to make money using reversal signals. They include:
- Interpreting every pin the same way.
- Spending too much time on the indicator.
- Expecting a market reversal after a pin appears.
It happens that beginner traders interpret all pins the same way. When working with signals, it is recommended to pay attention to the candles that preceded the emperor setup of Price Action, and to their wicks. For example, if a royal candle with a bearish body and a long tail appears on the chart, and before that the screen showed small bars, this is a hint that a trend reversal should be expected.

Beginner traders spend a lot of time searching for an indicator to enter a trade. In this case the trader risks missing good trading opportunities.
If you watch the behavior of a signal that goes against the trend, you may find that the trend continues.
Summary of the classic pin bar theory
For those who have understood the types of emperor setups and how they behave, this tool can bring good profit when trading the stock market and Forex. Both classic and abnormal signals work equally well. For the strategy to work, it is recommended not to forget about chart analysis and analysis of other data.
The good thing about this tool is that it can also be used in intraday trading. The signal is easy to use and is an effective candlestick pattern for beginner traders.
2026 update · Pin Bar: a new test on 46 markets — 16 variants and a working strategy
Above is the classic pin bar theory. Below is our 2024–2026 test: which variants work and which do not, the rules of the working strategy, every trade with charts and the Excel journal.
Pin Bar: exact rules for the test
Everyone understands «small body and long wick» in their own way. To make the test fair, we wrote the Pin Bar down in numbers — you can apply the same rules on your own chart:
- Body — no more than a third of the whole candle.
- Long wick (nose) — at least 60% of the candle. On a bullish pin it is at the bottom, on a bearish pin — at the top.
- Short wick on the other side — no more than 25% of the candle.
- The nose sticks out beyond the neighboring candle: the low of a bullish pin is below the low of the previous candle (for a bearish pin the high is above). This is the «false breakout» that gives the Pin Bar its name — the Pinocchio bar.
- Candle size — at least half of the average range (0.5 ATR 14). Tiny «pins» in a quiet market do not count.
The body color does not matter: a bullish pin can close as a red candle too — the main thing is the long wick at the bottom.
How we tested
- Markets (46): 28 currency pairs — 7 majors (EURUSD, GBPUSD, USDJPY, USDCAD, AUDUSD, USDCHF, NZDUSD) and 21 crosses; gold and silver; the NASDAQ 100, S&P 500 and DAX indices and Brent oil; 12 cryptocurrencies (BTC, ETH, SOL, XRP, BNB, LTC, ADA, DOGE, LINK, AVAX, DOT, TRX).
- Timeframes: H1, H4 and D1.
- Main period: January 2024 — November 2026. Results since 1999 are at the end of the article, for reference: the market 20 years ago was different.
- Spread is deducted from every trade: 1.5 pips on major pairs, 2.5 on crosses, 0.1% of the price on cryptocurrencies.
- No looking into the future: the signal is checked only on closed candles, entry is at the open of the next candle or with a pending order.
- If both the stop and the target are touched in the same candle, we count the stop. This is the worst case for us, but the numbers are not inflated.
- The stop is the same in all variants — behind the Pin Bar’s tail with a small buffer (0.1 ATR). The target is 3R. If neither the stop nor the target is hit within 30 candles, the trade is closed at market.
Why a «plain Pin Bar» does not work
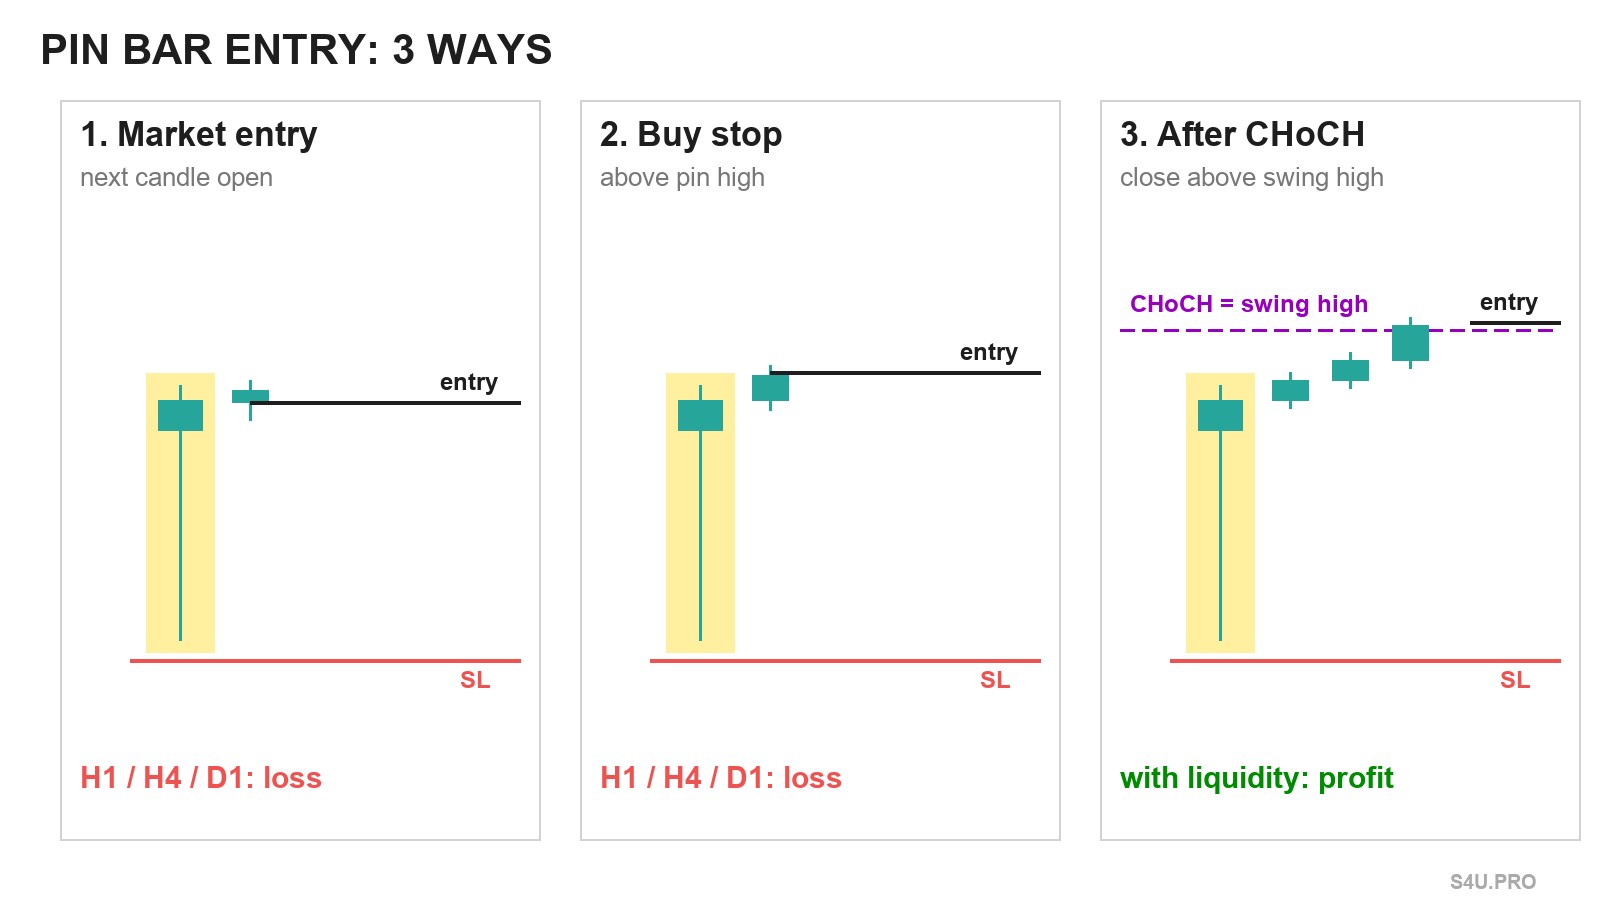
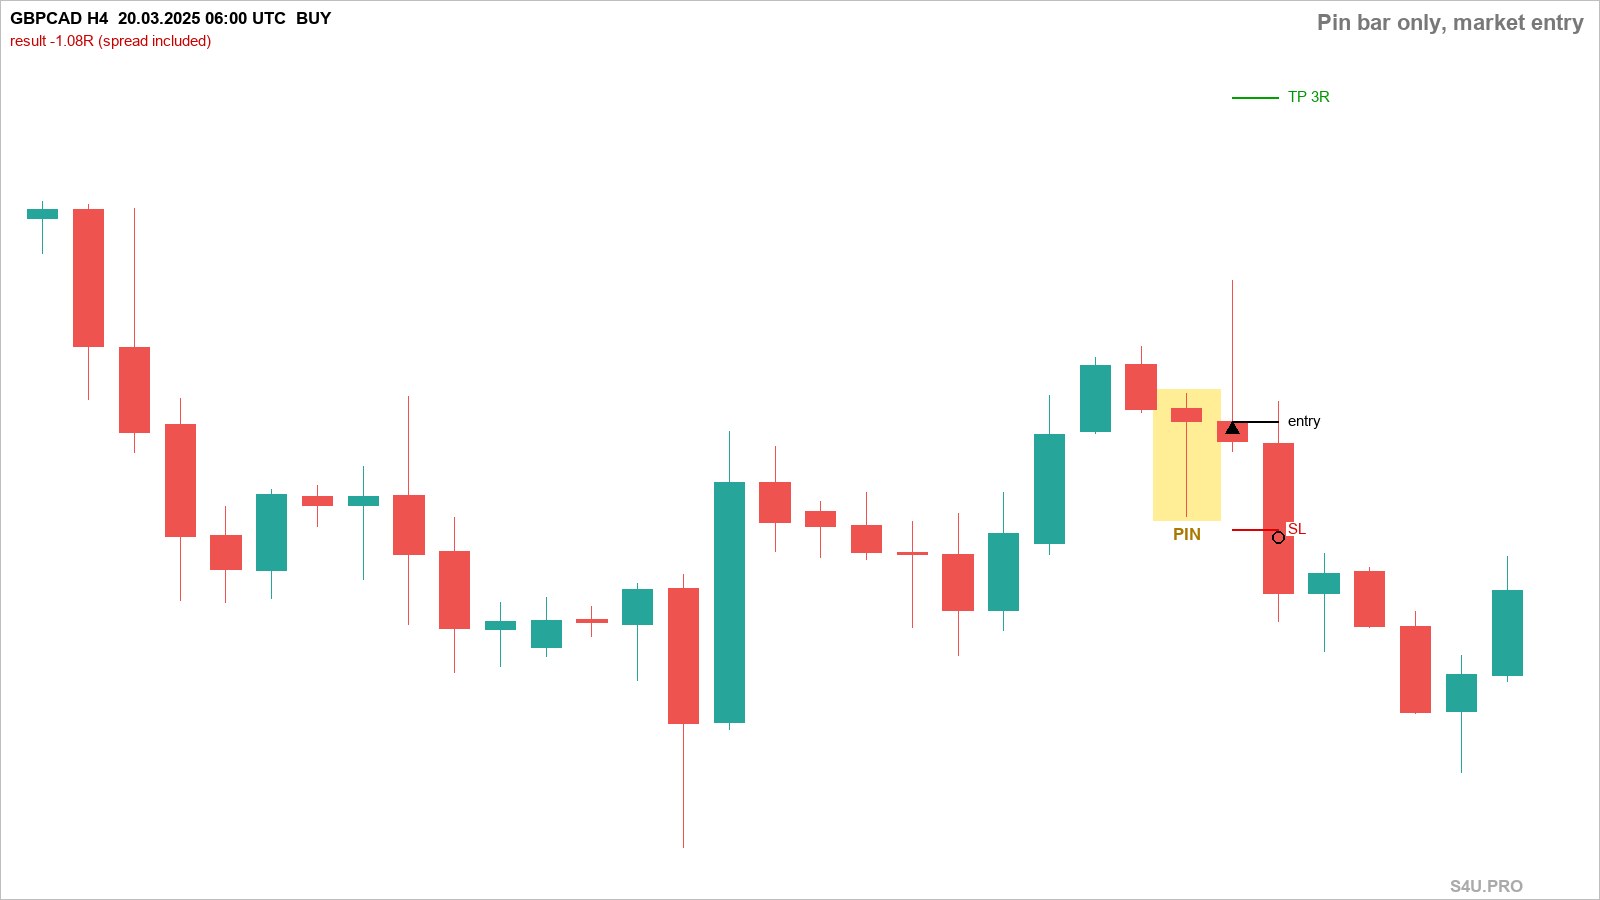
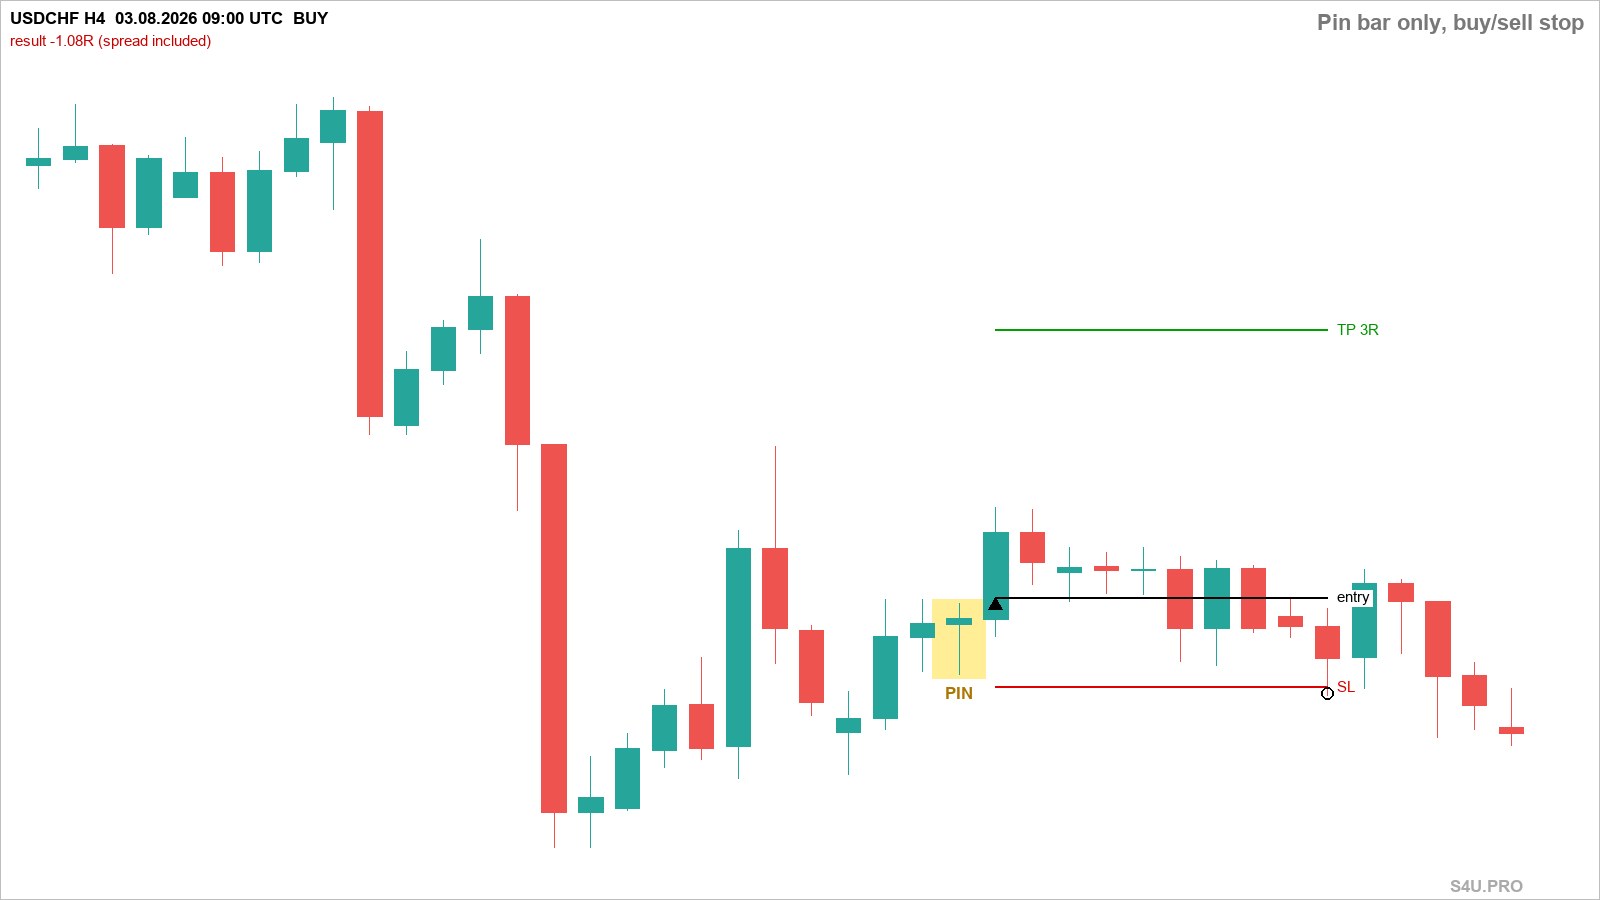
Let’s start with how the Pin Bar is traded most often: you see a pin — you open a trade. Or you place a stop order behind its extreme and wait for price to confirm the reversal. Both methods on 46 markets in 2024–2026 are in the red on all three timeframes. On H4, entering right after the pin gave −1,456R over 11,205 trades, a stop order behind the pin — −1,032R. Neither the EMA200 trend filter nor a «pin from a level» helps.
The reason is simple: there are too many Pin Bars, and most of them appear in random places — in the middle of a move, where there is nothing behind the long wick. The market does not reverse from every long wick. A Pin Bar needs a place: a level where other traders’ stops were sitting (liquidity), and confirmation that after those stops were taken, price really did reverse.
Comparison of all 16 variants on H1, H4 and D1
The table shows the result of each variant for 2024–2026 in R (number of trades in brackets). ❌ — loss, 🟡 — around zero or unstable by year, ✅ — we take it: profitable both overall and in every year.
| Variant | H1 | H4 | D1 |
|---|---|---|---|
| Plain Pin Bar, immediate entry | ❌ −14 184R (45 815) | ❌ −1 456R (11 205) | ❌ −129R (1 728) |
| Pin Bar, stop order entry behind the pin | ❌ −6 172R (33 629) | ❌ −1 032R (8 424) | ❌ −117R (1 276) |
| Pin Bar with EMA200 trend, stop order | ❌ −3 952R (20 688) | ❌ −829R (5 001) | ❌ −74R (805) |
| Pin Bar from a level | ❌ −5 708R (23 020) | ❌ −811R (5 588) | ❌ −69R (872) |
| Pin swept the day’s low/high | ❌ −1 510R (7 491) | ❌ −485R (4 275) | ❌ −101R (1 593) |
| Pin swept the week’s low/high | ❌ −271R (2 414) | ❌ −41R (1 299) | ❌ −101R (579) |
| Pin swept the 50-candle range boundary | ❌ −1 519R (9 772) | ❌ −174R (2 442) | ❌ −20R (307) |
| Pin swept a swing low/high | ❌ −1 819R (9 388) | ❌ −278R (2 251) | ❌ −66R (337) |
| Pin in an FVG zone | ❌ −7 684R (18 543) | ❌ −381R (4 661) | ❌ −3R (700) |
| Liquidity sweep + FVG, immediate entry | ❌ −274R (1 956) | 🟡 +24R (492) | ❌ −24R (81) |
| Pin + CHoCH (no liquidity) | ❌ −1 334R (13 581) | ❌ −229R (3 342) | ❌ −24R (492) |
| Day’s low/high + CHoCH | ❌ −67R (1 976) | ❌ −15R (1 181) | ❌ −22R (471) |
| FVG + CHoCH (no sweep) | ❌ −906R (6 826) | ❌ −137R (1 811) | ❌ −5R (259) |
| Week’s low/high + CHoCH | ❌ −18R (671) | ✅ +66R (335) | ❌ −6R (132) |
| 50-candle range + CHoCH | ❌ −81R (1 714) | ✅ +73R (423) | ❌ −9R (60) |
| Liquidity sweep + FVG + CHoCH | 🟡 +27R (622) | ✅ +25R (171) | 🟡 +2R (13) |
What the table shows:
- Liquidity alone is not enough. A pin that swept the day’s low, the week’s low, the range boundary or a swing low is still in the red with an immediate entry. Even sweep + FVG with an immediate entry on H4 is unstable: +41R in 2024 and −22R in 2025. Price needs time to reverse, and some pins simply get broken further.
- A change of structure alone is not enough either. Pin + change of structure without liquidity — a loss on all timeframes.
- The combination works: liquidity + change of structure. The pin swept an important level, and then price closed beyond the nearest high (for sells — low). Then H4 is profitable: +66R on the previous week’s low/high, +73R on the 50-candle range boundary and +25R on the sweep with FVG.
- H1 is in the red almost everywhere — many signals, small stops, the spread and noise eat the edge. The only exception is sweep + FVG + change of structure: +27R over 622 trades, but 2025 is around zero.
- D1 — too few signals in the working variants (13–132 trades over three years on 46 markets), and the result is around zero. For a Pin Bar with these rules the daily chart is not suitable.
Main strategy: Pin Bar + liquidity sweep + FVG + change of structure (H4)
This is the variant with the best ratio of profit to risk: the smallest drawdown, profitable in every year 2024–2026, and the most stable over the long history (more on that below). It uses three Smart Money concepts — briefly about each:
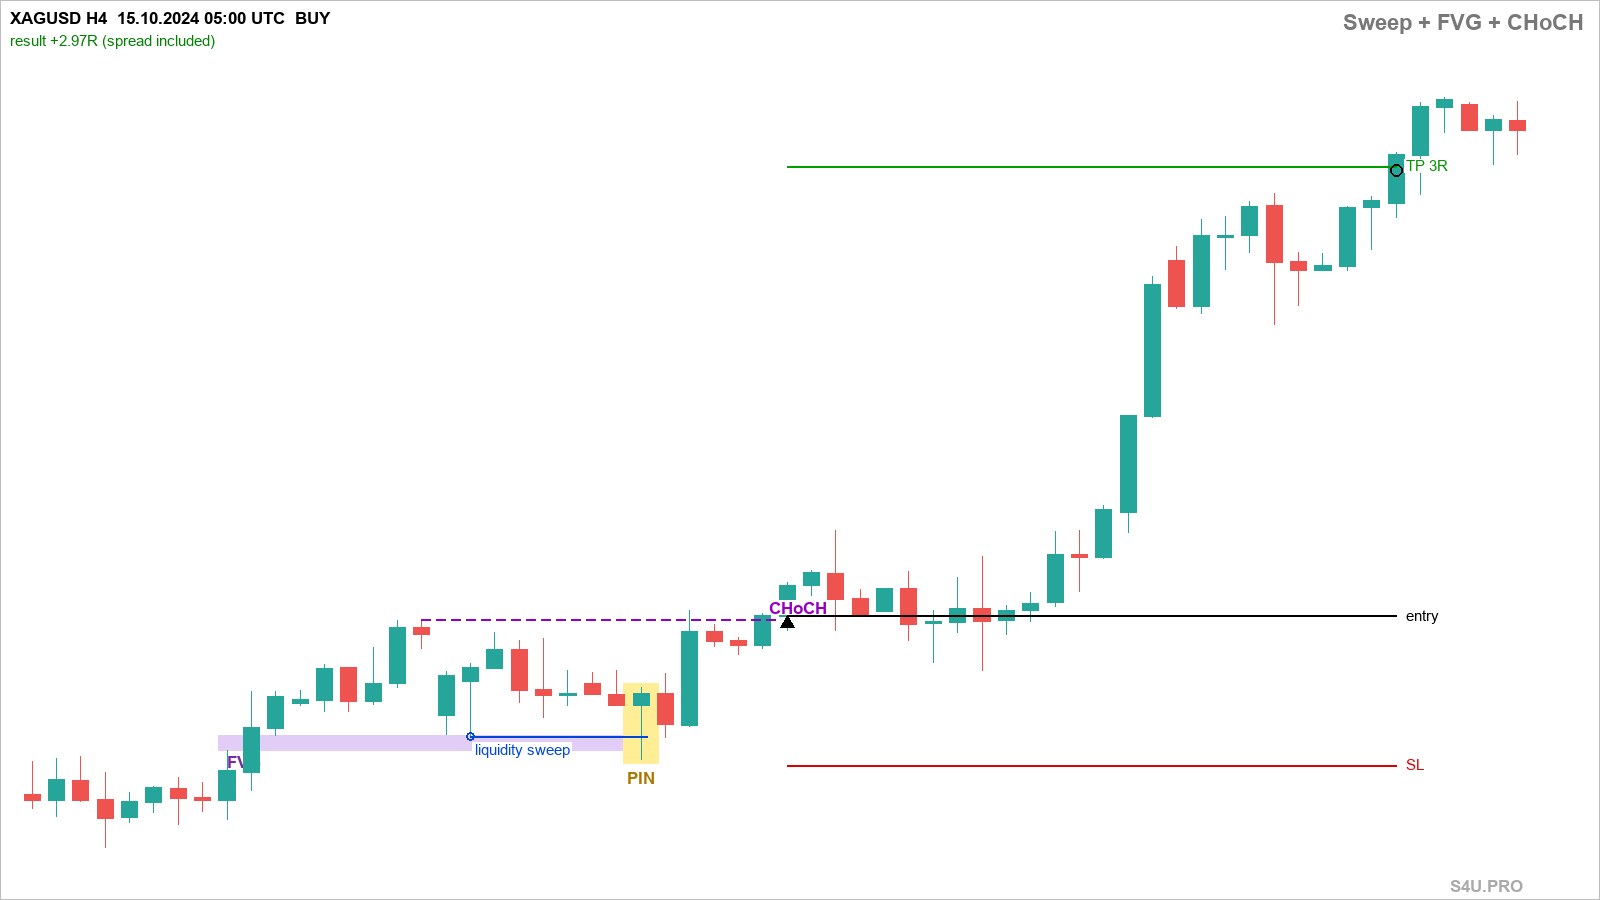
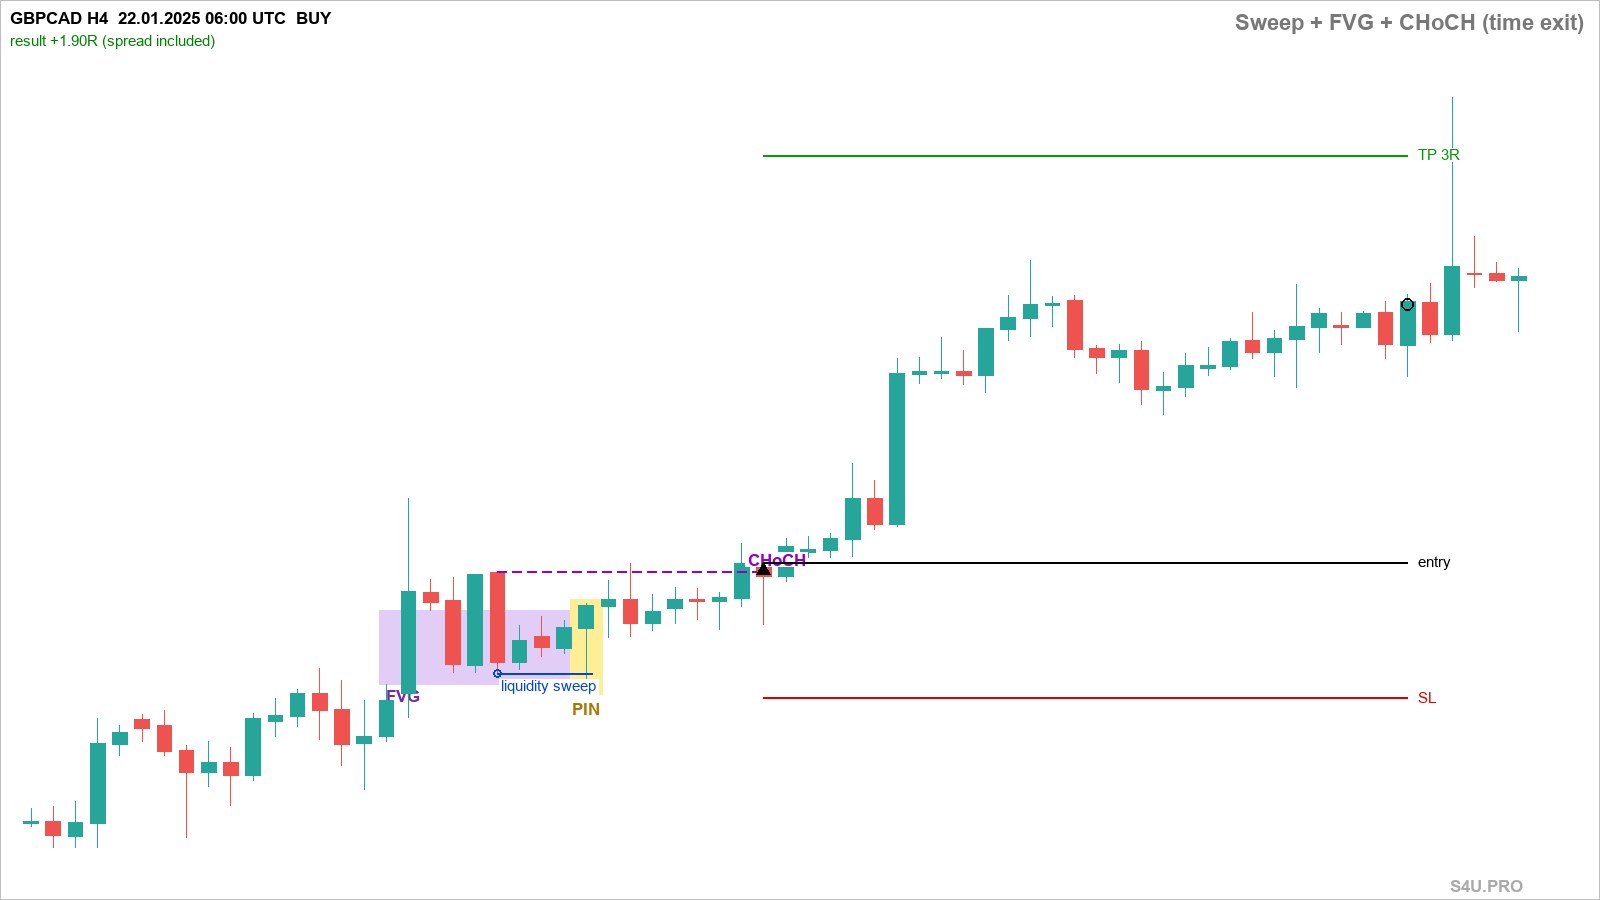
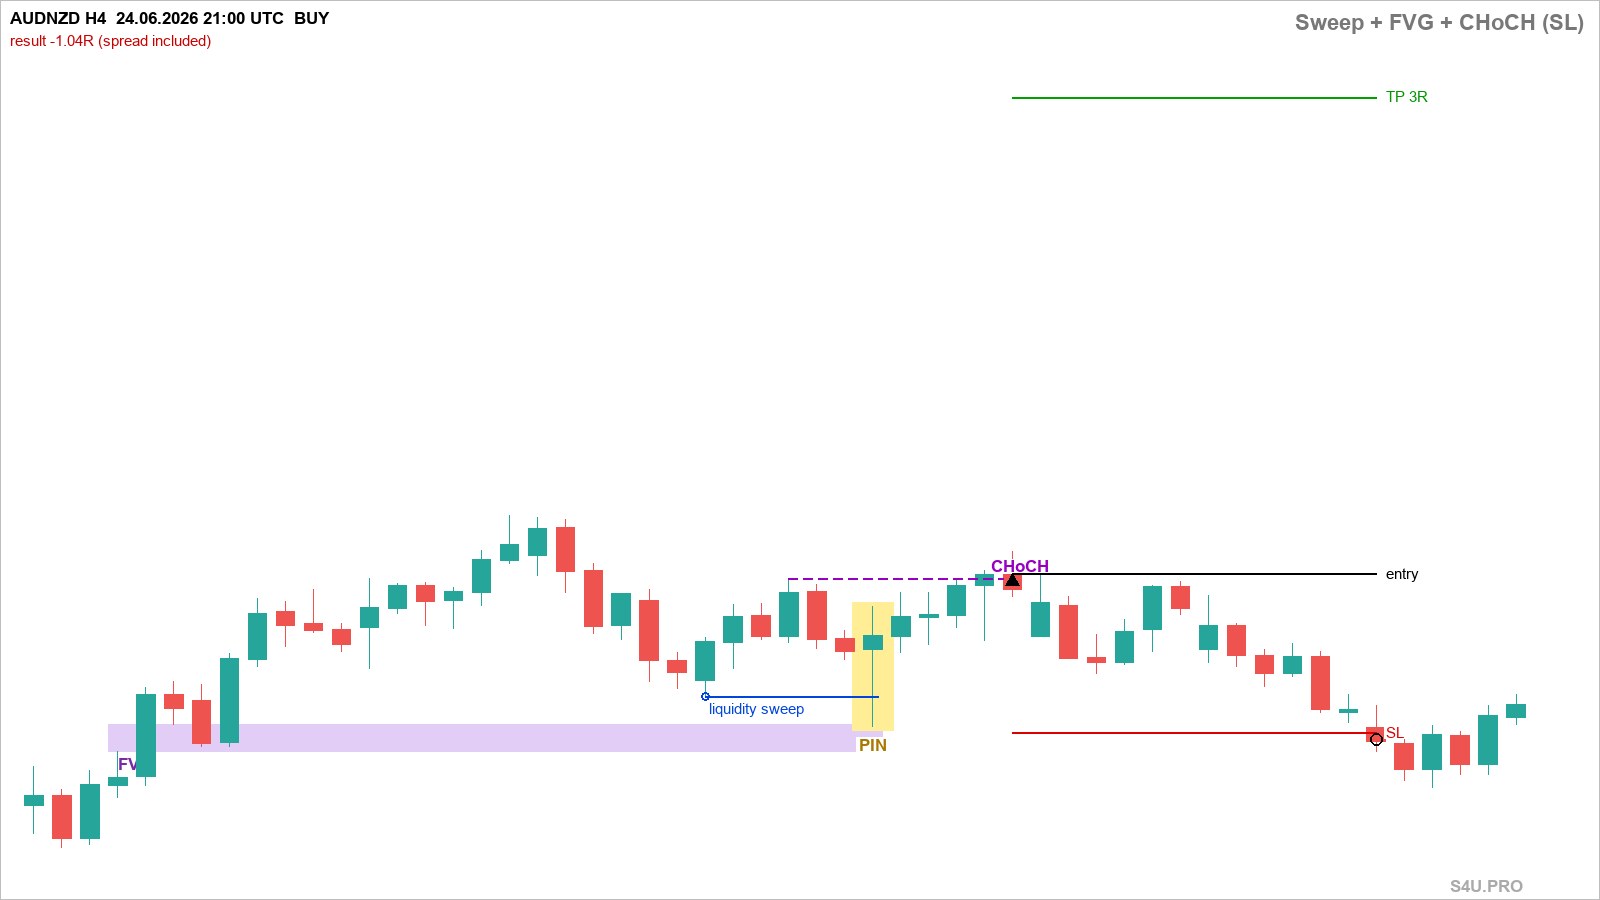
- Liquidity — the stops of other traders behind noticeable lows and highs. When the Pin Bar’s tail breaks such a low and the candle closes back, the stops have been collected — this is a liquidity sweep (Liquidity Sweep). In detail — in our article on Liquidity Sweep.
- FVG (Fair Value Gap) — a «gap» between three candles after a strong move: the low of the third candle is above the high of the first (for buys). Price often returns to this zone and bounces off it. In detail — in the article on FVG.
- Change of structure (CHoCH) — a candle close beyond the last swing high (for buys) or swing low (for sells). It is confirmation that the reversal has begun. In detail — in the article on BOS and CHoCH.
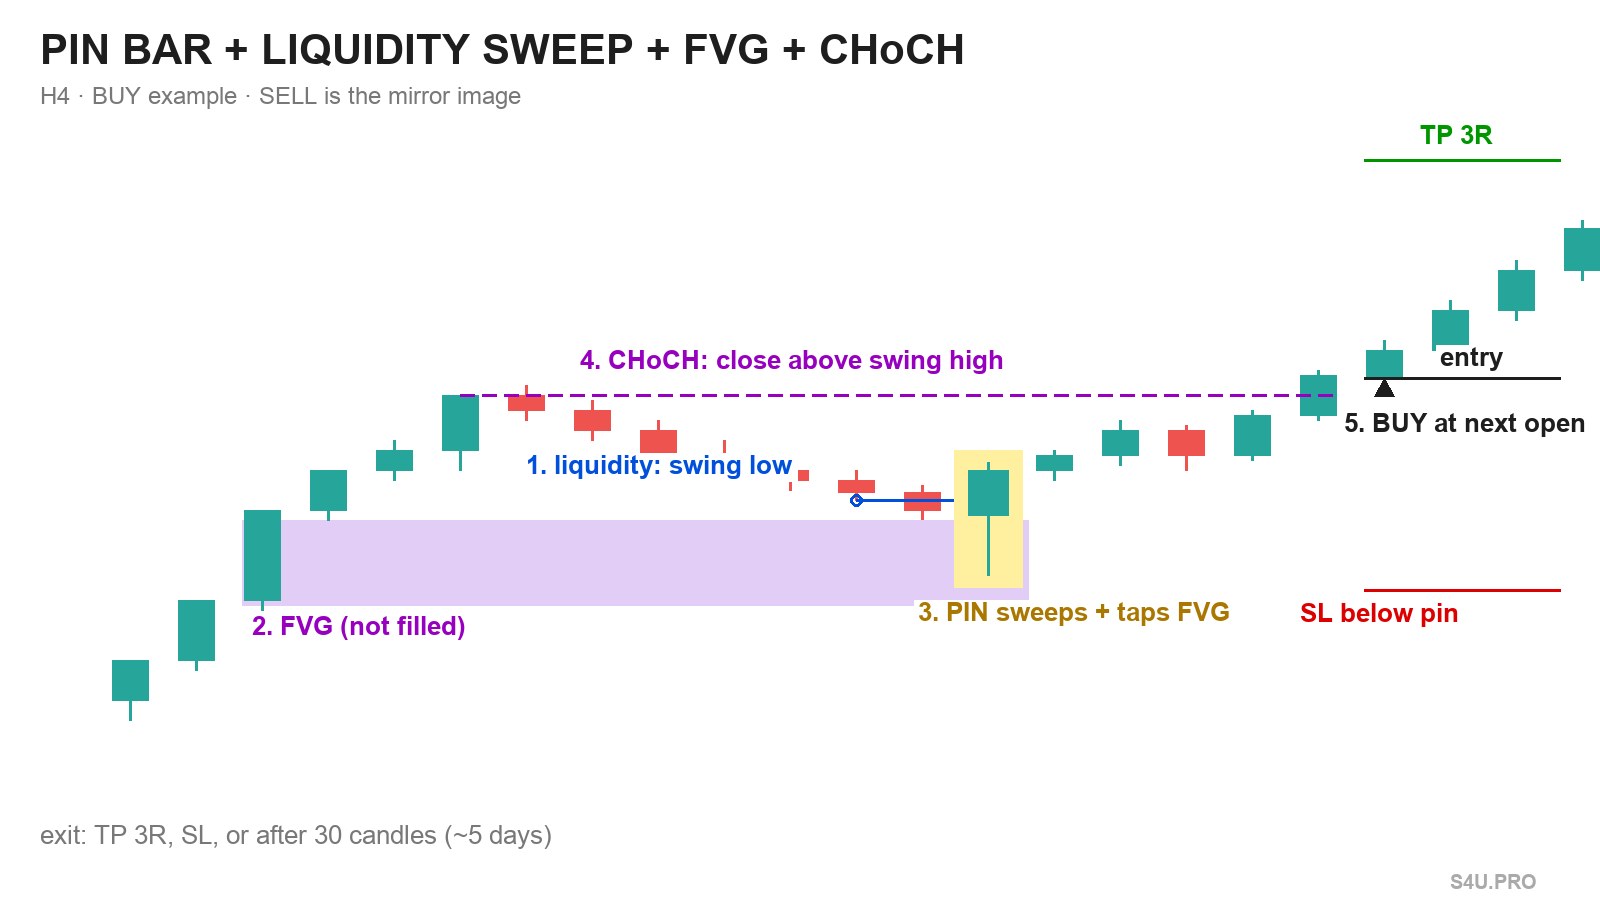
Rules (buy; sell is the mirror image):
- H4 chart. Mark swing lows — candles whose low is below the three candles to the left and the three to the right. A low that price has not yet broken is liquidity.
- Mark unfilled bullish FVGs over the last 30 candles: a candle’s low is above the high of the candle two bars earlier, and after that price never went below the lower boundary of the zone.
- A bullish Pin Bar appears by the rules above, and at the same time:
- its tail broke an unswept swing low (within the last 50 candles), and the candle closed above that low;
- the tail entered an unfilled FVG, and the close is above the lower boundary of the FVG.
- Find the nearest swing high before the pin (a high above the three candles to the left and right). This is the change-of-structure level.
- Wait up to 20 candles for some H4 candle to close above this high. If price reaches the stop first, the signal is cancelled.
- Entry — buy at the open of the next candle after the break.
- Stop loss — behind the pin’s tail minus 0.1 ATR. Target — 3R.
- If neither the stop nor the target is hit within 30 candles (about 5 trading days) — close the trade at market.
Time on the charts is UTC. With brokers whose terminal time is GMT+2/GMT+3, H4 candles start at 00:00, 04:00, 08:00 and so on in terminal time — the rules do not change because of this.
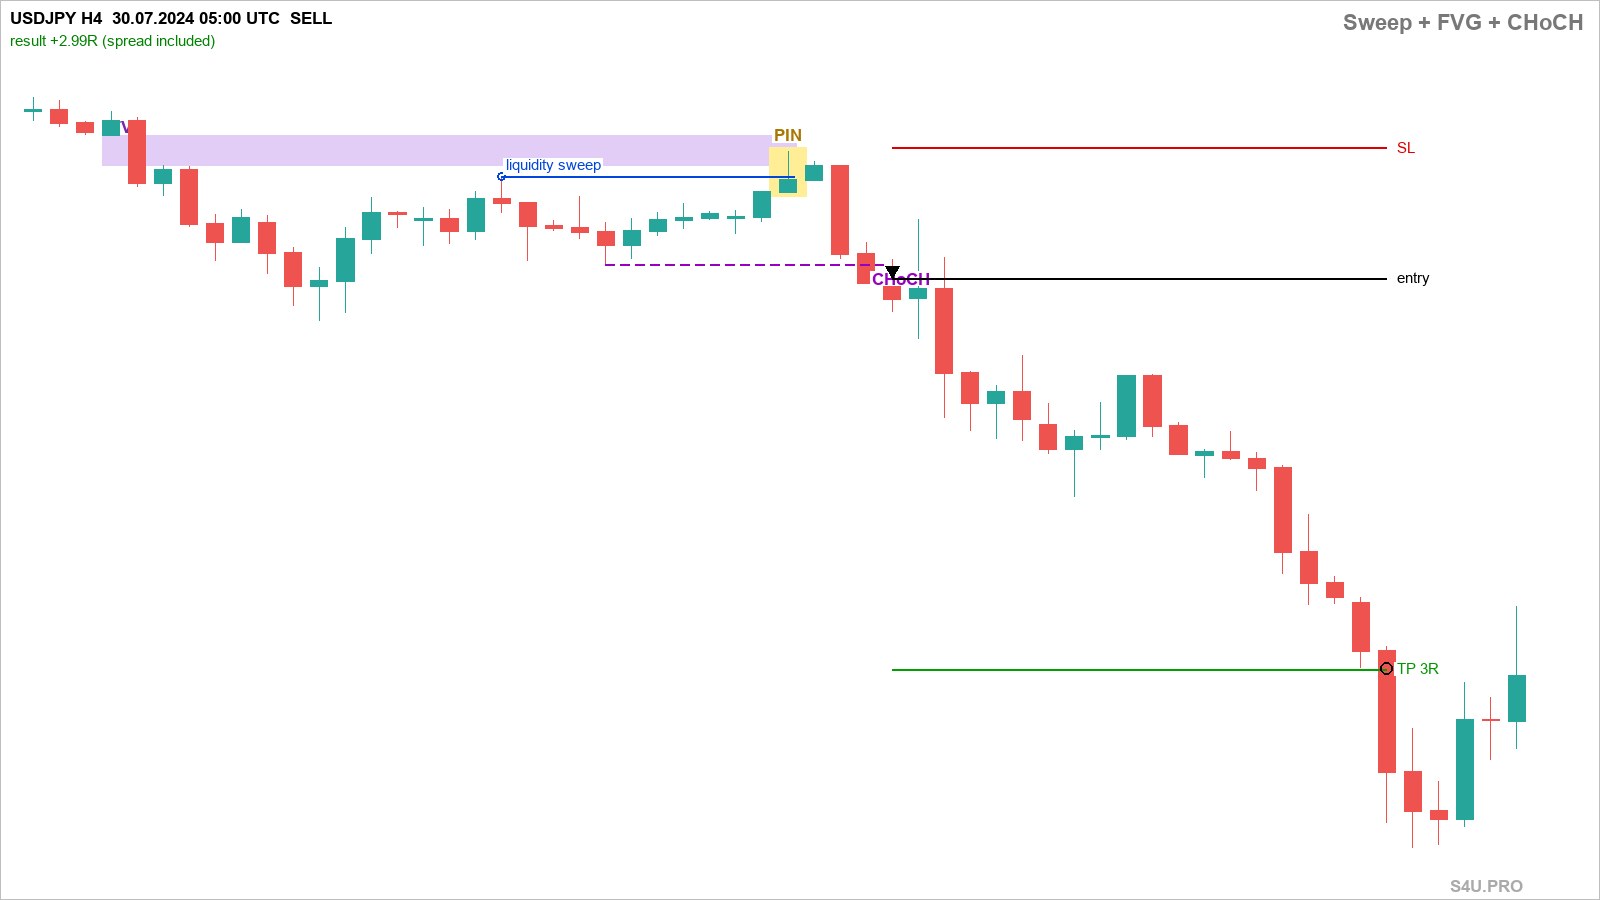
Below are four real trades of this strategy from 2024–2026: two hit the target, one was closed by time and one by the stop. The chart marks the swing low swept by the pin (liquidity sweep), the FVG zone, the change-of-structure level (CHoCH), entry, stop and target.
Results of the main strategy for 2024–2026
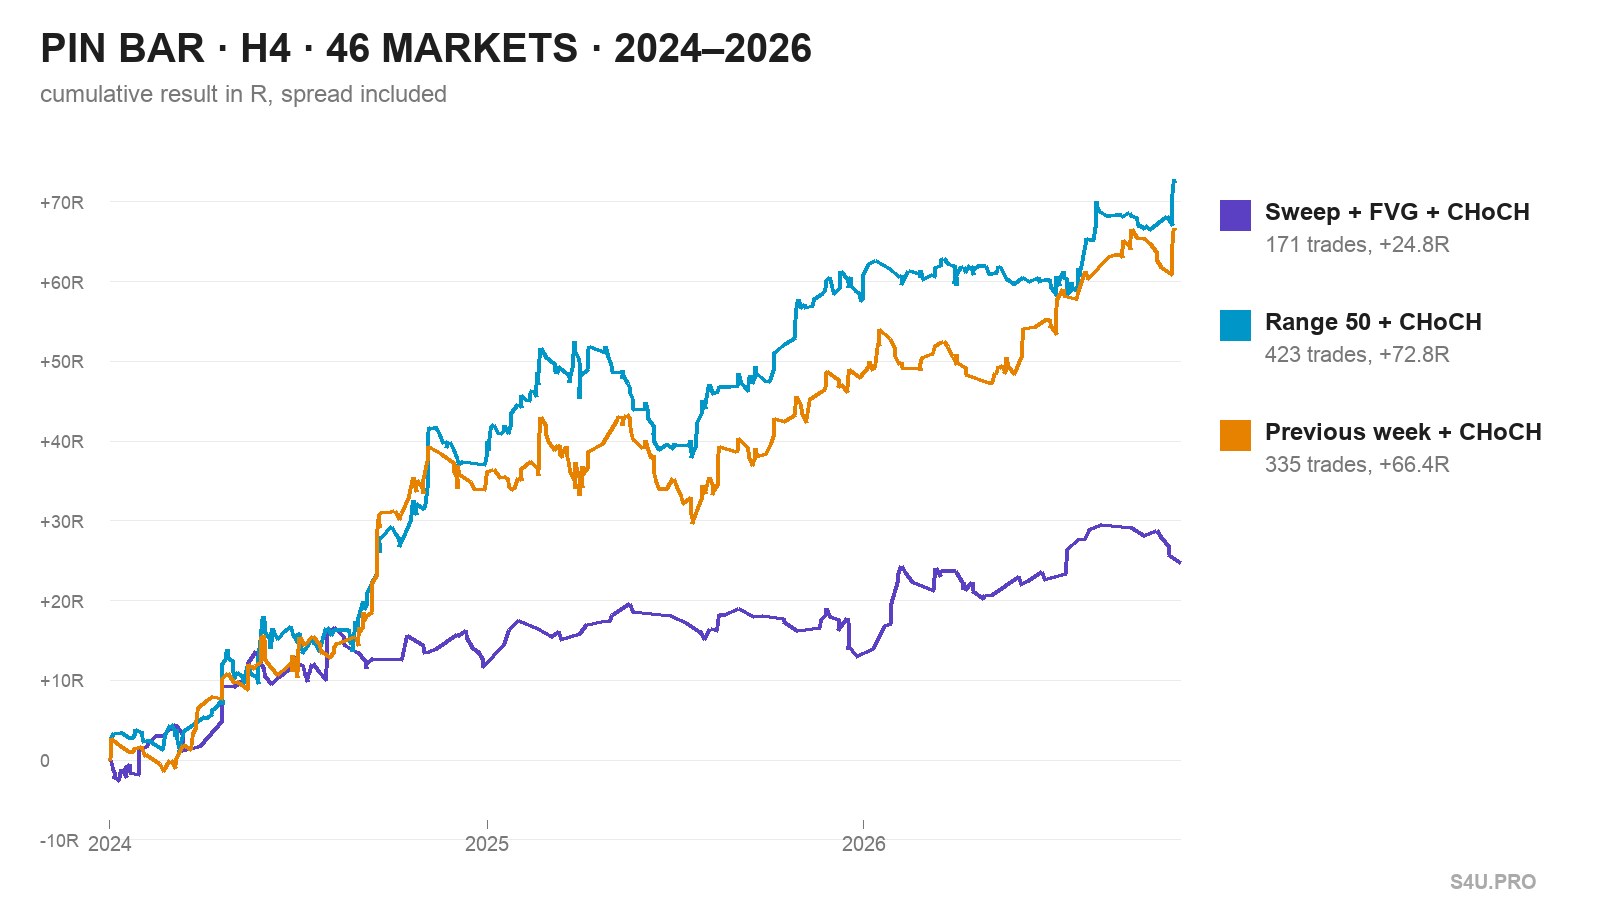
- Trades: 171 on 45 markets from January 2024 to November 2026.
- Result: +24.7R, on average +0.145R per trade, profit factor 1.37.
- By year: 2024 — +11.6R, 2025 — +1.4R, 2026 — +11.7R. Profitable every year, but 2025 is around zero.
- Winning trades — 50%. 10 trades reached the 3R target, 54 closed at the stop, 107 closed by time (after 30 candles), and of those 75 closed in profit, +0.47R on average. In other words, the strategy earns not from rare «three stops» but from the fact that after the sweep and the break price calmly moves in our direction.
- Maximum drawdown: −6.6R, the longest losing streak — 5 trades in a row.
- Average trade duration — about 3.8 days.
- Buys: 98 trades, +10.7R. Sells: 73 trades, +14.0R. Both sides work, no trend filter is needed.
- By market group: currency pairs +23.5R (87 trades), gold and silver +3.3R (5), indices and oil +0.1R (22), cryptocurrencies −2.2R (57). The strategy works best on currency pairs, on cryptocurrencies it is around zero.
More trades: two more types of liquidity
The main strategy has one downside — few trades: 171 in three years on 46 markets, about 5 per month. On one market — 1–2 trades per year. To get more trades, you can add two simpler variants to it. They have no FVG, and liquidity is simply a noticeable level:
- 50-candle range boundary. The Pin Bar’s tail broke the lowest low (for sells — the highest high) of the last 50 H4 candles, and the candle closed back. Then — the same change of structure, entry, stop, 3R target and exit after 30 candles. For 2024–2026: 423 trades, +72.8R (2024 — +37R, 2025 — +24R, 2026 — +12R).
- Previous week’s low or high. The pin’s tail broke the low (high) of the previous trading week, and the close is back beyond it. Everything else is the same. For 2024–2026: 335 trades, +66.4R (2024 — +34R, 2025 — +14R, 2026 — +18R).
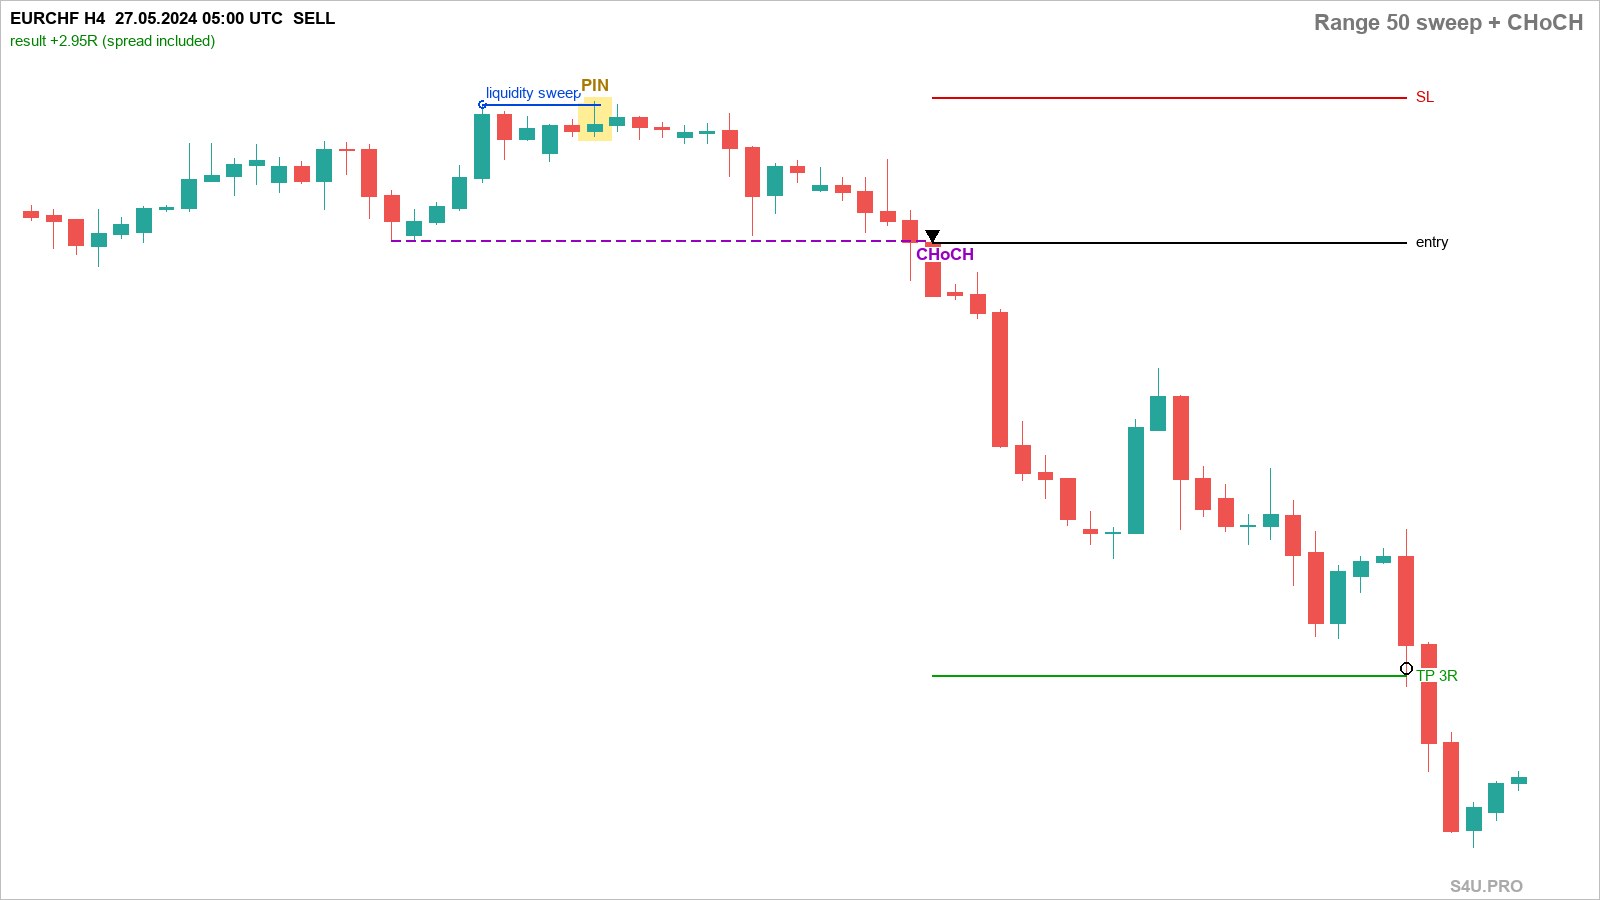
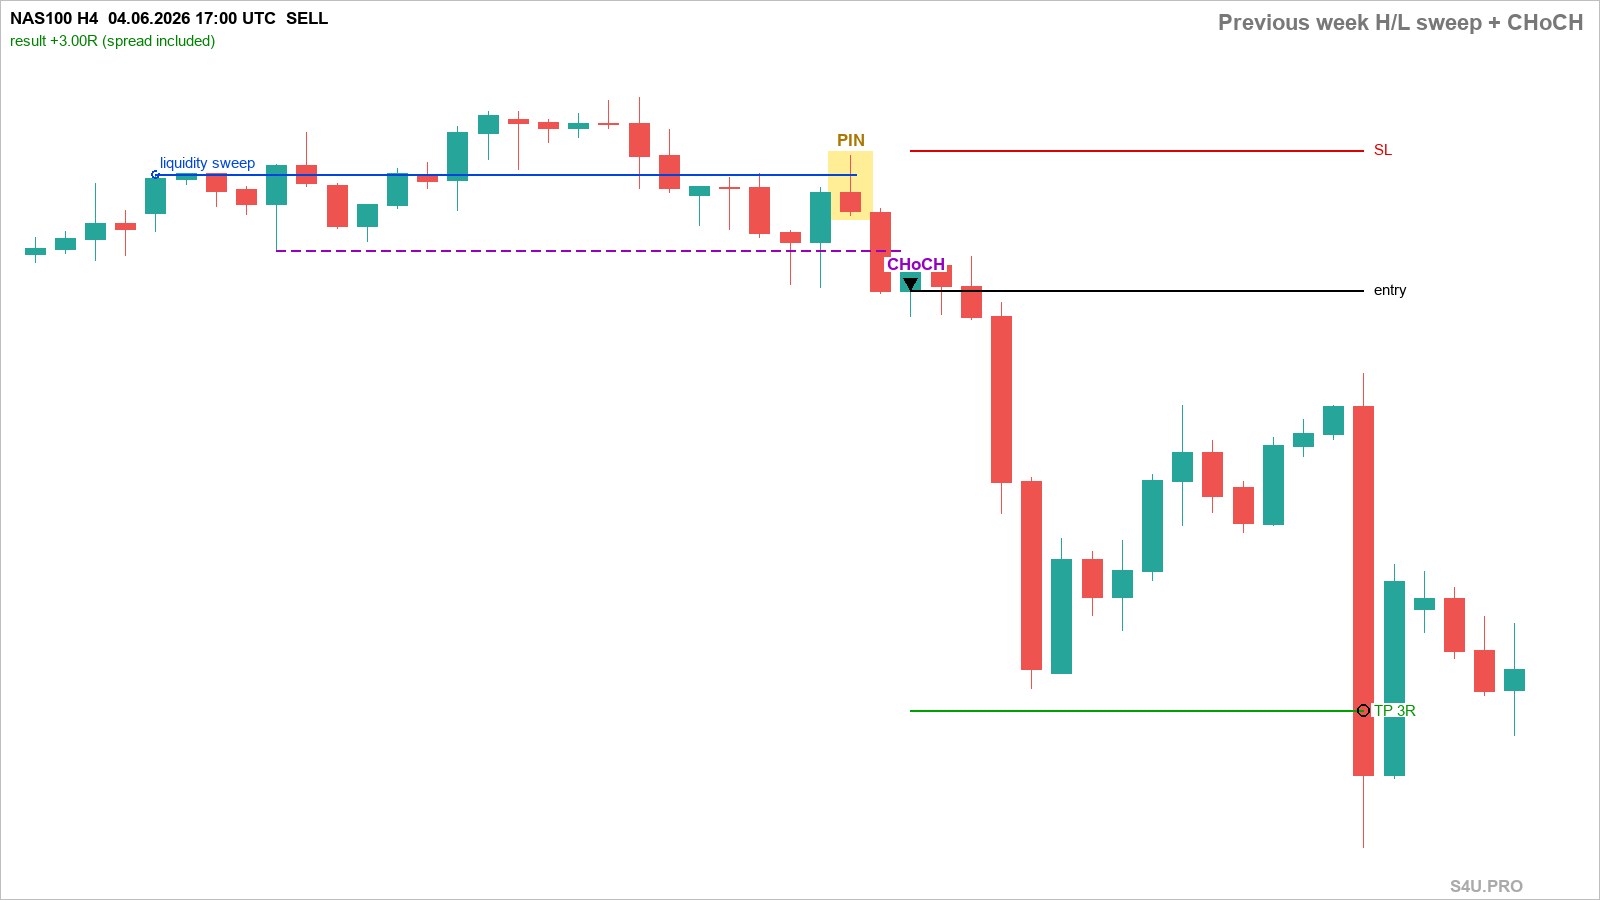
In 2024–2026 these two variants made even more profit than the main one. But their drawdown is noticeably larger, and over the long history they are weaker — see the section «And how was it before?». So we keep the FVG variant as the main one, and these two — as a way to get more signals.
How many trades you get (46 markets, H4, 2024–2026, without repeats of the same pin):
- the main strategy only — about 5 trades per month;
- all three variants on H4 together — 759 trades, +124.5R, about 22 trades per month;
- plus the main strategy on H1 — about 40 trades per month, +152R.
Conclusion: a Pin Bar with these rules is not «a trade every day on EURUSD», but rare signals on many markets. To trade regularly, keep 20–40 markets on your watchlist.
And how was it before? (for reference)
We calculated the three working variants on H4 over the entire history as well — since 1999. Important: until 2022 our database mostly contains the major currency pairs and gold, cryptocurrencies were added from 2017; crosses and indices — mostly from 2022–2024. So the older years mean fewer markets and fewer trades.
| Period | Sweep + FVG + CHoCH | Range 50 + CHoCH | Week + CHoCH |
|---|---|---|---|
| 1999–2009 | +15R (69) | +2R (145) | −15R (122) |
| 2010–2016 | 0R (50) | 0R (105) | 0R (88) |
| 2017–2020 | +12R (87) | +43R (126) | +8R (96) |
| 2021–2023 | −3R (101) | −39R (210) | −27R (173) |
| 2024–2026 | +25R (171) | +72R (422) | +66R (335) |
| Profitable years | 17 / 28 | 14 / 28 | 11 / 28 |
| Worst drawdown | −18R | −45R | −40R |
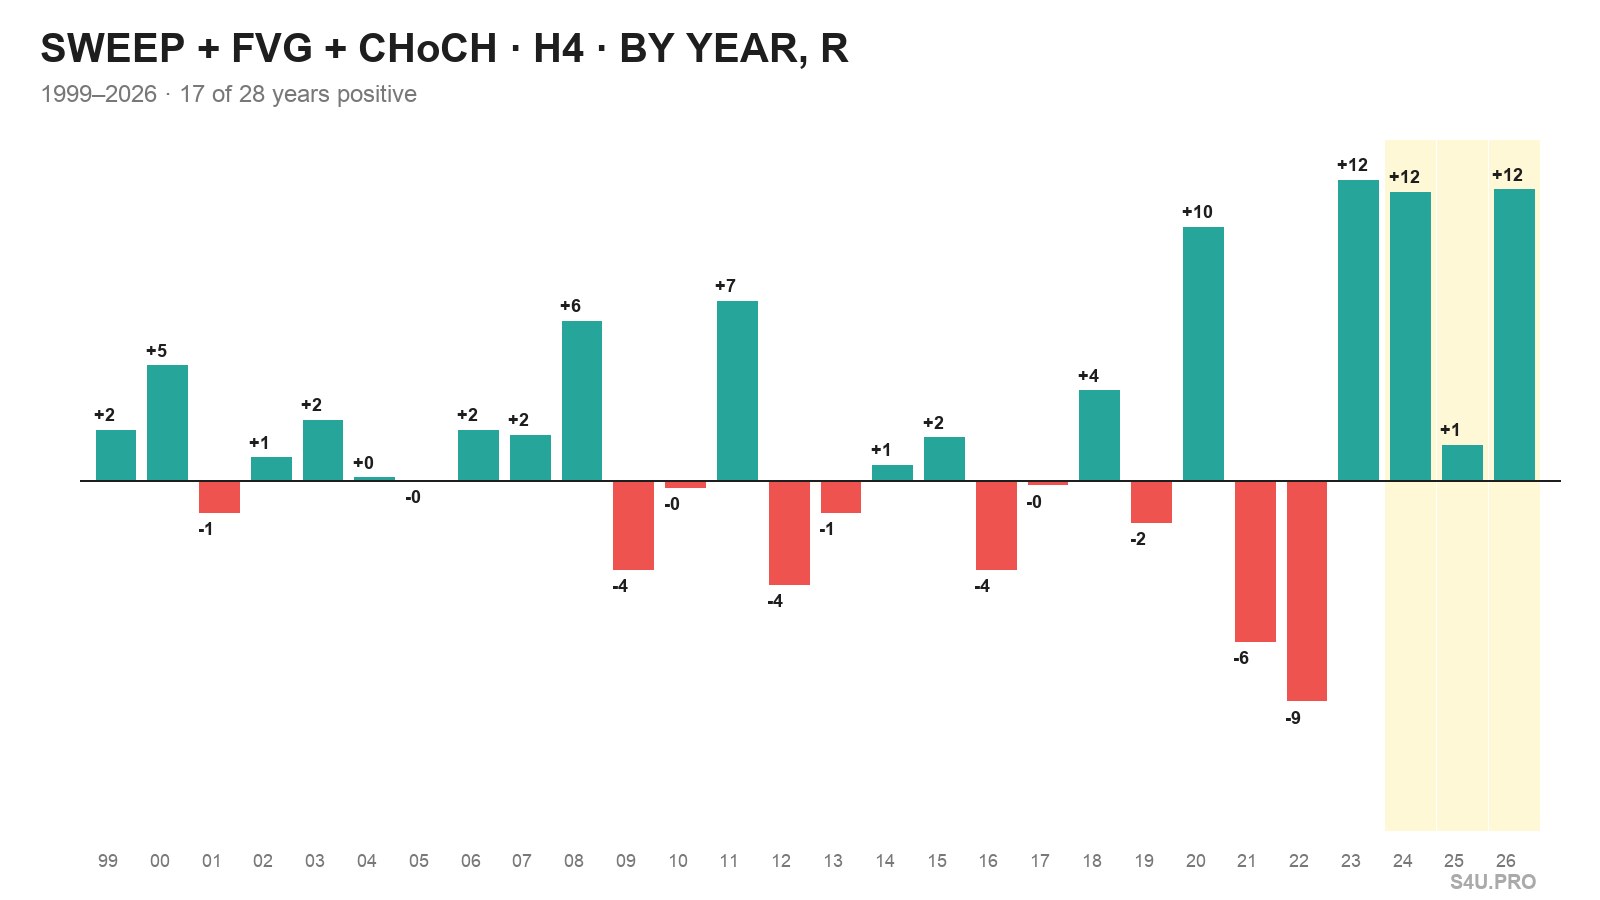
What this means:
- Sweep + FVG + change of structure is the most stable: over the whole history 478 trades, +48.7R, profitable in 17 years out of 28, drawdown only −18.5R. In 2021–2023 — around zero, but not a collapse.
- Range 50 and week work great in 2024–2026, but in 2021–2023 they had a serious drawdown (−39R and −27R). This is normal for liquidity strategies, but the risk on them should be kept small.
Robustness check
- Neighboring settings. We changed one rule of the main strategy at a time: pin size, body and nose size, target (2R–4R), breakeven, stop buffer, how long to wait for the break, the lookback for liquidity and FVG, the time exit. All 18 variants are profitable — from +9.8R to +30.3R. The result does not rest on one «lucky» number.
- Double spread. If the spread is twice as large, the result is +20.8R — the strategy does not live off a cheap spread.
- Minute quotes. We took another data source (minute quotes) for 17 markets — 16 currency pairs and gold — built H4 from them and checked every trade on the minute data: what was hit first — the stop or the target. The result is the same: 52 trades, +17.7R, profitable in 2024, 2025 and 2026.
All trades of 2024–2026 with charts
Below are all 171 trades of the main strategy for 2024–2026. Click any of them to open the chart: it marks the Pin Bar, the swept liquidity, the FVG, the change-of-structure level, entry, stop and target. The full journal of all 478 trades since 1999 is in Excel.
| # | Market | Side | Opened | Entry | Stop | Target | Closed | Result | Pips | R | Chart |
|---|---|---|---|---|---|---|---|---|---|---|---|
| 0478 | NZDJPY | SELL | 04.11.2026 02:00 | 88.319 | 89.123 | 85.906 | 04.11.2026 06:00 | SL | -83 | -1.03R | |
| 0477 | NZDCHF | BUY | 27.10.2026 02:00 | 0.47168 | 0.46463 | 0.49283 | 27.10.2026 22:00 | SL | -73 | -1.04R | |
| 0476 | GBPNZD | SELL | 23.10.2026 17:00 | 2.346 | 2.360 | 2.301 | 27.10.2026 22:00 | SL | -151 | -1.02R | |
| 0475 | BNBUSD | SELL | 18.10.2026 17:00 | 706.80 | 736.96 | 616.31 | 20.10.2026 09:00 | SL | — | -1.02R | |
| 0474 | BRENT | BUY | 12.10.2026 09:00 | 103.460 | 100.274 | 113.019 | 19.10.2026 05:00 | Time exit | — | +0.68R | |
| 0473 | GBPCHF | BUY | 30.09.2026 09:00 | 1.10510 | 1.10067 | 1.11840 | 01.10.2026 13:00 | SL | -47 | -1.06R | |
| 0472 | CADJPY | BUY | 18.09.2026 05:00 | 112.390 | 111.036 | 116.453 | 25.09.2026 01:00 | Time exit | -46 | -0.34R | |
| 0471 | EURJPY | BUY | 20.08.2026 01:00 | 184.904 | 183.891 | 187.942 | 26.08.2026 21:00 | Time exit | +61 | +0.60R | |
| 0470 | CHFJPY | BUY | 10.08.2026 05:00 | 195.686 | 194.150 | 200.29 | 17.08.2026 01:00 | Time exit | +33 | +0.21R | |
| 0469 | NZDJPY | BUY | 10.08.2026 05:00 | 93.207 | 92.398 | 95.635 | 17.08.2026 01:00 | Time exit | +78 | +0.97R | |
| 0468 | AUDUSD | BUY | 05.08.2026 17:00 | 0.70516 | 0.69813 | 0.72625 | 12.08.2026 13:00 | Time exit | +10 | +0.14R | |
| 0467 | EURCAD | BUY | 29.07.2026 21:00 | 1.60927 | 1.60212 | 1.63073 | 05.08.2026 17:00 | Time exit | +86 | +1.20R | |
| 0466 | DOTUSD | SELL | 19.07.2026 13:00 | 0.82500 | 0.87564 | 0.67309 | 24.07.2026 09:00 | Time exit | — | +0.50R | |
| 0465 | BRENT | BUY | 17.07.2026 13:00 | 85.250 | 82.660 | 93.019 | 23.07.2026 05:00 | TP 3R | — | +2.98R | |
| 0464 | AUDCAD | BUY | 03.07.2026 05:00 | 0.98274 | 0.97794 | 0.99713 | 10.07.2026 01:00 | Time exit | +14 | +0.29R | |
| 0463 | AUDNZD | BUY | 25.06.2026 17:00 | 1.22355 | 1.21755 | 1.24154 | 29.06.2026 21:00 | SL | -62 | -1.04R | |
| 0462 | XRPUSD | SELL | 23.06.2026 05:00 | 1.11290 | 1.16564 | 0.95467 | 28.06.2026 01:00 | Time exit | — | +1.15R | |
| 0461 | EURNZD | BUY | 10.06.2026 21:00 | 1.98856 | 1.97452 | 2.031 | 17.06.2026 17:00 | Time exit | +44 | +0.31R | |
| 0460 | GER40 | SELL | 05.06.2026 17:00 | 24719.40 | 25047.54 | 23734.99 | 12.06.2026 13:00 | Time exit | — | +0.24R | |
| 0459 | EURAUD | SELL | 02.06.2026 17:00 | 1.61972 | 1.62798 | 1.59494 | 03.06.2026 21:00 | SL | -85 | -1.03R | |
| 0458 | AVAXUSD | SELL | 02.06.2026 13:00 | 8.366 | 9.098 | 6.169 | 07.06.2026 09:00 | Time exit | — | +2.25R | |
| 0457 | CADCHF | SELL | 06.05.2026 21:00 | 0.57091 | 0.57653 | 0.55405 | 13.05.2026 17:00 | Time exit | +6 | +0.10R | |
| 0456 | EURAUD | SELL | 06.05.2026 01:00 | 1.62240 | 1.63760 | 1.57680 | 12.05.2026 21:00 | Time exit | +4 | +0.03R | |
| 0455 | EURGBP | SELL | 30.04.2026 13:00 | 0.86528 | 0.86780 | 0.85771 | 07.05.2026 09:00 | Time exit | +9 | +0.37R | |
| 0454 | GER40 | SELL | 29.04.2026 09:00 | 23932.90 | 24388.18 | 22567.06 | 03.05.2026 21:00 | SL | — | -1.00R | |
| 0453 | ETHUSD | BUY | 17.04.2026 13:00 | 2441.96 | 2281.12 | 2924.49 | 19.04.2026 17:00 | SL | — | -1.01R | |
| 0452 | BTCUSD | BUY | 17.04.2026 09:00 | 75589.70 | 73212.27 | 82721.98 | 22.04.2026 05:00 | Time exit | — | +1.11R | |
| 0451 | EURCAD | BUY | 14.04.2026 21:00 | 1.62326 | 1.61292 | 1.65427 | 16.04.2026 17:00 | SL | -106 | -1.02R | |
| 0450 | NAS100 | BUY | 08.04.2026 01:00 | 24935.00 | 23775.88 | 28412.36 | 14.04.2026 21:00 | Time exit | — | +0.82R | |
| 0449 | BNBUSD | BUY | 07.04.2026 21:00 | 620.11 | 591.53 | 705.84 | 11.04.2026 21:00 | SL | — | -1.02R | |
| 0448 | DOTUSD | SELL | 05.04.2026 17:00 | 1.22800 | 1.27212 | 1.09564 | 06.04.2026 01:00 | SL | — | -1.03R | |
| 0447 | BNBUSD | SELL | 02.04.2026 01:00 | 592.06 | 622.68 | 500.21 | 06.04.2026 21:00 | Time exit | — | -0.25R | |
| 0446 | ETHUSD | BUY | 31.03.2026 13:00 | 2054.85 | 2008.69 | 2193.32 | 05.04.2026 09:00 | Time exit | — | -0.07R | |
| 0445 | XAGUSD | SELL | 18.03.2026 18:00 | 77.004 | 82.752 | 59.759 | 25.03.2026 14:00 | Time exit | — | +0.80R | |
| 0444 | AUDNZD | BUY | 17.03.2026 06:00 | 1.21257 | 1.20485 | 1.23574 | 19.03.2026 18:00 | SL | -80 | -1.03R | |
| 0443 | USDJPY | BUY | 12.03.2026 06:00 | 159.104 | 157.215 | 164.772 | 19.03.2026 02:00 | Time exit | +59 | +0.31R | |
| 0442 | GBPCHF | BUY | 11.03.2026 18:00 | 1.04527 | 1.04175 | 1.05582 | 18.03.2026 14:00 | Time exit | +84 | +2.38R | |
| 0441 | ADAUSD | SELL | 09.03.2026 10:00 | 0.25500 | 0.26002 | 0.23995 | 09.03.2026 10:00 | SL | — | -1.05R | |
| 0440 | GER40 | SELL | 17.02.2026 06:00 | 24705.50 | 25036.11 | 23713.66 | 17.02.2026 18:00 | SL | — | -1.01R | |
| 0439 | TRXUSD | SELL | 11.02.2026 06:00 | 0.27500 | 0.28058 | 0.25826 | 13.02.2026 14:00 | SL | — | -1.05R | |
| 0438 | GBPAUD | SELL | 06.02.2026 10:00 | 1.94631 | 1.95931 | 1.90730 | 10.02.2026 10:00 | Time exit | +148 | +1.14R | |
| 0437 | AVAXUSD | SELL | 05.02.2026 06:00 | 9.510 | 10.373 | 6.922 | 10.02.2026 02:00 | Time exit | — | +0.79R | |
| 0436 | LTCUSD | SELL | 04.02.2026 14:00 | 58.180 | 61.563 | 48.032 | 05.02.2026 22:00 | TP 3R | — | +2.98R | |
| 0435 | EURNZD | SELL | 28.01.2026 18:00 | 1.97913 | 1.99842 | 1.92125 | 04.02.2026 14:00 | Time exit | +101 | +0.52R | |
| 0434 | EURGBP | SELL | 28.01.2026 18:00 | 0.86582 | 0.87158 | 0.84854 | 04.02.2026 14:00 | Time exit | +12 | +0.21R | |
| 0433 | EURAUD | SELL | 28.01.2026 14:00 | 1.70884 | 1.72379 | 1.66398 | 04.02.2026 10:00 | Time exit | +278 | +1.86R | |
| 0432 | USDCAD | SELL | 22.01.2026 14:00 | 1.38078 | 1.38465 | 1.36917 | 23.01.2026 18:00 | TP 3R | +115 | +2.96R | |
| 0431 | LTCUSD | SELL | 11.01.2026 22:00 | 78.790 | 82.531 | 67.568 | 16.01.2026 18:00 | Time exit | — | +0.93R | |
| 0430 | EURJPY | BUY | 26.12.2025 14:00 | 184.312 | 183.230 | 187.557 | 05.01.2026 06:00 | SL | -111 | -1.02R | |
| 0429 | GBPJPY | BUY | 26.12.2025 02:00 | 211.18 | 209.98 | 214.77 | 04.01.2026 22:00 | Time exit | -17 | -0.15R | |
| 0428 | BTCUSD | SELL | 18.12.2025 18:00 | 84483.80 | 90498.71 | 66439.07 | 22.12.2025 10:00 | SL | — | -1.01R | |
| 0427 | LTCUSD | SELL | 18.12.2025 06:00 | 75.350 | 81.194 | 57.819 | 23.12.2025 02:00 | Time exit | — | -0.26R | |
| 0426 | XRPUSD | SELL | 18.12.2025 06:00 | 1.84150 | 1.99105 | 1.39284 | 23.12.2025 02:00 | Time exit | — | -0.28R | |
| 0425 | DOTUSD | SELL | 17.12.2025 18:00 | 1.81700 | 1.95964 | 1.38909 | 22.12.2025 14:00 | Time exit | — | +0.33R | |
| 0424 | AVAXUSD | SELL | 17.12.2025 18:00 | 11.880 | 12.689 | 9.454 | 22.12.2025 14:00 | Time exit | — | -0.35R | |
| 0423 | LINKUSD | SELL | 17.12.2025 18:00 | 12.280 | 13.212 | 9.483 | 22.12.2025 14:00 | Time exit | — | -0.20R | |
| 0422 | DOGEUSD | SELL | 17.12.2025 18:00 | 0.12646 | 0.13659 | 0.09607 | 22.12.2025 14:00 | Time exit | — | -0.55R | |
| 0421 | ADAUSD | SELL | 17.12.2025 18:00 | 0.36880 | 0.40105 | 0.27205 | 22.12.2025 14:00 | Time exit | — | -0.00R | |
| 0420 | SOLUSD | SELL | 17.12.2025 18:00 | 122.390 | 134.304 | 86.648 | 22.12.2025 14:00 | Time exit | — | -0.20R | |
| 0419 | ETHUSD | SELL | 17.12.2025 18:00 | 2820.28 | 3037.35 | 2169.06 | 21.12.2025 22:00 | SL | — | -1.01R | |
| 0418 | EURCHF | SELL | 17.12.2025 14:00 | 0.93351 | 0.93684 | 0.92352 | 24.12.2025 10:00 | Time exit | +48 | +1.44R | |
| 0417 | BNBUSD | BUY | 07.12.2025 18:00 | 903.80 | 869.03 | 1008.12 | 10.12.2025 22:00 | SL | — | -1.03R | |
| 0416 | ETHUSD | BUY | 07.12.2025 18:00 | 3137.91 | 2901.88 | 3845.99 | 12.12.2025 14:00 | Time exit | — | -0.28R | |
| 0415 | BTCUSD | BUY | 07.12.2025 18:00 | 91425.51 | 87610.18 | 102871.49 | 12.12.2025 14:00 | Time exit | — | -0.35R | |
| 0414 | LINKUSD | SELL | 01.12.2025 02:00 | 12.150 | 13.578 | 7.867 | 02.12.2025 18:00 | SL | — | -1.01R | |
| 0413 | AUDCHF | BUY | 26.11.2025 02:00 | 0.52369 | 0.51934 | 0.53675 | 02.12.2025 22:00 | Time exit | +32 | +0.74R | |
| 0412 | AUDCAD | BUY | 26.11.2025 02:00 | 0.91424 | 0.90815 | 0.93252 | 02.12.2025 22:00 | Time exit | +36 | +0.58R | |
| 0411 | EURGBP | SELL | 21.11.2025 18:00 | 0.87834 | 0.88414 | 0.86094 | 28.11.2025 14:00 | Time exit | +16 | +0.27R | |
| 0410 | DOTUSD | SELL | 20.11.2025 18:00 | 2.554 | 2.828 | 1.73330 | 25.11.2025 14:00 | Time exit | — | +1.05R | |
| 0409 | EURNZD | SELL | 28.10.2025 18:00 | 2.015 | 2.023 | 1.99225 | 31.10.2025 06:00 | SL | -80 | -1.03R | |
| 0408 | ETHUSD | SELL | 16.10.2025 17:00 | 3867.14 | 4229.91 | 2778.84 | 21.10.2025 13:00 | Time exit | — | -0.37R | |
| 0407 | SOLUSD | SELL | 16.10.2025 13:00 | 187.610 | 209.64 | 121.515 | 21.10.2025 09:00 | Time exit | — | -0.40R | |
| 0406 | ADAUSD | SELL | 25.09.2025 01:00 | 0.80060 | 0.83213 | 0.70600 | 29.09.2025 21:00 | Time exit | — | +0.06R | |
| 0405 | DOGEUSD | BUY | 17.09.2025 17:00 | 0.27271 | 0.25617 | 0.32232 | 21.09.2025 21:00 | SL | — | -1.02R | |
| 0404 | EURAUD | SELL | 03.09.2025 13:00 | 1.78079 | 1.79364 | 1.74224 | 10.09.2025 09:00 | Time exit | +110 | +0.86R | |
| 0403 | CHFJPY | BUY | 22.08.2025 09:00 | 183.642 | 182.030 | 188.477 | 29.08.2025 05:00 | Time exit | -15 | -0.09R | |
| 0402 | GER40 | BUY | 14.08.2025 17:00 | 24407.60 | 23935.16 | 25824.92 | 21.08.2025 13:00 | Time exit | — | -0.31R | |
| 0401 | EURAUD | BUY | 14.08.2025 13:00 | 1.79284 | 1.78282 | 1.82289 | 21.08.2025 09:00 | Time exit | +208 | +2.08R | |
| 0400 | EURCAD | BUY | 06.08.2025 17:00 | 1.59885 | 1.58986 | 1.62581 | 13.08.2025 13:00 | Time exit | +129 | +1.43R | |
| 0399 | US500 | BUY | 31.07.2025 01:00 | 6419.40 | 6337.32 | 6665.64 | 31.07.2025 17:00 | SL | — | -1.01R | |
| 0398 | BRENT | SELL | 27.07.2025 21:00 | 67.760 | 69.091 | 63.767 | 28.07.2025 13:00 | SL | — | -1.04R | |
| 0397 | GBPJPY | BUY | 16.07.2025 01:00 | 199.542 | 198.041 | 204.04 | 16.07.2025 13:00 | SL | -153 | -1.02R | |
| 0396 | USDCAD | SELL | 30.06.2025 21:00 | 1.36054 | 1.37619 | 1.31358 | 07.07.2025 17:00 | Time exit | -76 | -0.48R | |
| 0395 | GER40 | BUY | 21.05.2025 17:00 | 24123.00 | 23866.05 | 24893.84 | 22.05.2025 09:00 | SL | — | -1.01R | |
| 0394 | BTCUSD | BUY | 19.05.2025 13:00 | 104786.42 | 101862.74 | 113557.45 | 24.05.2025 09:00 | Time exit | — | +1.38R | |
| 0393 | EURGBP | SELL | 06.05.2025 13:00 | 0.84646 | 0.85423 | 0.82316 | 13.05.2025 09:00 | Time exit | +58 | +0.74R | |
| 0392 | US500 | BUY | 30.04.2025 21:00 | 5600.60 | 5428.54 | 6116.77 | 07.05.2025 17:00 | Time exit | — | +0.15R | |
| 0391 | SOLUSD | BUY | 22.04.2025 13:00 | 145.310 | 133.511 | 180.708 | 27.04.2025 09:00 | Time exit | — | +0.30R | |
| 0390 | USDCHF | SELL | 08.04.2025 21:00 | 0.84746 | 0.86797 | 0.78593 | 15.04.2025 17:00 | Time exit | +239 | +1.16R | |
| 0389 | BNBUSD | SELL | 03.04.2025 13:00 | 586.25 | 619.37 | 486.88 | 08.04.2025 09:00 | Time exit | — | +0.78R | |
| 0388 | US500 | SELL | 13.03.2025 18:00 | 5512.40 | 5679.00 | 5012.60 | 17.03.2025 14:00 | SL | — | -1.00R | |
| 0387 | GBPUSD | BUY | 11.03.2025 18:00 | 1.29493 | 1.28576 | 1.32243 | 18.03.2025 14:00 | Time exit | +54 | +0.59R | |
| 0386 | USDCAD | BUY | 03.03.2025 22:00 | 1.44811 | 1.43656 | 1.48276 | 05.03.2025 14:00 | SL | -117 | -1.01R | |
| 0385 | US500 | BUY | 19.02.2025 02:00 | 6139.20 | 6100.58 | 6255.06 | 20.02.2025 14:00 | SL | — | -1.02R | |
| 0384 | EURCAD | SELL | 03.02.2025 18:00 | 1.49847 | 1.51760 | 1.44107 | 10.02.2025 14:00 | Time exit | +216 | +1.13R | |
| 0383 | GBPCAD | BUY | 23.01.2025 14:00 | 1.77489 | 1.76381 | 1.80813 | 30.01.2025 10:00 | Time exit | +210 | +1.90R | |
| 0382 | EURCHF | BUY | 17.01.2025 14:00 | 0.93958 | 0.93646 | 0.94894 | 24.01.2025 06:00 | TP 3R | +91 | +2.92R | |
| 0381 | NZDJPY | BUY | 30.12.2024 06:00 | 89.277 | 88.455 | 91.744 | 30.12.2024 14:00 | SL | -85 | -1.03R | |
| 0380 | GER40 | BUY | 30.12.2024 02:00 | 20001.30 | 19803.33 | 20595.20 | 30.12.2024 14:00 | SL | — | -1.01R | |
| 0379 | LTCUSD | BUY | 23.12.2024 22:00 | 106.760 | 96.126 | 138.663 | 28.12.2024 18:00 | Time exit | — | -0.58R | |
| 0378 | AUDCAD | BUY | 17.12.2024 02:00 | 0.90755 | 0.90367 | 0.91920 | 18.12.2024 06:00 | SL | -41 | -1.06R | |
| 0377 | AUDJPY | BUY | 12.12.2024 06:00 | 97.853 | 95.944 | 103.580 | 18.12.2024 22:00 | SL | -193 | -1.01R | |
| 0376 | NAS100 | BUY | 11.12.2024 18:00 | 21778.80 | 21342.32 | 23088.24 | 18.12.2024 14:00 | Time exit | — | +0.69R | |
| 0375 | GBPUSD | BUY | 05.12.2024 14:00 | 1.27516 | 1.26259 | 1.31286 | 12.12.2024 10:00 | Time exit | -24 | -0.19R | |
| 0374 | EURAUD | BUY | 04.12.2024 02:00 | 1.62779 | 1.61547 | 1.66475 | 10.12.2024 22:00 | Time exit | +229 | +1.86R | |
| 0373 | LTCUSD | BUY | 14.11.2024 02:00 | 83.330 | 67.726 | 130.142 | 18.11.2024 22:00 | Time exit | — | +0.39R | |
| 0372 | GBPAUD | SELL | 07.11.2024 02:00 | 1.95826 | 1.97846 | 1.89766 | 13.11.2024 22:00 | Time exit | +5 | +0.02R | |
| 0371 | EURJPY | BUY | 31.10.2024 14:00 | 166.118 | 164.880 | 169.832 | 07.11.2024 10:00 | Time exit | -48 | -0.39R | |
| 0370 | GBPNZD | BUY | 31.10.2024 10:00 | 2.173 | 2.164 | 2.200 | 31.10.2024 14:00 | SL | -91 | -1.03R | |
| 0369 | GBPJPY | SELL | 31.10.2024 06:00 | 198.013 | 199.871 | 192.439 | 07.11.2024 02:00 | Time exit | -115 | -0.62R | |
| 0368 | XAGUSD | BUY | 16.10.2024 05:00 | 31.648 | 30.719 | 34.435 | 22.10.2024 09:00 | TP 3R | — | +2.97R | |
| 0367 | GBPJPY | BUY | 14.10.2024 17:00 | 195.687 | 193.500 | 202.25 | 21.10.2024 13:00 | Time exit | -24 | -0.11R | |
| 0366 | US500 | BUY | 11.09.2024 21:00 | 5556.60 | 5408.67 | 6000.40 | 18.09.2024 17:00 | Time exit | — | +0.52R | |
| 0365 | CADJPY | SELL | 06.09.2024 17:00 | 104.974 | 106.835 | 99.390 | 13.09.2024 13:00 | Time exit | +135 | +0.73R | |
| 0364 | NAS100 | SELL | 06.09.2024 09:00 | 18702.30 | 19136.29 | 17400.33 | 11.09.2024 17:00 | SL | — | -1.00R | |
| 0363 | LTCUSD | BUY | 05.09.2024 05:00 | 68.300 | 61.894 | 87.517 | 06.09.2024 17:00 | SL | — | -1.01R | |
| 0362 | NZDCHF | BUY | 29.08.2024 05:00 | 0.52883 | 0.52447 | 0.54191 | 03.09.2024 21:00 | SL | -46 | -1.06R | |
| 0361 | USDJPY | BUY | 15.08.2024 13:00 | 148.952 | 145.996 | 157.819 | 19.08.2024 01:00 | SL | -297 | -1.01R | |
| 0360 | EURJPY | BUY | 14.08.2024 09:00 | 162.101 | 160.509 | 166.878 | 19.08.2024 05:00 | SL | -162 | -1.02R | |
| 0359 | NZDUSD | BUY | 07.08.2024 01:00 | 0.59971 | 0.58472 | 0.64469 | 13.08.2024 21:00 | Time exit | +81 | +0.54R | |
| 0358 | USDJPY | SELL | 30.07.2024 21:00 | 152.745 | 155.278 | 145.145 | 05.08.2024 01:00 | TP 3R | +758 | +2.99R | |
| 0357 | AUDJPY | SELL | 30.07.2024 17:00 | 100.162 | 101.826 | 95.169 | 04.08.2024 21:00 | TP 3R | +497 | +2.98R | |
| 0356 | LINKUSD | BUY | 29.07.2024 05:00 | 13.890 | 13.164 | 16.068 | 30.07.2024 13:00 | SL | — | -1.02R | |
| 0355 | LTCUSD | BUY | 21.07.2024 21:00 | 73.990 | 71.098 | 82.667 | 22.07.2024 17:00 | SL | — | -1.03R | |
| 0354 | NAS100 | SELL | 17.07.2024 13:00 | 20107.40 | 20621.09 | 18566.33 | 24.07.2024 09:00 | Time exit | — | +1.21R | |
| 0353 | NZDCAD | SELL | 16.07.2024 05:00 | 0.82833 | 0.83480 | 0.80893 | 23.07.2024 01:00 | Time exit | +70 | +1.08R | |
| 0352 | USDCHF | BUY | 10.07.2024 17:00 | 0.89917 | 0.89624 | 0.90796 | 11.07.2024 09:00 | SL | -31 | -1.05R | |
| 0351 | EURJPY | BUY | 08.07.2024 09:00 | 174.591 | 173.474 | 177.942 | 11.07.2024 09:00 | SL | -114 | -1.02R | |
| 0350 | XAGUSD | BUY | 05.07.2024 17:00 | 31.456 | 30.155 | 35.358 | 12.07.2024 13:00 | Time exit | — | -0.42R | |
| 0349 | EURAUD | BUY | 02.07.2024 05:00 | 1.61512 | 1.60175 | 1.65522 | 09.07.2024 01:00 | Time exit | -91 | -0.68R | |
| 0348 | BRENT | BUY | 28.06.2024 05:00 | 85.540 | 83.617 | 91.309 | 05.07.2024 01:00 | Time exit | — | +0.63R | |
| 0347 | EURNZD | BUY | 26.06.2024 17:00 | 1.75724 | 1.74807 | 1.78474 | 03.07.2024 13:00 | Time exit | +87 | +0.95R | |
| 0346 | TRXUSD | BUY | 22.06.2024 09:00 | 0.11961 | 0.11572 | 0.13129 | 27.06.2024 05:00 | Time exit | — | +0.84R | |
| 0345 | BRENT | BUY | 17.06.2024 17:00 | 83.220 | 81.485 | 88.426 | 24.06.2024 13:00 | Time exit | — | +1.11R | |
| 0344 | AUDCHF | SELL | 07.06.2024 17:00 | 0.59044 | 0.59541 | 0.57554 | 12.06.2024 09:00 | SL | -52 | -1.05R | |
| 0343 | NZDJPY | BUY | 03.06.2024 05:00 | 96.758 | 95.395 | 100.848 | 04.06.2024 09:00 | SL | -139 | -1.02R | |
| 0342 | CADJPY | BUY | 29.05.2024 17:00 | 115.048 | 114.786 | 115.833 | 29.05.2024 21:00 | SL | -29 | -1.10R | |
| 0341 | AUDJPY | BUY | 28.05.2024 05:00 | 104.488 | 103.452 | 107.595 | 30.05.2024 05:00 | SL | -106 | -1.02R | |
| 0340 | AUDUSD | SELL | 22.05.2024 13:00 | 0.66455 | 0.66868 | 0.65215 | 29.05.2024 09:00 | Time exit | +14 | +0.33R | |
| 0339 | DOGEUSD | BUY | 20.05.2024 17:00 | 0.15761 | 0.14708 | 0.18919 | 25.05.2024 13:00 | Time exit | — | +1.16R | |
| 0338 | US500 | BUY | 14.05.2024 21:00 | 5246.90 | 5194.71 | 5403.46 | 21.05.2024 17:00 | Time exit | — | +1.50R | |
| 0337 | NZDUSD | BUY | 14.05.2024 17:00 | 0.60340 | 0.59928 | 0.61575 | 21.05.2024 13:00 | Time exit | +58 | +1.41R | |
| 0336 | EURAUD | SELL | 03.05.2024 13:00 | 1.62611 | 1.64994 | 1.55463 | 10.05.2024 09:00 | Time exit | -36 | -0.15R | |
| 0335 | GBPJPY | BUY | 24.04.2024 01:00 | 192.850 | 190.234 | 200.70 | 30.04.2024 21:00 | Time exit | +407 | +1.56R | |
| 0334 | USDJPY | BUY | 22.04.2024 17:00 | 154.785 | 153.545 | 158.505 | 29.04.2024 01:00 | TP 3R | +370 | +2.99R | |
| 0333 | EURJPY | BUY | 22.04.2024 05:00 | 165.009 | 162.968 | 171.131 | 29.04.2024 01:00 | TP 3R | +610 | +2.99R | |
| 0332 | XRPUSD | SELL | 01.04.2024 13:00 | 0.59960 | 0.64685 | 0.45784 | 06.04.2024 09:00 | Time exit | — | +0.10R | |
| 0331 | EURJPY | SELL | 27.03.2024 10:00 | 163.783 | 164.451 | 161.780 | 03.04.2024 05:00 | Time exit | +33 | +0.49R | |
| 0330 | DOTUSD | BUY | 11.03.2024 18:00 | 11.029 | 9.757 | 14.846 | 16.03.2024 14:00 | SL | — | -1.01R | |
| 0329 | ADAUSD | BUY | 11.03.2024 14:00 | 0.75860 | 0.68291 | 0.98567 | 15.03.2024 06:00 | SL | — | -1.01R | |
| 0328 | ETHUSD | BUY | 11.03.2024 06:00 | 4001.40 | 3714.97 | 4860.69 | 14.03.2024 22:00 | SL | — | -1.01R | |
| 0327 | AUDCHF | BUY | 06.03.2024 14:00 | 0.57790 | 0.57353 | 0.59100 | 13.03.2024 10:00 | Time exit | +22 | +0.50R | |
| 0326 | LINKUSD | SELL | 05.03.2024 18:00 | 17.747 | 21.115 | 7.643 | 10.03.2024 14:00 | Time exit | — | -0.63R | |
| 0325 | TRXUSD | SELL | 05.03.2024 06:00 | 0.13945 | 0.14213 | 0.13142 | 10.03.2024 02:00 | Time exit | — | +1.26R | |
| 0324 | EURCHF | BUY | 22.02.2024 18:00 | 0.95382 | 0.94951 | 0.96674 | 29.02.2024 14:00 | Time exit | +5 | +0.11R | |
| 0323 | TRXUSD | BUY | 15.02.2024 14:00 | 0.13066 | 0.12352 | 0.15207 | 20.02.2024 10:00 | Time exit | — | +0.95R | |
| 0322 | USDJPY | BUY | 08.02.2024 14:00 | 149.392 | 147.568 | 154.864 | 15.02.2024 10:00 | Time exit | +41 | +0.23R | |
| 0321 | XAUUSD | SELL | 08.02.2024 14:00 | 2020.90 | 2045.33 | 1947.62 | 15.02.2024 10:00 | Time exit | +170 | +0.69R | |
| 0320 | TRXUSD | BUY | 01.02.2024 14:00 | 0.11481 | 0.11141 | 0.12500 | 06.02.2024 06:00 | TP 3R | — | +2.97R | |
| 0319 | ETHUSD | BUY | 29.01.2024 22:00 | 2317.61 | 2230.94 | 2577.63 | 03.02.2024 18:00 | Time exit | — | -0.27R | |
| 0318 | EURGBP | SELL | 23.01.2024 10:00 | 0.85534 | 0.85940 | 0.84316 | 30.01.2024 06:00 | Time exit | +13 | +0.31R | |
| 0317 | BNBUSD | BUY | 20.01.2024 22:00 | 317.30 | 304.47 | 355.79 | 22.01.2024 14:00 | SL | — | -1.02R | |
| 0316 | ETHUSD | SELL | 18.01.2024 18:00 | 2439.50 | 2618.74 | 1901.79 | 23.01.2024 14:00 | Time exit | — | +1.40R | |
| 0315 | NAS100 | SELL | 17.01.2024 14:00 | 16698.40 | 16916.86 | 16043.02 | 18.01.2024 10:00 | SL | — | -1.01R | |
| 0314 | USDCHF | BUY | 16.01.2024 02:00 | 0.85695 | 0.84855 | 0.88215 | 22.01.2024 22:00 | Time exit | +109 | +1.30R | |
| 0313 | ADAUSD | BUY | 10.01.2024 22:00 | 0.56620 | 0.48534 | 0.80877 | 15.01.2024 18:00 | Time exit | — | -0.48R | |
| 0312 | GBPUSD | BUY | 08.01.2024 18:00 | 1.27537 | 1.26071 | 1.31936 | 15.01.2024 14:00 | Time exit | -27 | -0.18R | |
| 0311 | USDCAD | BUY | 08.01.2024 06:00 | 1.33735 | 1.32846 | 1.36402 | 15.01.2024 02:00 | Time exit | +24 | +0.27R | |
| 0310 | XAUUSD | SELL | 08.01.2024 06:00 | 2030.60 | 2065.01 | 1927.36 | 15.01.2024 02:00 | Time exit | -246 | -0.72R | |
| 0309 | NZDUSD | SELL | 05.01.2024 10:00 | 0.62185 | 0.62878 | 0.60105 | 12.01.2024 06:00 | Time exit | -26 | -0.37R | |
| 0308 | BNBUSD | BUY | 04.01.2024 22:00 | 323.60 | 292.75 | 416.14 | 07.01.2024 22:00 | SL | — | -1.01R | |
| Total: 171 | +24.7R | ||||||||||
How much to risk per trade
About half of the trades are winners, and streaks of 5 losses in a row are normal. The maximum drawdown for 2024–2026 is −6.6R, and over the entire history — −18.5R. So a reasonable risk is 0.5–1% of the deposit per trade. At 0.5%, the worst drawdown over the whole history would have been about 9% of the deposit. If you trade all three variants together, stick to 0.5%: there are more trades, and they can overlap in time.
Common mistakes
- Trading every Pin Bar. According to the test, this loses money on any timeframe. A Pin Bar is not a signal by itself, but confirmation that liquidity has been swept.
- Entering right after the pin. Even if the pin swept liquidity, an immediate entry is in the red. Wait for the change of structure — a close beyond the nearest swing high (low).
- Confusing any long wick with a liquidity sweep. A sweep is a break of a noticeable level: a swing low that has not been broken yet, the previous week’s low or the range boundary.
- Trading Pin Bars on H1. Many signals, small stops, the spread and noise eat the profit. If you do trade H1 — only the main strategy with FVG.
- Waiting for a signal on one market. On one chart a signal appears 1–2 times a year. Watch 20–40 markets.
- Risking too much. Risk 0.5–1% per trade.
Questions and answers
What is R?
R is the size of the stop. −1R — the stop was hit, +3R — a profit of three stops. On currency pairs on H4, 1R averages about 100 pips; with a risk of 0.5% of the deposit, 1R = 0.5% of the deposit.
Does the Pin Bar work on its own?
No. In 2024–2026 on 46 markets, a Pin Bar without filters is in the red on H1, H4 and D1 — with any entry: immediate, stop order, with the EMA200 trend, from a level.
Which timeframe should I trade the Pin Bar on?
On H4. On H1 only the variant with a liquidity sweep, FVG and change of structure is profitable; on D1 there are too few working signals.
How do I enter on a Pin Bar?
After a change of structure: wait until a candle closes beyond the nearest swing high (for buys) or swing low (for sells), and enter at the open of the next candle.
Where do I put the stop and the target?
Stop — behind the pin’s tail with a small buffer. Target — 3R; if the target is not reached within 30 H4 candles, close the trade at market. Targets of 2R and 4R give almost the same result.
Do I need a trend filter?
No. In the working variants both buys and sells are profitable. A Pin Bar with the EMA200 trend but without liquidity is in the red.
How many trades will there be?
The main strategy — about 5 trades per month on 46 markets. All three working variants on H4 — about 22 per month. Together with H1 — about 40.
Which markets are best?
The main strategy works best on currency pairs (+23.5R for 2024–2026). On cryptocurrencies it is around zero.
Conclusion
The Pin Bar works — but not the way it is usually traded. A Pin Bar by itself, an immediate entry, a stop order behind the pin, a trend filter — all of this is in the red in 2024–2026 on H1, H4 and D1. Profit appears when the Pin Bar sweeps liquidity and price then breaks structure. The best variant is Pin Bar + liquidity sweep + FVG + change of structure on H4: 171 trades, +24.7R, drawdown −6.6R, profitable every year and the most stable result over the history since 1999. To get more trades, add the sweep of the 50-candle range boundary and of the previous week’s low/high — together about 22 trades per month on 46 markets. Risk — 0.5–1% per trade.
 Point your phone camera here