Contents 17
- What are trading sessions
- What are Kill Zones
- Power of 3 and the London Judas swing
- Does the Asian range sweep work? The test
- The strategy: Asian sweep → CHoCH in the London Kill Zone
- Statistics: 5,334 trades over 22 years
- Partial close and breakeven: the test
- Trade examples step by step
- Gallery: all 2025–2026 trades
- How to calculate the lot size
- Why it works: the liquidity logic
- Kill Zones with other SMC models
- Common session trading mistakes
- FAQ: Kill Zones
- Video: Kill Zones on real trades
- Conclusion
- Other strategies we have backtested
Kill Zones are short windows of the trading day when big money enters the market and price makes its main move. The idea comes from ICT and Smart Money: traders do not watch the chart all day — they trade only these windows, the London open and the New York open.
The best-known pattern: overnight, during the Asian session, price sits in a tight range. In the morning Frankfurt and London run one side of that range — they take the stops — and then price reverses into the real move of the day. That is how traders “see in the morning where price is going”.
In this article we explain sessions and kill zones, the Power of 3 model and the London Judas swing, and then test it all: one-minute quotes of EURUSD, GBPUSD, EURJPY and GBPJPY from 2005 to October 2026, M5 candles, spread included in every trade.
❗ What R means — read this before the numbers
R is the size of the stop in a trade. 1R = the distance from entry to the stop loss. Stop hit — the trade made −1R. Price moved three stops in our favour — +3R.
In pips: the median EURUSD stop is 26 pips, so 1R ≈ 26 pips and the 3R target ≈ 78 pips. On GBPUSD 1R ≈ 35 pips, on EURJPY ≈ 37, on GBPJPY ≈ 47.
In money: if you risk 0.5% of the account per trade, 1R = 0.5% of the account and +3R = +1.5%.
We count in R rather than pips because every trade has its own stop: R lets us add up and compare trades on different pairs fairly. The whole test result +315R = +13,775 pips across the four pairs over 22 years.
What are trading sessions
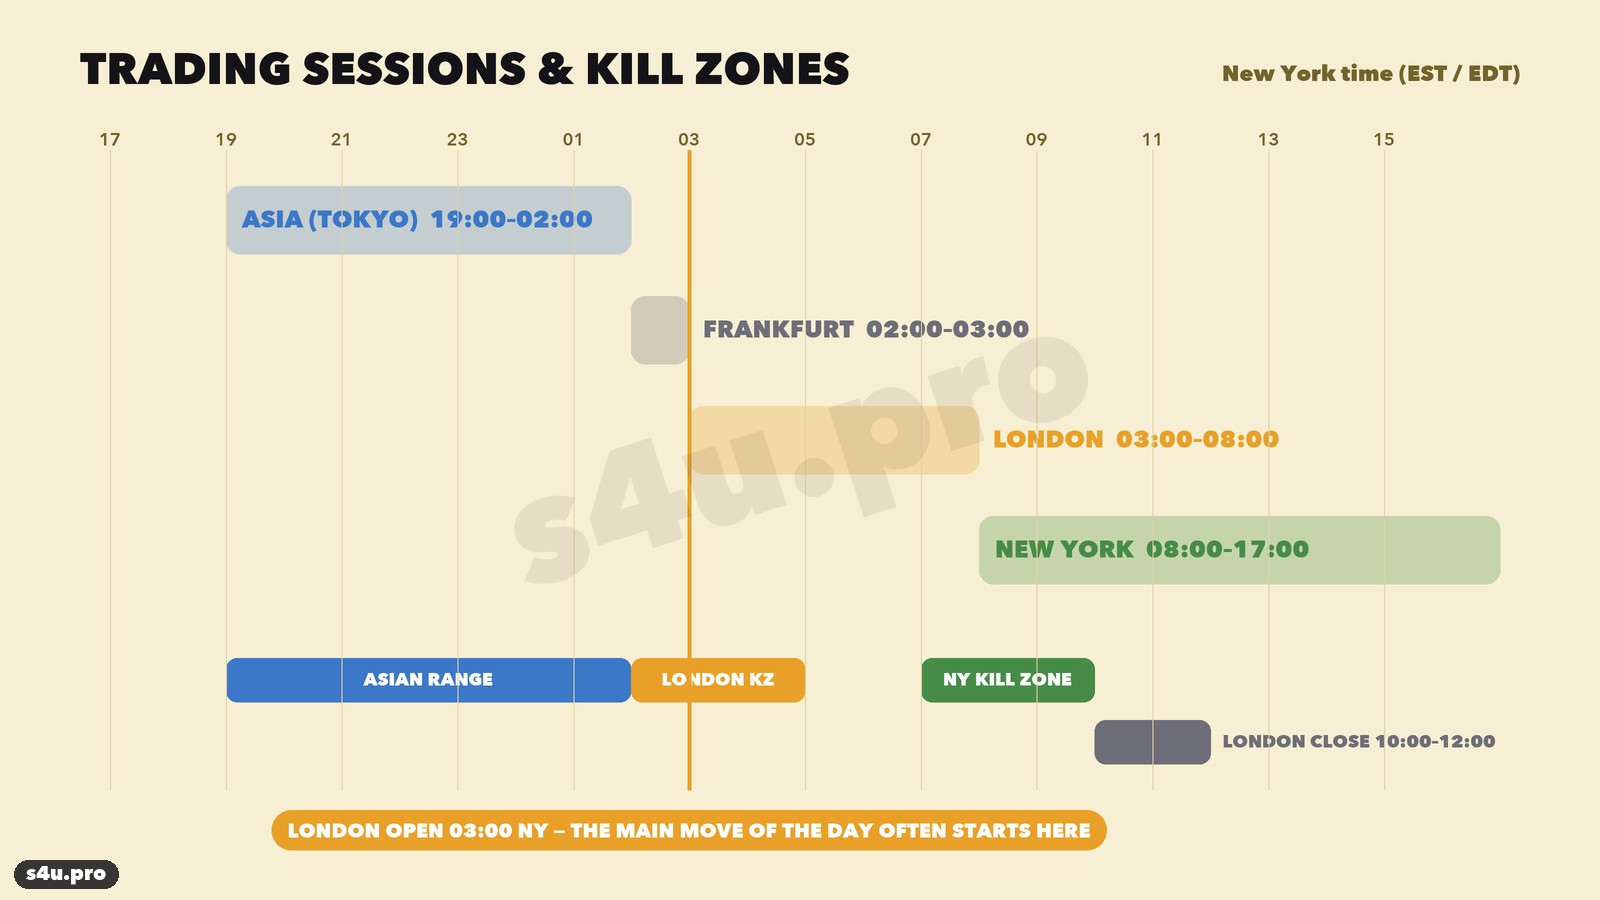
Forex trades around the clock, but not evenly. The day is split into sessions — the working hours of the main financial centres. ICT counts everything in New York time (EST in winter, EDT in summer), and so do we:
- Asian session (Tokyo) — 19:00–02:00. Low volume, price usually moves in a narrow band. Stop losses pile up above its high and below its low.
- Frankfurt — 02:00–03:00. Europe wakes up, often with the first sharp spike.
- London — 03:00–08:00. The most liquid session: about a third of global FX turnover goes through London.
- New York — 08:00–17:00. The second-largest session; in the morning it overlaps with London.
What are Kill Zones
A Kill Zone is not the whole session but its most active window, usually the first 2–3 hours. ICT names four zones:
| Kill Zone | New York | UTC (winter / summer) | MT4/MT5 server (GMT+2 / GMT+3) | What happens |
|---|---|---|---|---|
| Asian Range | 19:00–02:00 | 00:00–07:00 / 23:00–06:00 | 02:00–09:00 | Price builds a range, liquidity accumulates |
| London Kill Zone | 02:00–05:00 | 07:00–10:00 / 06:00–09:00 | 09:00–12:00 | One side of Asia is swept, the move of the day begins |
| New York Kill Zone | 07:00–10:00 | 12:00–15:00 / 11:00–14:00 | 14:00–17:00 | Continuation or pullback of the London move, US news |
| London Close | 10:00–12:00 | 15:00–17:00 / 14:00–16:00 | 17:00–19:00 | Profit taking, frequent pullbacks |
Most brokers run the MT4/MT5 server on GMT+2 in winter and GMT+3 in summer, switching together with New York. So on the platform clock the kill zones never move: Asia 02:00–09:00, London Kill Zone 09:00–12:00, the day closes at 00:00. Check your broker’s server time — if it is in another zone, convert from New York time.
Power of 3 and the London Judas swing
ICT describes the day with the Power of 3 model (also called AMD):
- Accumulation — Asia. Price ranges, stop losses build up on both sides.
- Manipulation — Frankfurt and the London open. Price spikes beyond one side of Asia, taking stops and breakout traders. This fake move is called the Judas swing.
- Distribution — London and New York. Price reverses into the real direction of the day, often to the other side of Asia and beyond.
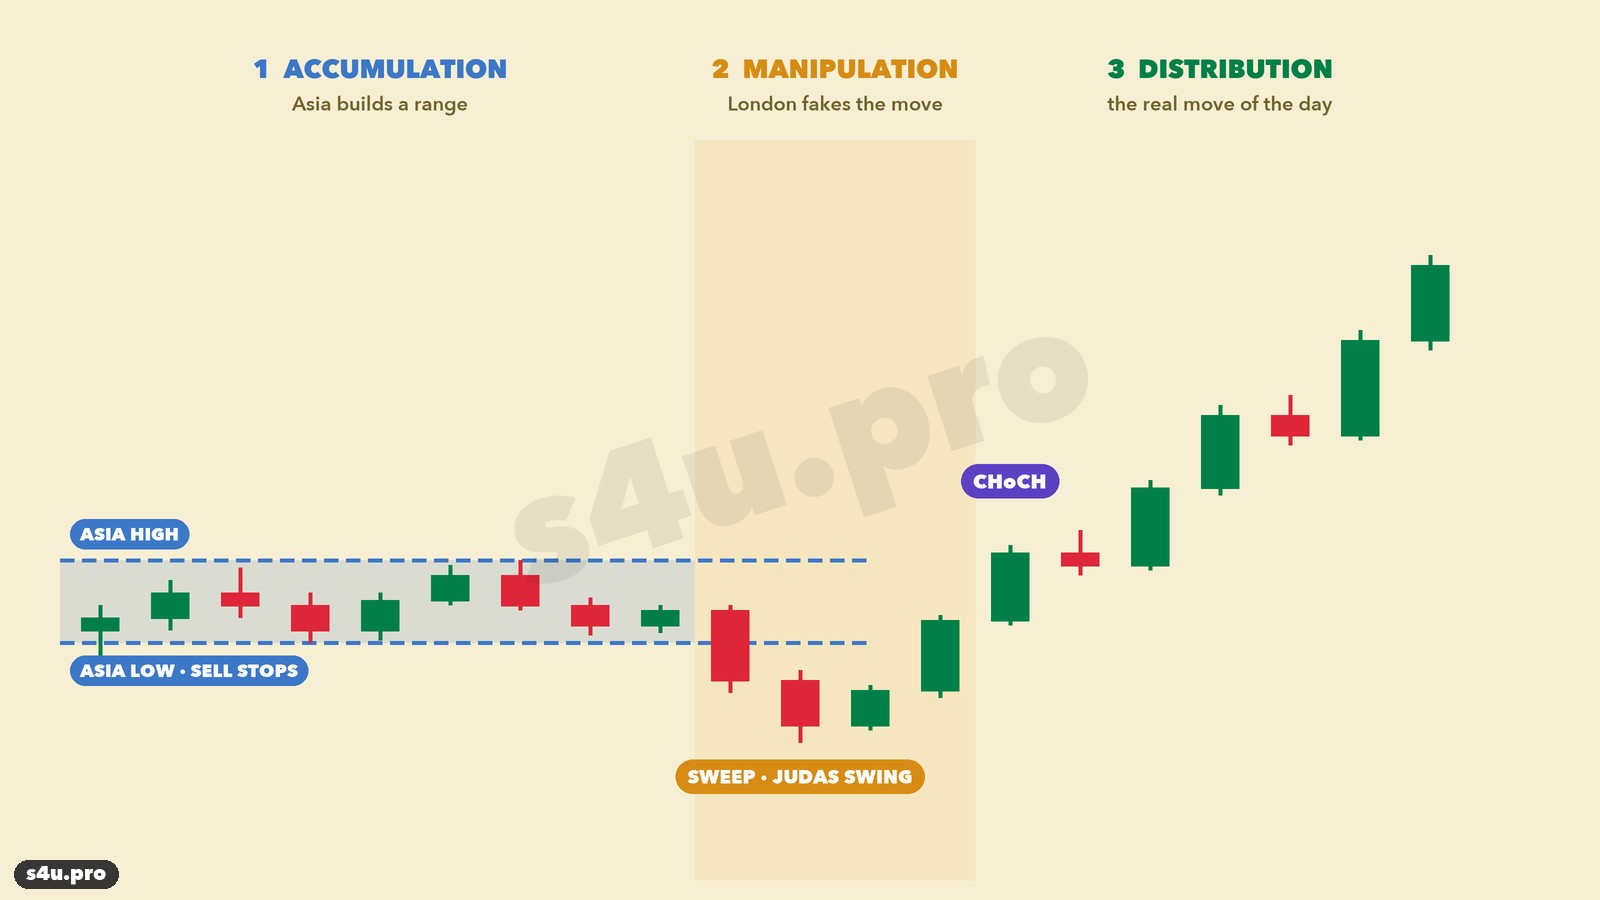
The fake move is a liquidity sweep: price pokes through a level, collects stops and comes back. The reversal after it is confirmed by a break of structure — a CHoCH. Now let us check it on history.
Does the Asian range sweep work? The test
We ran identical rules on 2005–2026 one-minute quotes built into M5 candles and converted to New York time. Spread is included in every trade: EURUSD 1.2 pips, GBPUSD 1.5, EURJPY 2.5, GBPJPY 3.0. If stop and target are hit by the same candle, we count the stop.
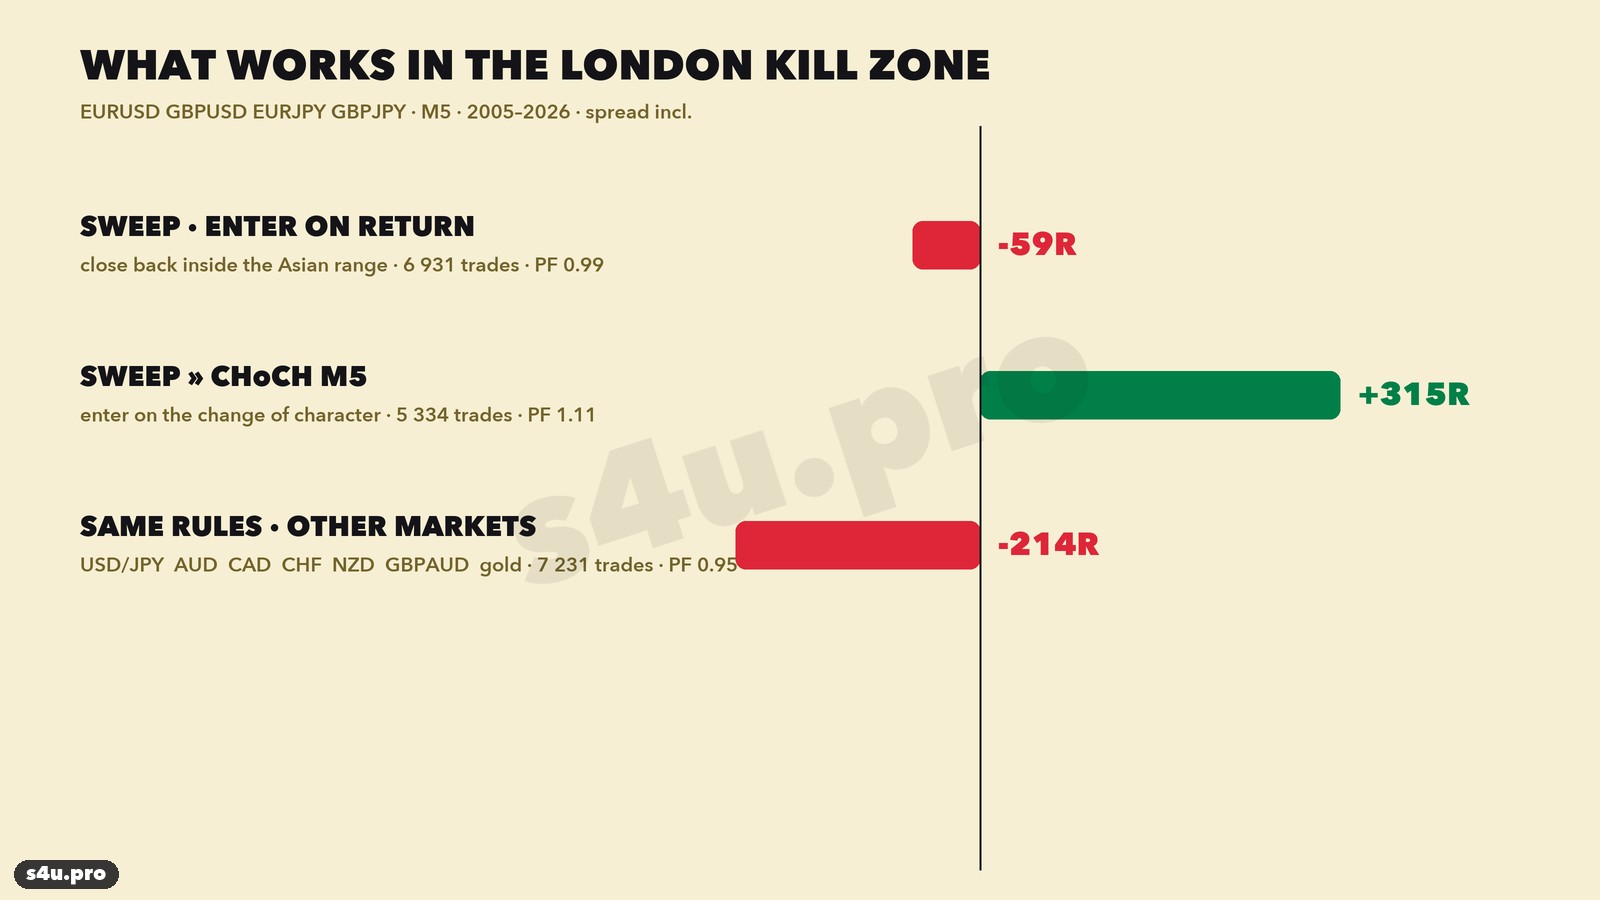
- Enter as soon as price returns into the Asian range — −59R on 6,931 trades, profit factor 0.99. The sweep alone gives nothing: price often comes back and then keeps going.
- Enter after a change of character (CHoCH) on M5 — +315R on 5,334 trades, profit factor 1.11. This is the working model.
- The same rules on USDJPY, AUDUSD, USDCAD, USDCHF, NZDUSD, GBPAUD and gold — −214R on 7,231 trades. London works best on European currencies: the euro and the pound.
We also compared sessions — same rules, but the CHoCH in Frankfurt, or the London range swept in New York:
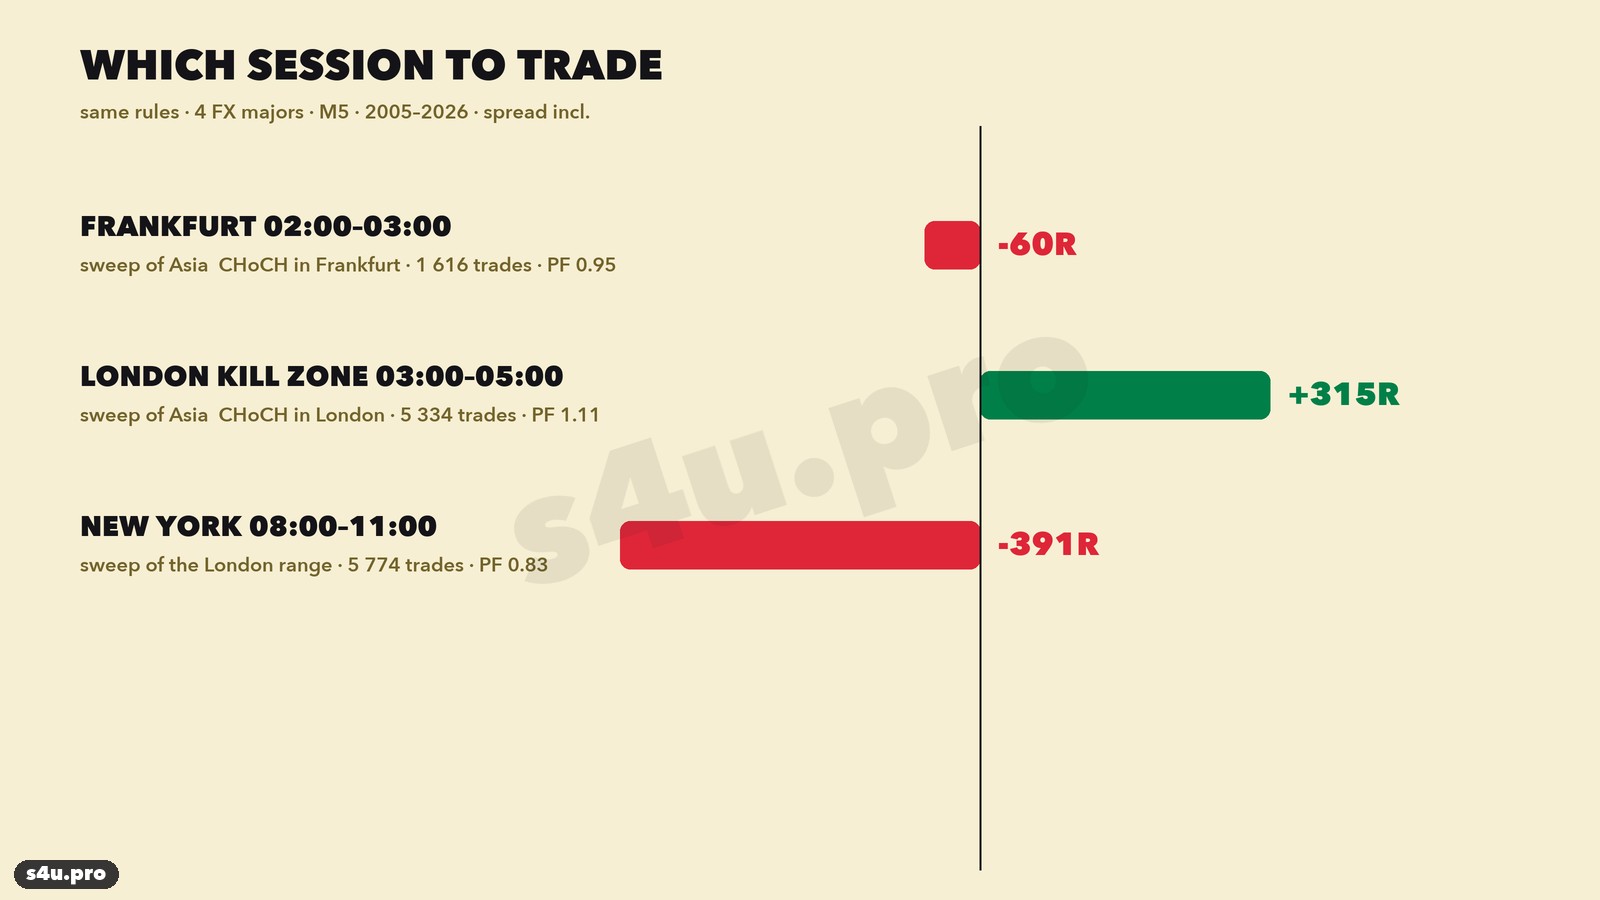
- Frankfurt 02:00–03:00 — −60R on 1,616 trades. Europe’s first spike is most often the fake move itself: entering it is too early.
- London 03:00–05:00 — +315R. The fake move has already happened and the reversal is confirmed.
- New York 08:00–11:00 (sweep of the London range) — −391R on 5,774 trades. On currencies the New York kill zone does not work with this model.
The strategy: Asian sweep → CHoCH in the London Kill Zone
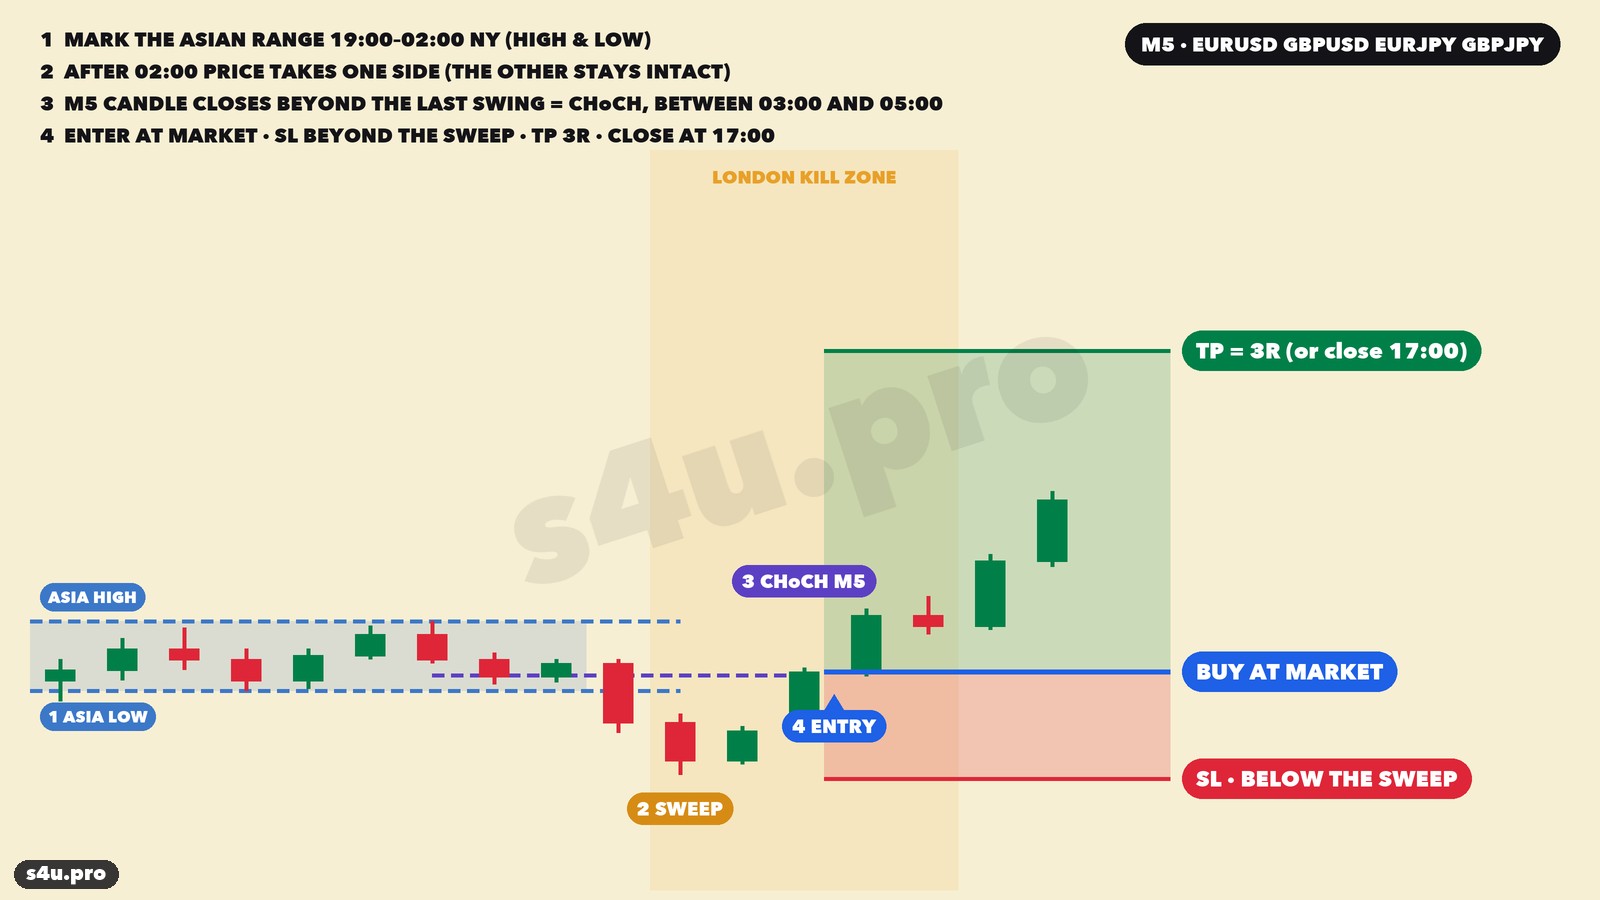
Markets: EURUSD, GBPUSD, EURJPY, GBPJPY. Timeframe: M5. Clock: New York.
- Asian range. Mark the high and low of price from 19:00 to 02:00 New York time.
- Sweep. After 02:00 wait for price to trade beyond one side of the range. The other side must stay intact — if both sides were taken, skip the day.
- Change of character (CHoCH). Before the sweep, find the extreme of the last 12 M5 candles: the high (swing high) for a buy, the low (swing low) for a sell. CHoCH is an M5 candle that closes beyond that level, against the direction of the sweep.
- Window. The CHoCH candle must close inside the London Kill Zone — 03:00 to 05:00. If the break happens before 03:00 or after 05:00, there is no trade.
- Entry at market on the close of the CHoCH candle. Asian low swept — buy; Asian high swept — sell.
- Stop beyond the sweep extreme (the low for a buy, the high for a sell) plus spread.
- Target 3R, three times the stop. If neither stop nor target is hit by 17:00 New York time, close at market.
- No more than one trade per pair per day.
Median stop in the test: EURUSD 26 pips, GBPUSD 35, EURJPY 37, GBPJPY 47. A trade lasts 7–8 hours on average — it is intraday trading with no overnight holding.
Statistics: 5,334 trades over 22 years
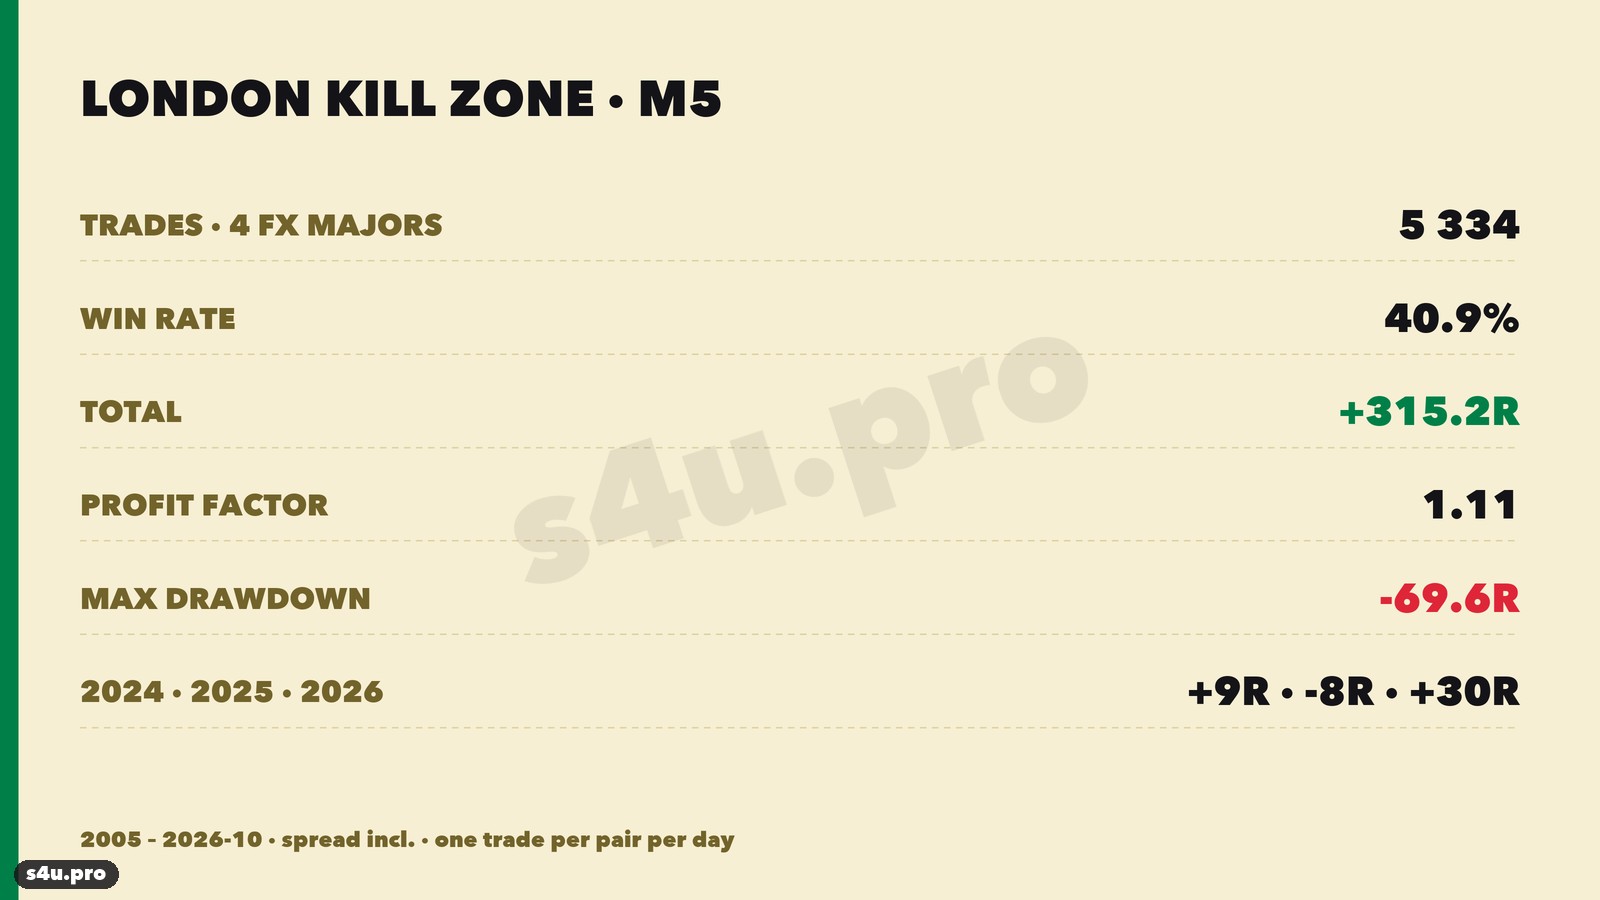
5,334 trades · 41% winners · +315.2R · +0.059R per trade · profit factor 1.11 · max drawdown −69.6R · up to 15 losses in a row · 17 of 22 years and all 4 pairs in profit.
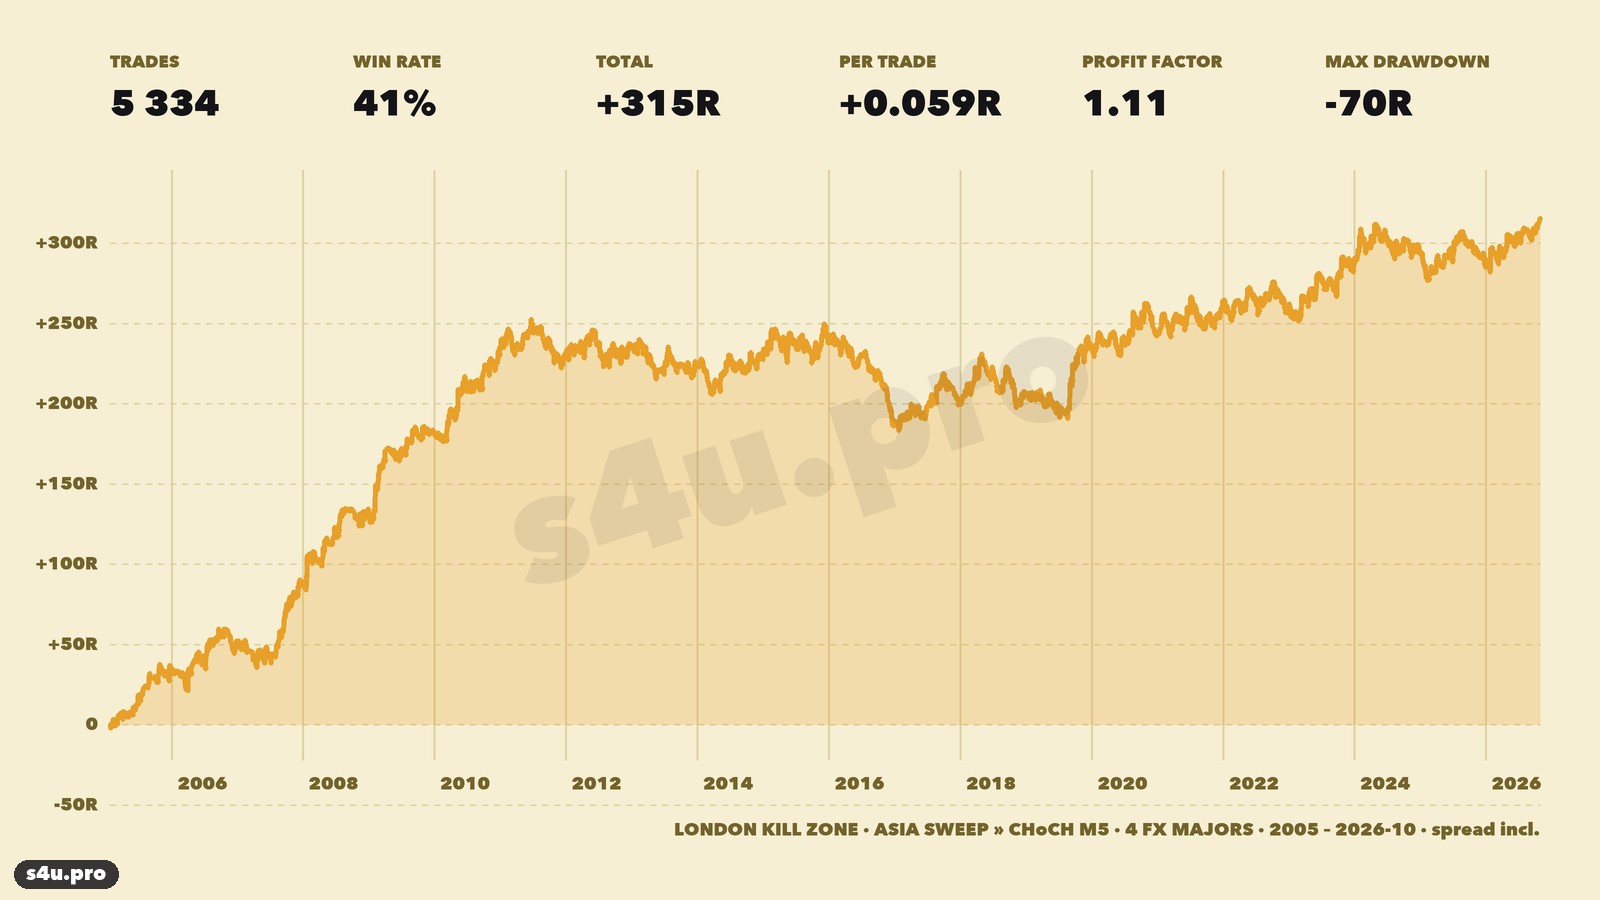
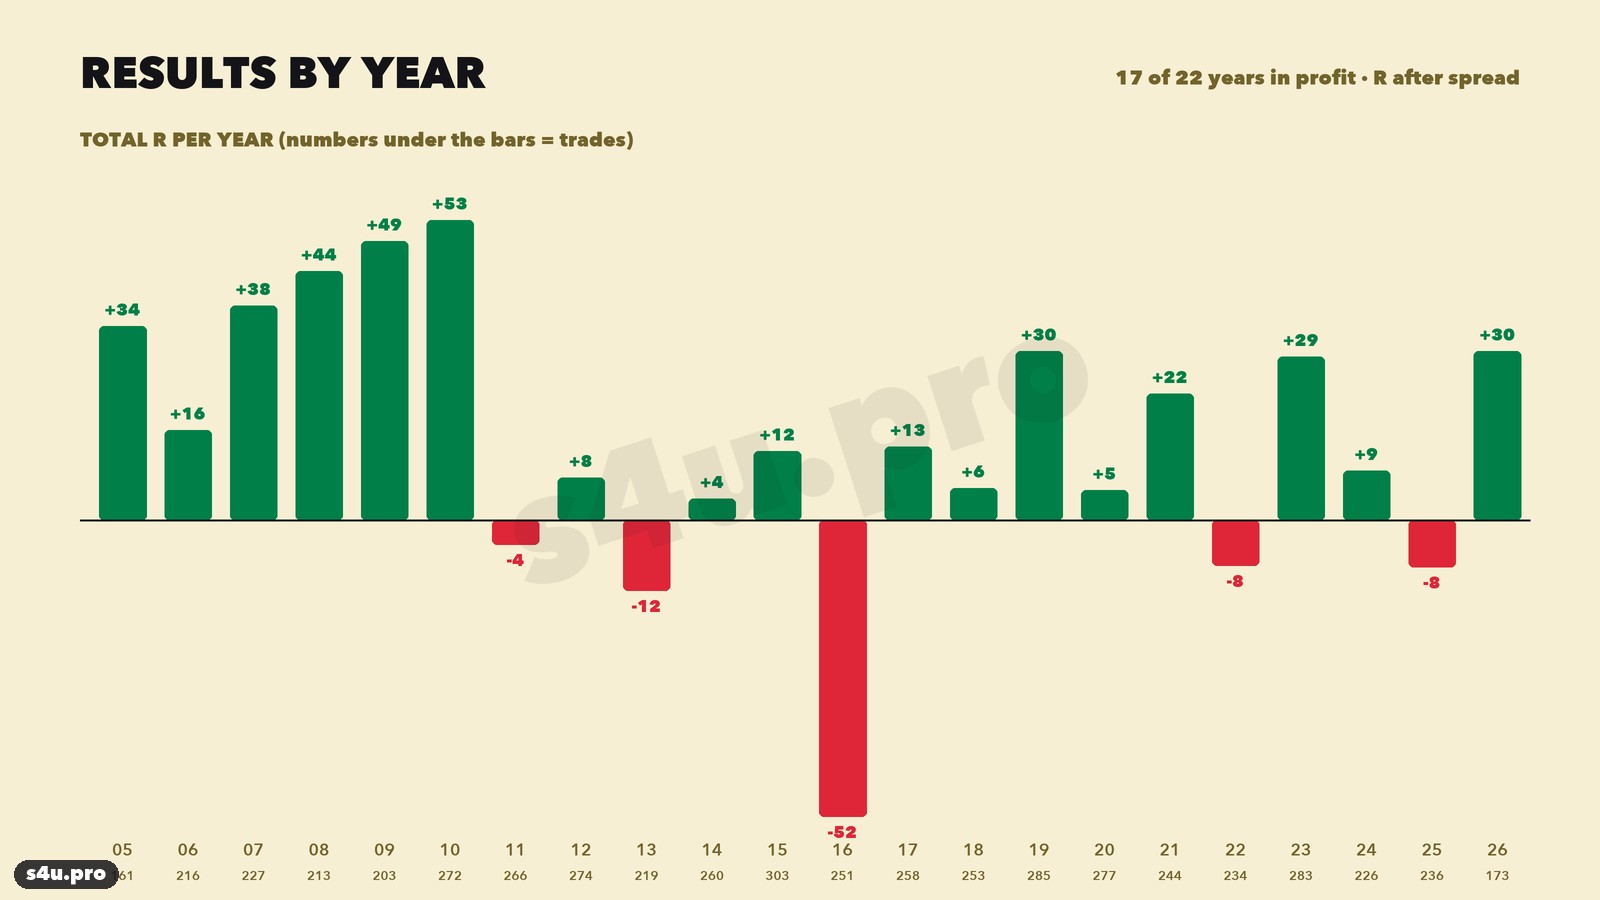
The curve is honest: strong growth in 2005–2010, then almost eight years with no progress (2011–2019), including the worst year 2016 (−52R, the Brexit vote year), and growth again from 2019. Every real strategy looks like this — be ready for long flat periods in advance.
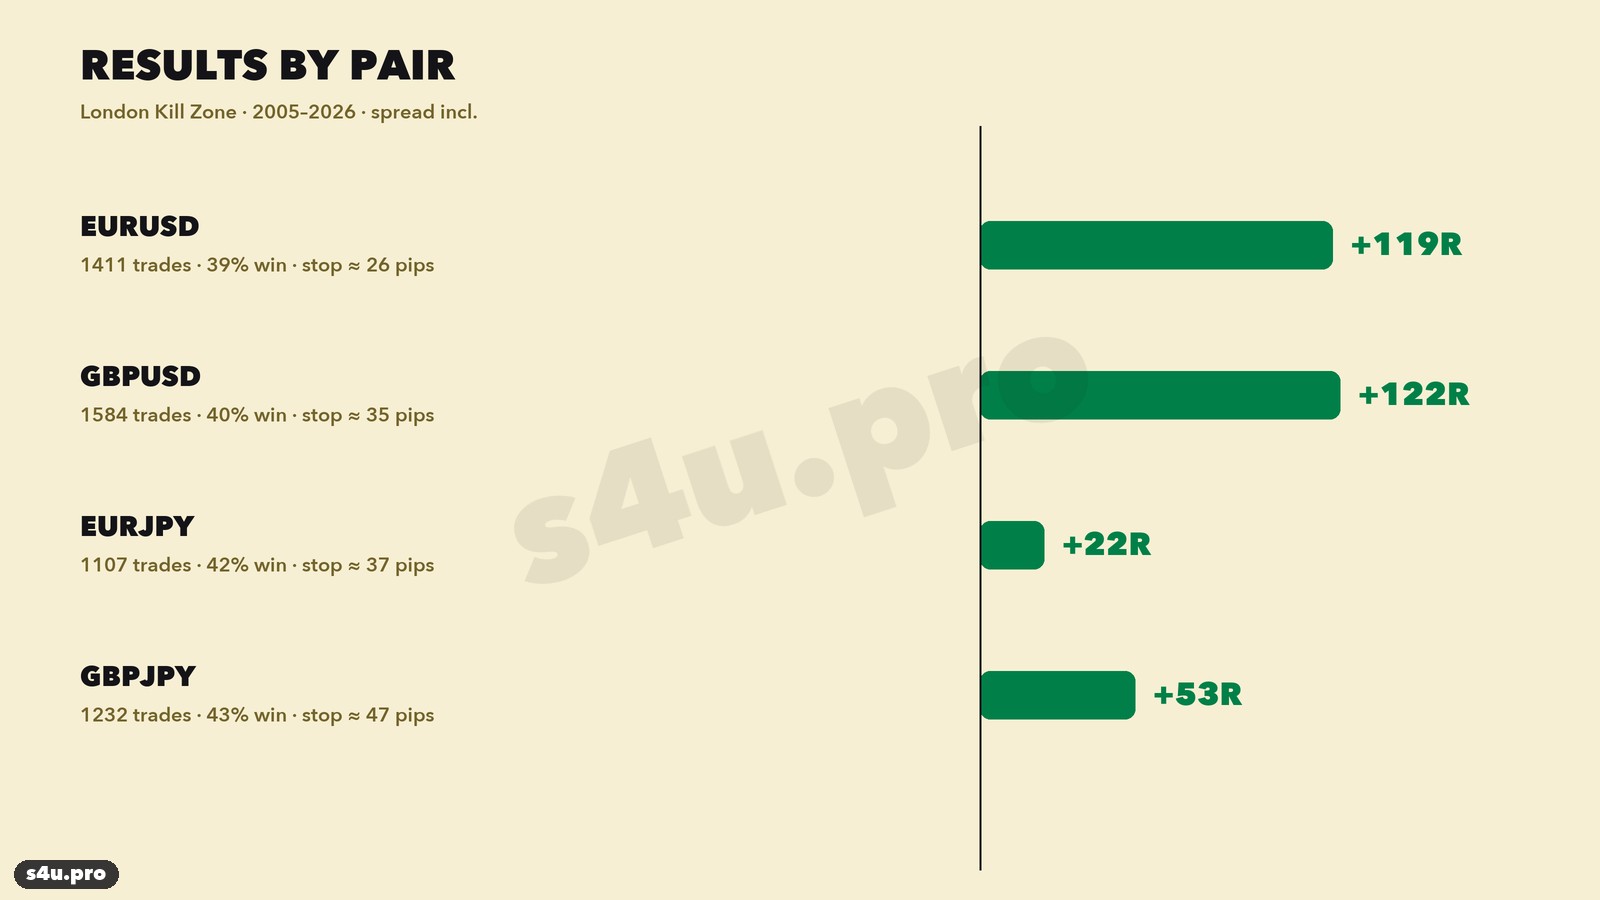
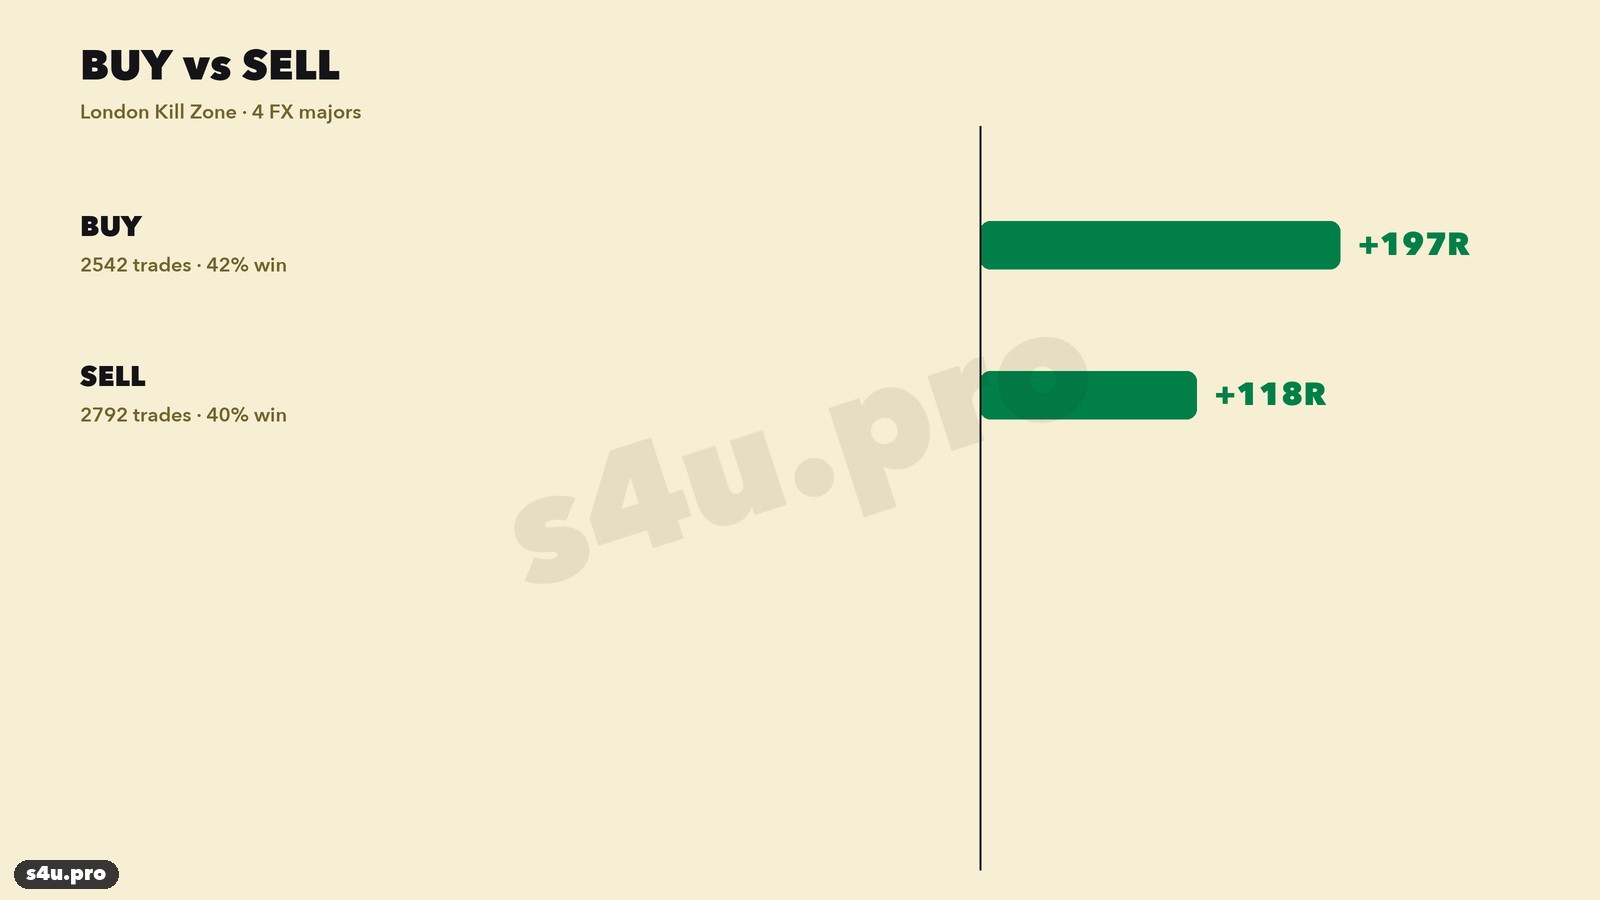
The model works best on EURUSD (+119R) and GBPUSD (+122R), weaker on the yen crosses: GBPJPY +53R, EURJPY +22R. Buys made +197R, sells +118R.
Of 5,334 trades, 507 closed at the target, 2,587 at the stop and 2,240 by time at 17:00. The time exit is an important part of the result: 75% of those trades closed in profit.
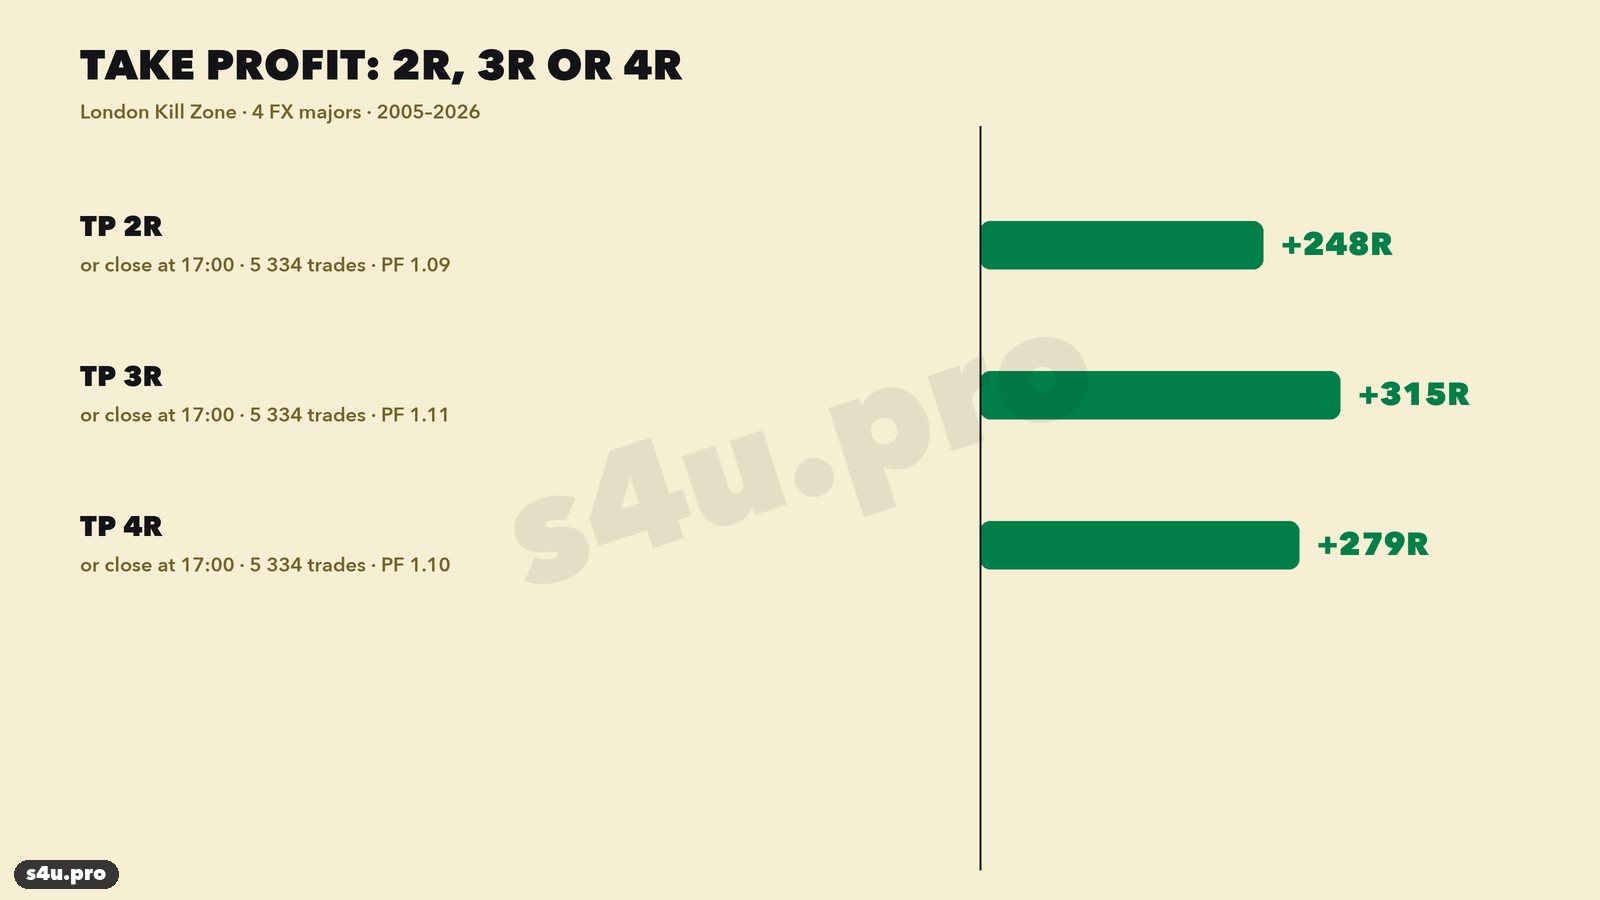
A 3R target is the best of the ones tested: 2R gives +248R, 4R +279R with a deeper drawdown (−91R).
In pips the whole result is +13,775 pips: EURUSD +3,079, GBPUSD +5,694, EURJPY +1,786, GBPJPY +3,216. On average that is +14R a year, about +7% a year at 0.5% risk per trade (no compounding).
Partial close and breakeven: the test
Many traders close part of the position at 1R and keep the rest. We tested 56 variants: close 30%, 50% or 70% at 1R, 1.5R or 2R, run the rest to 3R, 4R or 17:00, with and without moving the rest to breakeven.
| Variant | Total | Winners | Drawdown |
|---|---|---|---|
| Everything to 3R (main rules) | +315R | 41% | −70R |
| Breakeven at 1R, target 3R | +322R | 33% (+ break-even trades) | −67R |
| Close 30% at 2R, rest to 3R | +295R | 41% | −67R |
| Close 50% at 1R, rest to 3R + breakeven | +241R | 51% | −56R |
| Close 70% at 1R, rest to 3R | +207R | 51% | −56R |
A partial close did not increase profit in any variant: it lifts the win rate to 51% and trims the drawdown a little, but the total drops by 20–110R. In this model the profit comes from rare long moves, and a partial close cuts them short. Moving to breakeven at 1R changes almost nothing (+322R vs +315R). If a partial close is easier for you psychologically, the best compromise is 30% at 2R.
Trade examples step by step
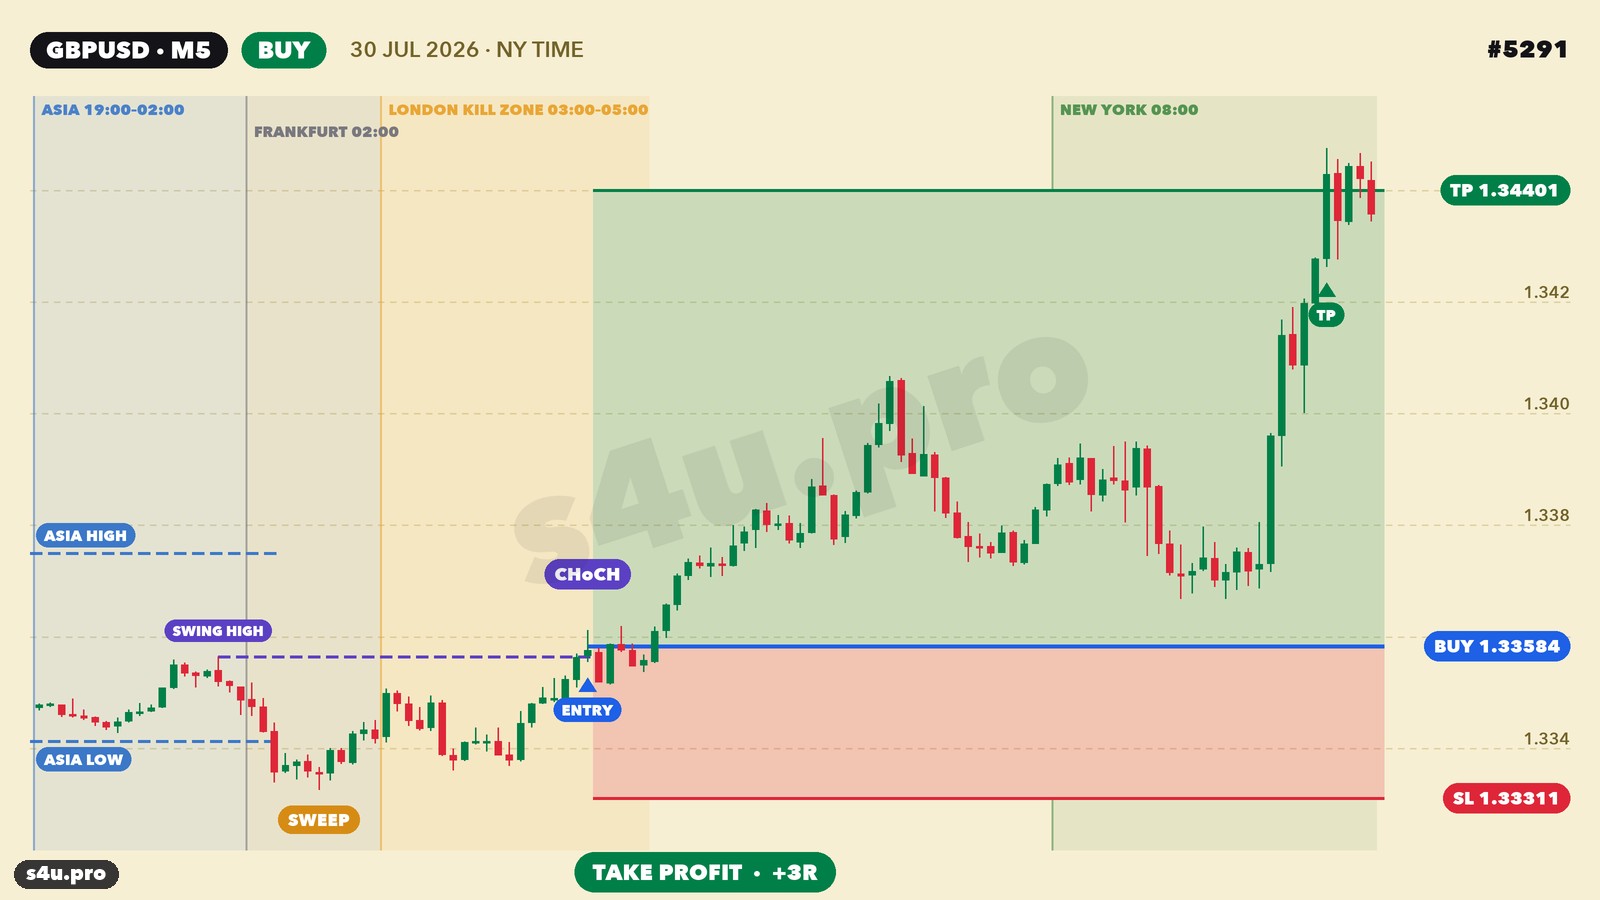
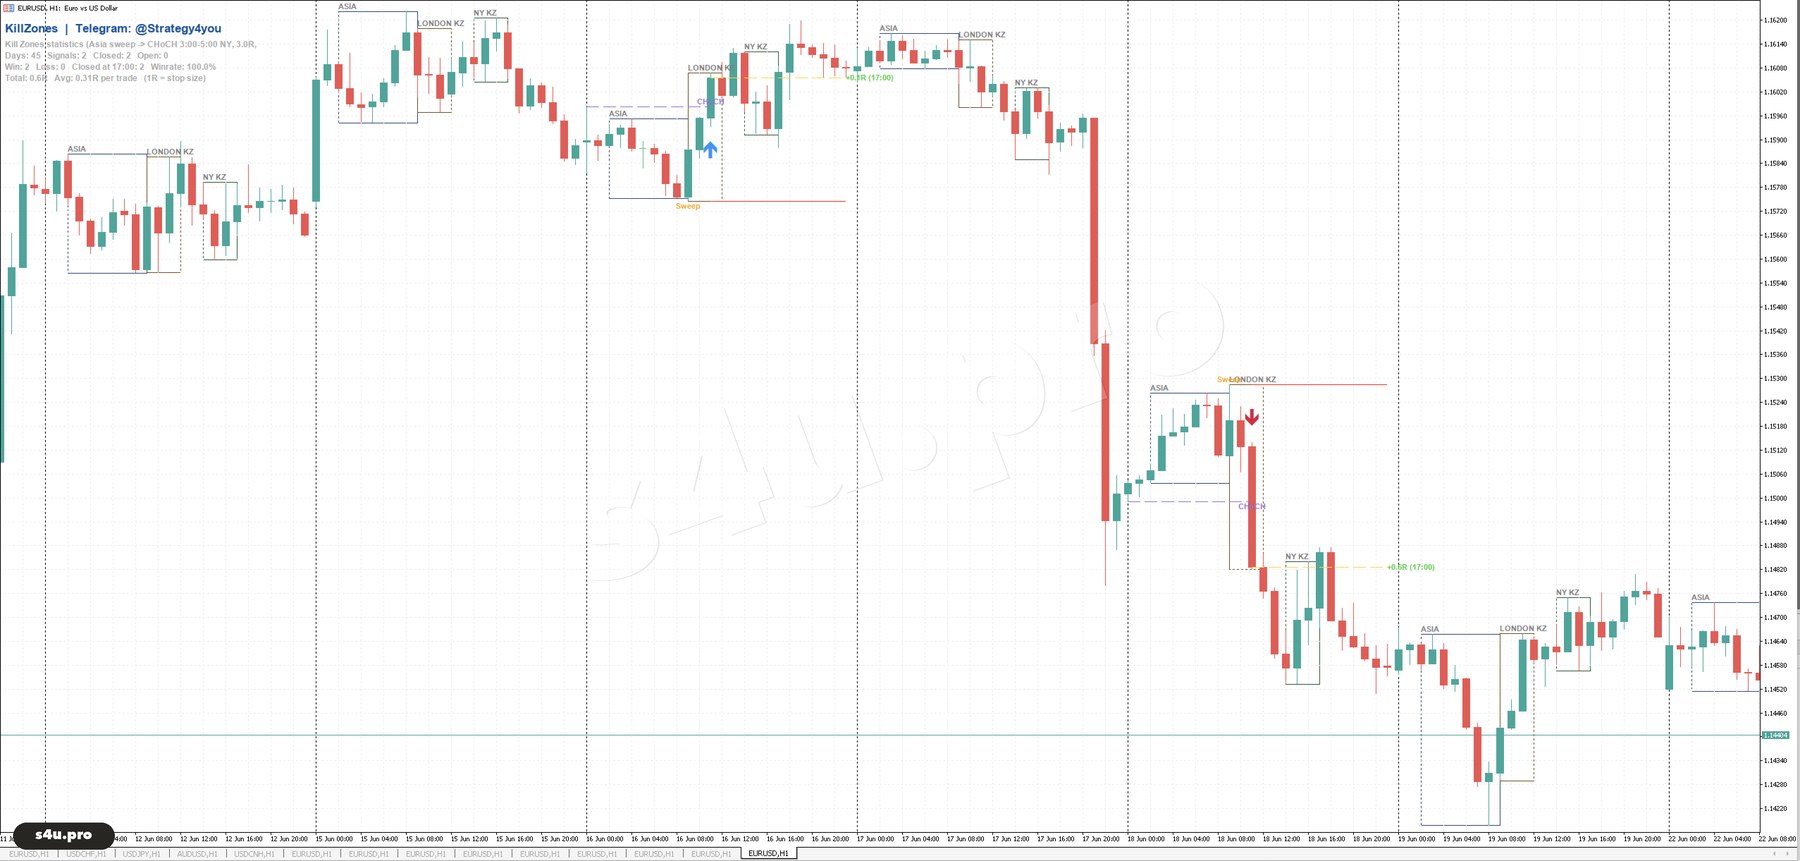
GBPUSD, 30 July 2026. Asia built a range, Frankfurt swept its low. At 04:30 an M5 candle closed above the last high — CHoCH, buy. Price rallied all day and hit the +3R target at 10:00.
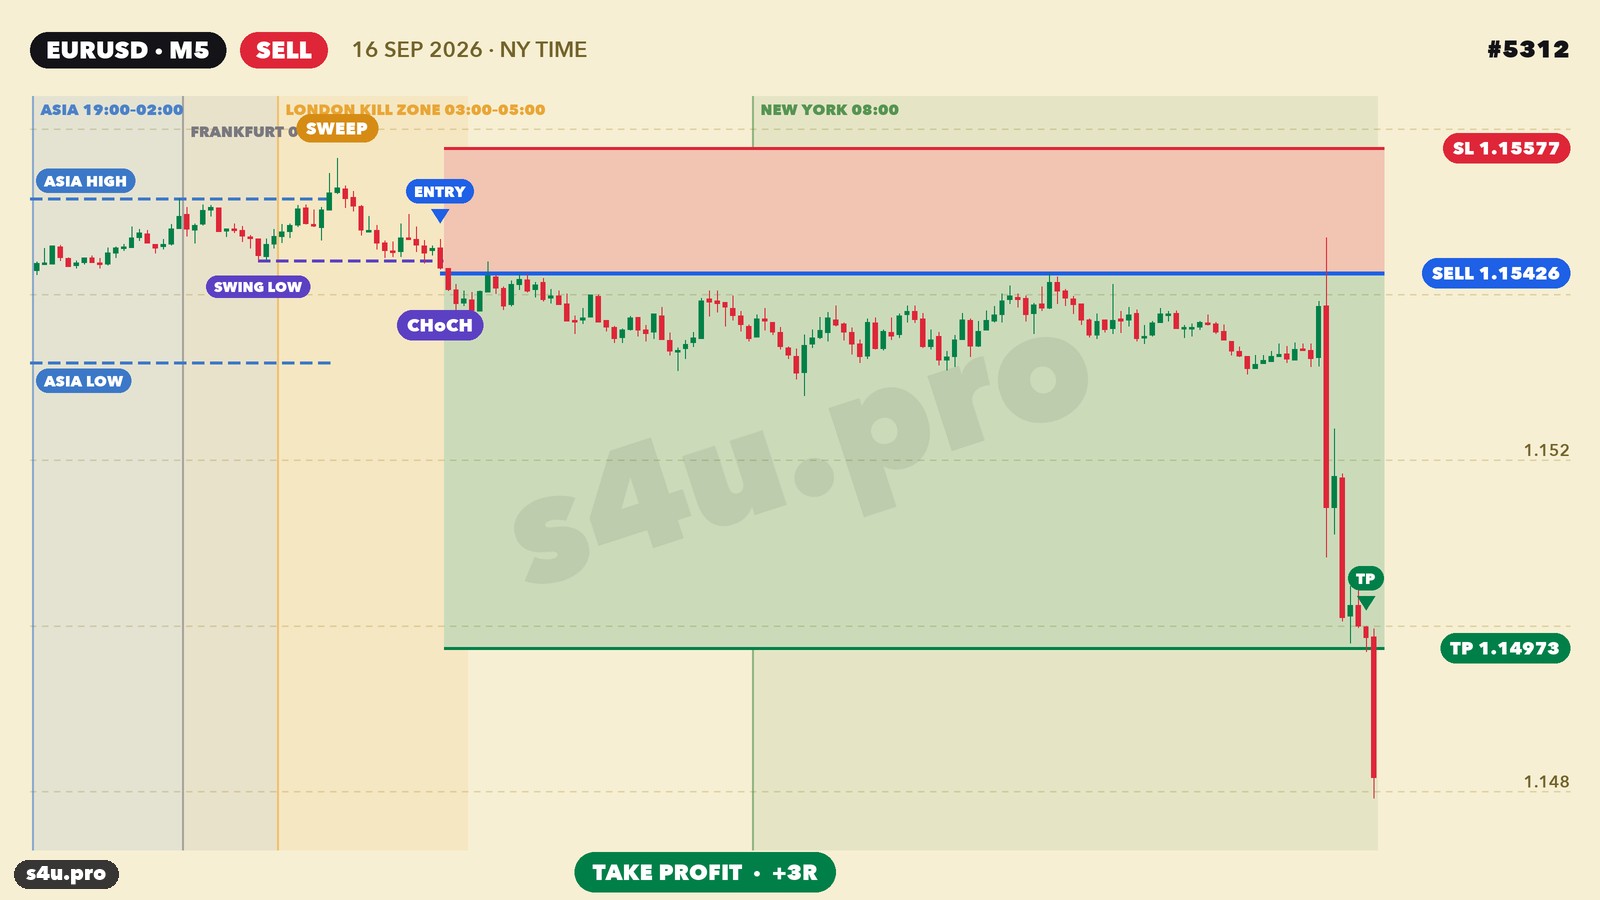
EURUSD, 16 September 2026. In the London Kill Zone price swept the Asian high and broke structure down. Most of the day price went nowhere, and the move came in New York — +3R at 14:25.
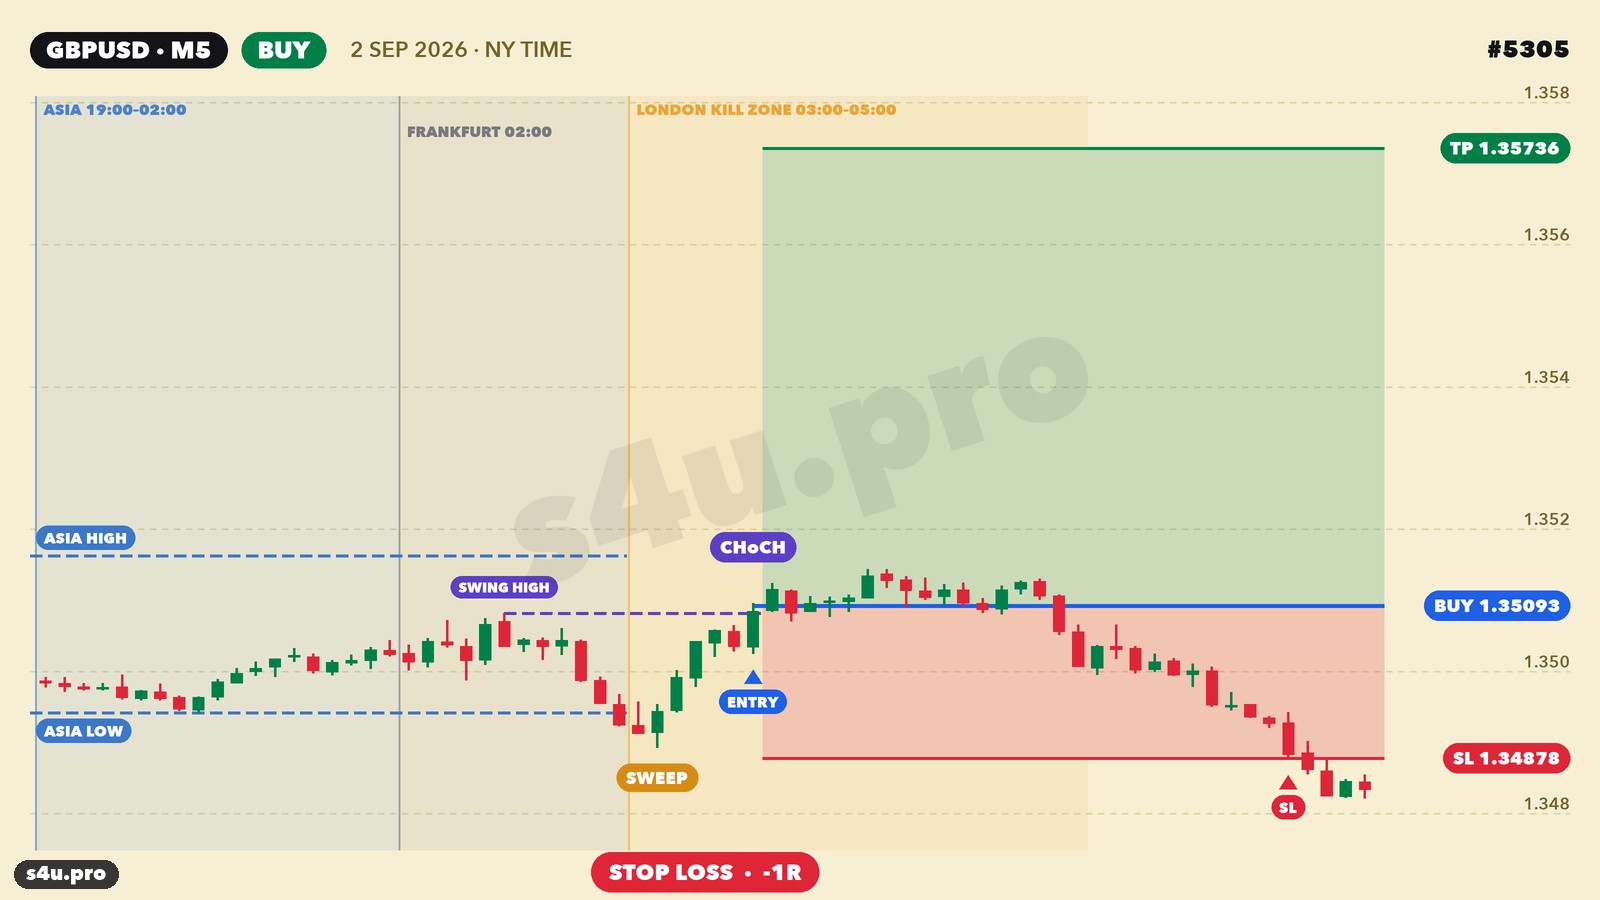
GBPUSD, 2 September 2026. Asian low swept, CHoCH up, buy — but price did not follow and hit the stop at 05:50. Most trades look like this: the profit comes from rare long moves and time exits.
Gallery: all 2025–2026 trades
All 409 trades of 2025–2026: 41 targets, 202 stops, 166 exits at 17:00, total +21.4R. Click a picture to open the chart.
| # | Market | Entry | Side | Entry price | Stop | Target | Exit | Result | R | Chart |
|---|---|---|---|---|---|---|---|---|---|---|
| 4926 | GBPJPY | 03.01.25 | BUY | 194.999 | 194.607 | 196.175 | 195.385 | 17:00 | +0.98R | |
| 4927 | GBPUSD | 07.01.25 | SELL | 1.25326 | 1.25640 | 1.24386 | 1.25640 | SL | -1.00R | |
| 4928 | GBPJPY | 07.01.25 | BUY | 197.953 | 197.288 | 199.948 | 197.288 | SL | -1.00R | |
| 4929 | EURUSD | 09.01.25 | BUY | 1.03157 | 1.02824 | 1.04156 | 1.02984 | 17:00 | -0.52R | |
| 4930 | EURJPY | 10.01.25 | SELL | 162.657 | 163.209 | 161.003 | 161.597 | 17:00 | +1.92R | |
| 4931 | EURJPY | 13.01.25 | BUY | 161.087 | 160.619 | 162.489 | 160.619 | SL | -1.00R | |
| 4932 | EURUSD | 13.01.25 | BUY | 1.02249 | 1.02062 | 1.02810 | 1.02062 | SL | -1.00R | |
| 4933 | GBPJPY | 13.01.25 | BUY | 191.656 | 190.761 | 194.341 | 190.761 | SL | -1.00R | |
| 4934 | GBPUSD | 13.01.25 | BUY | 1.21667 | 1.21212 | 1.23030 | 1.21212 | SL | -1.00R | |
| 4935 | GBPUSD | 14.01.25 | SELL | 1.22008 | 1.22472 | 1.20614 | 1.22123 | 17:00 | -0.25R | |
| 4936 | EURUSD | 16.01.25 | SELL | 1.02823 | 1.03026 | 1.02214 | 1.03026 | SL | -1.00R | |
| 4937 | EURUSD | 17.01.25 | BUY | 1.02925 | 1.02764 | 1.03408 | 1.02764 | SL | -1.00R | |
| 4938 | GBPJPY | 20.01.25 | SELL | 190.387 | 190.897 | 188.857 | 190.897 | SL | -1.00R | |
| 4939 | GBPJPY | 22.01.25 | BUY | 192.366 | 191.661 | 194.481 | 192.755 | 17:00 | +0.55R | |
| 4940 | GBPUSD | 22.01.25 | BUY | 1.23472 | 1.23096 | 1.24598 | 1.23096 | SL | -1.00R | |
| 4941 | EURUSD | 23.01.25 | BUY | 1.04142 | 1.03887 | 1.04907 | 1.03887 | SL | -1.00R | |
| 4942 | GBPUSD | 27.01.25 | BUY | 1.24592 | 1.24240 | 1.25650 | 1.24952 | 17:00 | +1.02R | |
| 4943 | EURJPY | 28.01.25 | SELL | 162.344 | 162.724 | 161.202 | 162.218 | 17:00 | +0.33R | |
| 4944 | GBPJPY | 28.01.25 | SELL | 193.523 | 194.002 | 192.086 | 194.002 | SL | -1.00R | |
| 4945 | GBPUSD | 28.01.25 | BUY | 1.24521 | 1.24242 | 1.25356 | 1.24242 | SL | -1.00R | |
| 4946 | EURUSD | 28.01.25 | BUY | 1.04420 | 1.04182 | 1.05134 | 1.04182 | SL | -1.00R | |
| 4947 | GBPJPY | 30.01.25 | BUY | 192.476 | 191.959 | 194.027 | 191.959 | SL | -1.00R | |
| 4948 | GBPJPY | 31.01.25 | SELL | 192.133 | 192.490 | 191.062 | 192.490 | SL | -1.00R | |
| 4949 | EURJPY | 31.01.25 | SELL | 160.629 | 161.066 | 159.316 | 161.066 | SL | -1.00R | |
| 4950 | EURUSD | 31.01.25 | SELL | 1.03860 | 1.04137 | 1.03029 | 1.04137 | SL | -1.00R | |
| 4951 | GBPUSD | 31.01.25 | SELL | 1.24160 | 1.24408 | 1.23414 | 1.24408 | SL | -1.00R | |
| 4952 | GBPJPY | 04.02.25 | SELL | 192.495 | 193.195 | 190.395 | 192.555 | 17:00 | -0.09R | |
| 4953 | GBPUSD | 10.02.25 | SELL | 1.23950 | 1.24157 | 1.23331 | 1.24157 | SL | -1.00R | |
| 4954 | EURJPY | 11.02.25 | SELL | 156.462 | 156.767 | 155.545 | 156.767 | SL | -1.00R | |
| 4955 | GBPJPY | 11.02.25 | BUY | 187.835 | 187.213 | 189.701 | 189.701 | TP | +3.00R | |
| 4956 | GBPUSD | 11.02.25 | BUY | 1.23667 | 1.23306 | 1.24752 | 1.24430 | 17:00 | +2.11R | |
| 4957 | GBPUSD | 12.02.25 | SELL | 1.24394 | 1.24667 | 1.23577 | 1.24667 | SL | -1.00R | |
| 4958 | GBPJPY | 12.02.25 | SELL | 190.847 | 191.760 | 188.108 | 191.760 | SL | -1.00R | |
| 4959 | GBPUSD | 13.02.25 | SELL | 1.24832 | 1.25185 | 1.23775 | 1.25185 | SL | -1.00R | |
| 4960 | GBPJPY | 13.02.25 | SELL | 192.299 | 193.079 | 189.959 | 191.977 | 17:00 | +0.41R | |
| 4961 | EURJPY | 18.02.25 | SELL | 158.823 | 159.216 | 157.642 | 158.839 | 17:00 | -0.04R | |
| 4962 | GBPUSD | 18.02.25 | SELL | 1.26042 | 1.26243 | 1.25437 | 1.26123 | 17:00 | -0.40R | |
| 4963 | GBPJPY | 18.02.25 | SELL | 191.353 | 191.969 | 189.505 | 191.762 | 17:00 | -0.66R | |
| 4964 | GBPJPY | 19.02.25 | BUY | 191.648 | 191.197 | 193.001 | 191.197 | SL | -1.00R | |
| 4965 | GBPUSD | 19.02.25 | SELL | 1.26094 | 1.26374 | 1.25256 | 1.25853 | 17:00 | +0.86R | |
| 4966 | EURJPY | 20.02.25 | BUY | 156.870 | 156.293 | 158.603 | 157.129 | 17:00 | +0.45R | |
| 4967 | GBPJPY | 20.02.25 | BUY | 189.441 | 188.758 | 191.490 | 188.758 | SL | -1.00R | |
| 4968 | GBPJPY | 21.02.25 | SELL | 190.327 | 190.963 | 188.419 | 188.419 | TP | +3.00R | |
| 4969 | GBPUSD | 21.02.25 | SELL | 1.26530 | 1.26799 | 1.25721 | 1.26282 | 17:00 | +0.92R | |
| 4970 | GBPJPY | 26.02.25 | SELL | 188.796 | 189.274 | 187.362 | 189.274 | SL | -1.00R | |
| 4971 | GBPUSD | 03.03.25 | BUY | 1.26151 | 1.25804 | 1.27190 | 1.27190 | TP | +3.00R | |
| 4972 | EURUSD | 03.03.25 | BUY | 1.04172 | 1.03871 | 1.05075 | 1.04850 | 17:00 | +2.25R | |
| 4973 | GBPJPY | 03.03.25 | BUY | 189.822 | 188.781 | 192.945 | 189.822 | 17:00 | +0.00R | |
| 4974 | EURJPY | 03.03.25 | BUY | 156.766 | 155.892 | 159.390 | 156.743 | 17:00 | -0.03R | |
| 4975 | EURUSD | 06.03.25 | SELL | 1.07862 | 1.08233 | 1.06749 | 1.08233 | SL | -1.00R | |
| 4976 | EURUSD | 10.03.25 | BUY | 1.08463 | 1.08039 | 1.09735 | 1.08336 | 17:00 | -0.30R | |
| 4977 | EURUSD | 12.03.25 | BUY | 1.09120 | 1.08860 | 1.09900 | 1.08860 | SL | -1.00R | |
| 4978 | GBPUSD | 12.03.25 | BUY | 1.29361 | 1.29117 | 1.30091 | 1.29597 | 17:00 | +0.97R | |
| 4979 | GBPUSD | 13.03.25 | BUY | 1.29635 | 1.29397 | 1.30347 | 1.29397 | SL | -1.00R | |
| 4980 | EURJPY | 13.03.25 | BUY | 160.903 | 160.390 | 162.444 | 160.390 | SL | -1.00R | |
| 4981 | GBPJPY | 13.03.25 | BUY | 191.675 | 191.128 | 193.316 | 191.128 | SL | -1.00R | |
| 4982 | EURUSD | 14.03.25 | BUY | 1.08523 | 1.08292 | 1.09216 | 1.08759 | 17:00 | +1.02R | |
| 4983 | EURUSD | 17.03.25 | BUY | 1.08851 | 1.08673 | 1.09385 | 1.09206 | 17:00 | +1.99R | |
| 4984 | GBPJPY | 20.03.25 | BUY | 192.826 | 192.472 | 193.888 | 192.472 | SL | -1.00R | |
| 4985 | EURJPY | 24.03.25 | SELL | 162.012 | 162.599 | 160.249 | 162.599 | SL | -1.00R | |
| 4986 | GBPUSD | 25.03.25 | BUY | 1.29239 | 1.29002 | 1.29948 | 1.29436 | 17:00 | +0.84R | |
| 4987 | EURUSD | 25.03.25 | BUY | 1.08030 | 1.07755 | 1.08855 | 1.07902 | 17:00 | -0.47R | |
| 4988 | EURJPY | 26.03.25 | SELL | 162.181 | 162.458 | 161.352 | 162.458 | SL | -1.00R | |
| 4989 | EURUSD | 31.03.25 | SELL | 1.08223 | 1.08504 | 1.07380 | 1.08157 | 17:00 | +0.23R | |
| 4990 | GBPUSD | 31.03.25 | SELL | 1.29458 | 1.29740 | 1.28614 | 1.29178 | 17:00 | +1.00R | |
| 4991 | EURUSD | 02.04.25 | BUY | 1.07975 | 1.07788 | 1.08536 | 1.08536 | TP | +3.00R | |
| 4992 | GBPUSD | 02.04.25 | BUY | 1.29209 | 1.28987 | 1.29877 | 1.29877 | TP | +3.00R | |
| 4993 | GBPUSD | 07.04.25 | SELL | 1.28817 | 1.29352 | 1.27214 | 1.27214 | TP | +3.00R | |
| 4994 | EURUSD | 07.04.25 | SELL | 1.09696 | 1.10510 | 1.07254 | 1.09060 | 17:00 | +0.78R | |
| 4995 | EURUSD | 08.04.25 | SELL | 1.09471 | 1.09928 | 1.08100 | 1.09540 | 17:00 | -0.15R | |
| 4996 | GBPUSD | 08.04.25 | SELL | 1.27565 | 1.27976 | 1.26334 | 1.27976 | SL | -1.00R | |
| 4997 | GBPUSD | 09.04.25 | SELL | 1.28102 | 1.28653 | 1.26451 | 1.28188 | 17:00 | -0.16R | |
| 4998 | EURUSD | 09.04.25 | SELL | 1.10347 | 1.10909 | 1.08661 | 1.10909 | SL | -1.00R | |
| 4999 | GBPUSD | 10.04.25 | SELL | 1.28459 | 1.28778 | 1.27504 | 1.28778 | SL | -1.00R | |
| 5000 | GBPJPY | 10.04.25 | SELL | 188.364 | 189.447 | 185.115 | 187.314 | 17:00 | +0.97R | |
| 5001 | EURJPY | 15.04.25 | BUY | 162.657 | 162.046 | 164.492 | 162.046 | SL | -1.00R | |
| 5002 | GBPJPY | 16.04.25 | BUY | 189.277 | 188.513 | 191.569 | 188.513 | SL | -1.00R | |
| 5003 | EURUSD | 16.04.25 | SELL | 1.13487 | 1.13932 | 1.12152 | 1.13932 | SL | -1.00R | |
| 5004 | EURUSD | 17.04.25 | BUY | 1.13766 | 1.13421 | 1.14801 | 1.13421 | SL | -1.00R | |
| 5005 | EURJPY | 23.04.25 | BUY | 161.770 | 161.134 | 163.680 | 162.280 | 17:00 | +0.80R | |
| 5006 | GBPJPY | 24.04.25 | BUY | 189.770 | 189.264 | 191.288 | 190.184 | 17:00 | +0.82R | |
| 5007 | GBPJPY | 25.04.25 | SELL | 190.654 | 191.268 | 188.812 | 191.268 | SL | -1.00R | |
| 5008 | EURJPY | 25.04.25 | SELL | 162.675 | 163.174 | 161.176 | 163.174 | SL | -1.00R | |
| 5009 | EURUSD | 30.04.25 | SELL | 1.13648 | 1.14006 | 1.12574 | 1.13280 | 17:00 | +1.03R | |
| 5010 | GBPUSD | 01.05.25 | BUY | 1.33035 | 1.32730 | 1.33952 | 1.32730 | SL | -1.00R | |
| 5011 | EURUSD | 01.05.25 | BUY | 1.13199 | 1.12862 | 1.14210 | 1.12862 | SL | -1.00R | |
| 5012 | EURJPY | 06.05.25 | SELL | 162.581 | 162.975 | 161.397 | 161.929 | 17:00 | +1.65R | |
| 5013 | GBPUSD | 07.05.25 | SELL | 1.33350 | 1.33686 | 1.32344 | 1.33686 | SL | -1.00R | |
| 5014 | EURJPY | 09.05.25 | BUY | 163.510 | 163.206 | 164.420 | 163.206 | SL | -1.00R | |
| 5015 | GBPJPY | 09.05.25 | BUY | 192.756 | 192.316 | 194.076 | 193.318 | 17:00 | +1.28R | |
| 5016 | GBPUSD | 12.05.25 | SELL | 1.32588 | 1.33005 | 1.31339 | 1.31751 | 17:00 | +2.01R | |
| 5017 | GBPUSD | 14.05.25 | BUY | 1.33120 | 1.32891 | 1.33809 | 1.32891 | SL | -1.00R | |
| 5018 | GBPUSD | 16.05.25 | SELL | 1.33163 | 1.33338 | 1.32640 | 1.32640 | TP | +3.00R | |
| 5019 | EURUSD | 16.05.25 | SELL | 1.12013 | 1.12207 | 1.11431 | 1.11431 | TP | +3.00R | |
| 5020 | EURUSD | 21.05.25 | SELL | 1.13187 | 1.13542 | 1.12122 | 1.13542 | SL | -1.00R | |
| 5021 | GBPUSD | 21.05.25 | SELL | 1.34122 | 1.34702 | 1.32384 | 1.34194 | 17:00 | -0.12R | |
| 5022 | EURJPY | 26.05.25 | SELL | 162.655 | 163.001 | 161.615 | 162.651 | 17:00 | +0.01R | |
| 5023 | EURJPY | 29.05.25 | SELL | 163.877 | 164.283 | 162.661 | 163.876 | 17:00 | +0.00R | |
| 5024 | EURJPY | 06.06.25 | SELL | 164.454 | 164.805 | 163.399 | 164.805 | SL | -1.00R | |
| 5025 | EURUSD | 11.06.25 | BUY | 1.14233 | 1.14040 | 1.14812 | 1.14812 | TP | +3.00R | |
| 5026 | GBPUSD | 11.06.25 | BUY | 1.34967 | 1.34624 | 1.35994 | 1.35410 | 17:00 | +1.29R | |
| 5027 | EURJPY | 12.06.25 | BUY | 165.879 | 165.467 | 167.113 | 166.197 | 17:00 | +0.77R | |
| 5028 | GBPUSD | 13.06.25 | BUY | 1.35587 | 1.35197 | 1.36755 | 1.35197 | SL | -1.00R | |
| 5029 | EURUSD | 17.06.25 | SELL | 1.15467 | 1.15735 | 1.14663 | 1.15735 | SL | -1.00R | |
| 5030 | EURJPY | 17.06.25 | SELL | 167.159 | 167.637 | 165.723 | 166.785 | 17:00 | +0.78R | |
| 5031 | EURUSD | 19.06.25 | BUY | 1.14682 | 1.14449 | 1.15381 | 1.14936 | 17:00 | +1.09R | |
| 5032 | GBPUSD | 19.06.25 | BUY | 1.34123 | 1.33809 | 1.35067 | 1.34617 | 17:00 | +1.57R | |
| 5033 | EURJPY | 23.06.25 | SELL | 169.087 | 169.688 | 167.282 | 169.688 | SL | -1.00R | |
| 5034 | EURUSD | 23.06.25 | SELL | 1.14867 | 1.15223 | 1.13799 | 1.15223 | SL | -1.00R | |
| 5035 | GBPUSD | 23.06.25 | SELL | 1.34234 | 1.34500 | 1.33438 | 1.34500 | SL | -1.00R | |
| 5036 | EURUSD | 24.06.25 | SELL | 1.15914 | 1.16233 | 1.14957 | 1.16233 | SL | -1.00R | |
| 5037 | GBPJPY | 24.06.25 | BUY | 197.347 | 196.908 | 198.664 | 197.264 | 17:00 | -0.19R | |
| 5038 | GBPUSD | 25.06.25 | SELL | 1.36082 | 1.36349 | 1.35283 | 1.36349 | SL | -1.00R | |
| 5039 | GBPJPY | 27.06.25 | BUY | 198.498 | 198.072 | 199.776 | 198.072 | SL | -1.00R | |
| 5040 | EURUSD | 30.06.25 | SELL | 1.17187 | 1.17518 | 1.16194 | 1.17518 | SL | -1.00R | |
| 5041 | GBPUSD | 01.07.25 | SELL | 1.37372 | 1.37515 | 1.36941 | 1.37515 | SL | -1.00R | |
| 5042 | EURUSD | 01.07.25 | BUY | 1.17936 | 1.17661 | 1.18761 | 1.17661 | SL | -1.00R | |
| 5043 | GBPJPY | 02.07.25 | SELL | 197.261 | 197.575 | 196.319 | 196.319 | TP | +3.00R | |
| 5044 | GBPUSD | 04.07.25 | SELL | 1.36634 | 1.36826 | 1.36060 | 1.36390 | 17:00 | +1.28R | |
| 5045 | GBPUSD | 08.07.25 | SELL | 1.36225 | 1.36477 | 1.35471 | 1.35471 | TP | +3.00R | |
| 5046 | GBPJPY | 09.07.25 | SELL | 199.590 | 199.853 | 198.801 | 198.801 | TP | +3.00R | |
| 5047 | GBPUSD | 10.07.25 | SELL | 1.36023 | 1.36207 | 1.35473 | 1.35473 | TP | +3.00R | |
| 5048 | EURUSD | 14.07.25 | BUY | 1.16793 | 1.16529 | 1.17585 | 1.16634 | 17:00 | -0.60R | |
| 5049 | GBPUSD | 14.07.25 | BUY | 1.34828 | 1.34499 | 1.35817 | 1.34499 | SL | -1.00R | |
| 5050 | GBPJPY | 14.07.25 | BUY | 198.649 | 198.067 | 200.395 | 198.263 | 17:00 | -0.66R | |
| 5051 | EURJPY | 14.07.25 | BUY | 172.070 | 171.700 | 173.182 | 172.256 | 17:00 | +0.50R | |
| 5052 | GBPUSD | 15.07.25 | SELL | 1.34301 | 1.34449 | 1.33855 | 1.34449 | SL | -1.00R | |
| 5053 | EURUSD | 16.07.25 | SELL | 1.16133 | 1.16293 | 1.15653 | 1.15653 | TP | +3.00R | |
| 5054 | GBPUSD | 17.07.25 | BUY | 1.34018 | 1.33724 | 1.34902 | 1.34129 | 17:00 | +0.37R | |
| 5055 | EURUSD | 18.07.25 | BUY | 1.16278 | 1.16107 | 1.16791 | 1.16201 | 17:00 | -0.45R | |
| 5056 | GBPJPY | 21.07.25 | BUY | 199.131 | 198.528 | 200.940 | 198.528 | SL | -1.00R | |
| 5057 | GBPJPY | 22.07.25 | SELL | 198.916 | 199.316 | 197.716 | 197.716 | TP | +3.00R | |
| 5058 | EURUSD | 22.07.25 | BUY | 1.16970 | 1.16803 | 1.17471 | 1.16803 | SL | -1.00R | |
| 5059 | GBPUSD | 22.07.25 | BUY | 1.34876 | 1.34600 | 1.35702 | 1.35271 | 17:00 | +1.43R | |
| 5060 | GBPJPY | 25.07.25 | BUY | 198.679 | 198.095 | 200.431 | 198.342 | 17:00 | -0.58R | |
| 5061 | GBPJPY | 29.07.25 | BUY | 198.051 | 197.696 | 199.116 | 198.136 | 17:00 | +0.24R | |
| 5062 | EURUSD | 30.07.25 | BUY | 1.15657 | 1.15387 | 1.16467 | 1.15387 | SL | -1.00R | |
| 5063 | EURJPY | 30.07.25 | BUY | 171.073 | 170.837 | 171.783 | 170.837 | SL | -1.00R | |
| 5064 | GBPUSD | 31.07.25 | SELL | 1.32607 | 1.32834 | 1.31928 | 1.31928 | TP | +3.00R | |
| 5065 | EURUSD | 01.08.25 | SELL | 1.14128 | 1.14392 | 1.13336 | 1.14392 | SL | -1.00R | |
| 5066 | EURUSD | 05.08.25 | BUY | 1.15594 | 1.15416 | 1.16128 | 1.15416 | SL | -1.00R | |
| 5067 | GBPJPY | 06.08.25 | BUY | 196.321 | 196.062 | 197.098 | 196.762 | 17:00 | +1.70R | |
| 5068 | EURUSD | 06.08.25 | SELL | 1.15724 | 1.15894 | 1.15214 | 1.15894 | SL | -1.00R | |
| 5069 | GBPUSD | 11.08.25 | SELL | 1.34603 | 1.34779 | 1.34073 | 1.34073 | TP | +3.00R | |
| 5070 | GBPJPY | 11.08.25 | SELL | 198.553 | 198.828 | 197.728 | 198.828 | SL | -1.00R | |
| 5071 | GBPJPY | 14.08.25 | BUY | 198.997 | 198.559 | 200.311 | 199.841 | 17:00 | +1.93R | |
| 5072 | GBPJPY | 19.08.25 | BUY | 199.606 | 199.219 | 200.767 | 199.219 | SL | -1.00R | |
| 5073 | EURJPY | 20.08.25 | BUY | 171.716 | 171.088 | 173.602 | 171.631 | 17:00 | -0.14R | |
| 5074 | EURUSD | 21.08.25 | BUY | 1.16529 | 1.16237 | 1.17405 | 1.16237 | SL | -1.00R | |
| 5075 | GBPUSD | 21.08.25 | BUY | 1.34699 | 1.34336 | 1.35790 | 1.34336 | SL | -1.00R | |
| 5076 | GBPJPY | 22.08.25 | BUY | 199.158 | 198.817 | 200.181 | 198.817 | SL | -1.00R | |
| 5077 | EURJPY | 22.08.25 | BUY | 172.420 | 172.027 | 173.601 | 172.027 | SL | -1.00R | |
| 5078 | GBPUSD | 25.08.25 | SELL | 1.35052 | 1.35285 | 1.34355 | 1.34537 | 17:00 | +2.22R | |
| 5079 | EURUSD | 25.08.25 | SELL | 1.16969 | 1.17216 | 1.16228 | 1.16228 | TP | +3.00R | |
| 5080 | GBPJPY | 26.08.25 | SELL | 198.641 | 199.014 | 197.522 | 199.014 | SL | -1.00R | |
| 5081 | GBPUSD | 26.08.25 | BUY | 1.34686 | 1.34330 | 1.35756 | 1.34779 | 17:00 | +0.26R | |
| 5082 | EURUSD | 28.08.25 | BUY | 1.16478 | 1.16325 | 1.16937 | 1.16325 | SL | -1.00R | |
| 5083 | GBPJPY | 29.08.25 | SELL | 198.342 | 198.636 | 197.460 | 198.636 | SL | -1.00R | |
| 5084 | GBPUSD | 01.09.25 | SELL | 1.35166 | 1.35418 | 1.34408 | 1.35418 | SL | -1.00R | |
| 5085 | GBPJPY | 02.09.25 | SELL | 199.590 | 200.295 | 197.475 | 198.671 | 17:00 | +1.30R | |
| 5086 | EURJPY | 02.09.25 | SELL | 172.663 | 173.439 | 170.333 | 172.681 | 17:00 | -0.02R | |
| 5087 | EURUSD | 03.09.25 | SELL | 1.16163 | 1.16441 | 1.15329 | 1.16441 | SL | -1.00R | |
| 5088 | GBPUSD | 03.09.25 | SELL | 1.33349 | 1.33921 | 1.31635 | 1.33921 | SL | -1.00R | |
| 5089 | GBPUSD | 04.09.25 | BUY | 1.34435 | 1.34147 | 1.35301 | 1.34312 | 17:00 | -0.43R | |
| 5090 | GBPJPY | 09.09.25 | BUY | 199.757 | 199.363 | 200.939 | 199.363 | SL | -1.00R | |
| 5091 | EURJPY | 10.09.25 | SELL | 172.457 | 172.769 | 171.519 | 172.769 | SL | -1.00R | |
| 5092 | GBPUSD | 12.09.25 | BUY | 1.35695 | 1.35430 | 1.36488 | 1.35430 | SL | -1.00R | |
| 5093 | GBPJPY | 12.09.25 | BUY | 200.032 | 199.625 | 201.253 | 200.134 | 17:00 | +0.25R | |
| 5094 | EURUSD | 12.09.25 | SELL | 1.17204 | 1.17487 | 1.16355 | 1.17307 | 17:00 | -0.36R | |
| 5095 | EURUSD | 15.09.25 | BUY | 1.17331 | 1.17148 | 1.17880 | 1.17603 | 17:00 | +1.49R | |
| 5096 | EURJPY | 16.09.25 | BUY | 173.263 | 172.992 | 174.078 | 173.790 | 17:00 | +1.94R | |
| 5097 | GBPJPY | 16.09.25 | BUY | 200.338 | 200.037 | 201.241 | 200.037 | SL | -1.00R | |
| 5098 | EURUSD | 18.09.25 | BUY | 1.18043 | 1.17790 | 1.18802 | 1.17790 | SL | -1.00R | |
| 5099 | GBPUSD | 18.09.25 | BUY | 1.36126 | 1.35846 | 1.36964 | 1.35846 | SL | -1.00R | |
| 5100 | GBPJPY | 23.09.25 | BUY | 199.712 | 199.508 | 200.324 | 199.508 | SL | -1.00R | |
| 5101 | GBPJPY | 24.09.25 | SELL | 199.651 | 199.920 | 198.844 | 199.920 | SL | -1.00R | |
| 5102 | EURJPY | 25.09.25 | SELL | 174.619 | 174.893 | 173.795 | 174.893 | SL | -1.00R | |
| 5103 | GBPJPY | 25.09.25 | SELL | 200.023 | 200.375 | 198.967 | 199.856 | 17:00 | +0.47R | |
| 5104 | GBPUSD | 25.09.25 | SELL | 1.34457 | 1.34684 | 1.33774 | 1.33774 | TP | +3.00R | |
| 5105 | GBPUSD | 26.09.25 | SELL | 1.33485 | 1.33710 | 1.32808 | 1.33710 | SL | -1.00R | |
| 5106 | EURUSD | 01.10.25 | SELL | 1.17420 | 1.17797 | 1.16289 | 1.17300 | 17:00 | +0.32R | |
| 5107 | EURJPY | 02.10.25 | SELL | 172.617 | 173.005 | 171.451 | 172.481 | 17:00 | +0.35R | |
| 5108 | GBPUSD | 06.10.25 | SELL | 1.34296 | 1.34655 | 1.33221 | 1.34655 | SL | -1.00R | |
| 5109 | EURJPY | 08.10.25 | BUY | 177.163 | 176.868 | 178.050 | 177.505 | 17:00 | +1.15R | |
| 5110 | EURUSD | 08.10.25 | BUY | 1.16253 | 1.16056 | 1.16844 | 1.16056 | SL | -1.00R | |
| 5111 | EURJPY | 09.10.25 | SELL | 177.518 | 177.959 | 176.193 | 176.992 | 17:00 | +1.19R | |
| 5112 | EURJPY | 10.10.25 | BUY | 176.983 | 176.307 | 179.013 | 176.307 | SL | -1.00R | |
| 5113 | EURUSD | 13.10.25 | SELL | 1.16104 | 1.16309 | 1.15489 | 1.15697 | 17:00 | +1.99R | |
| 5114 | GBPUSD | 13.10.25 | SELL | 1.33352 | 1.33676 | 1.32382 | 1.33326 | 17:00 | +0.08R | |
| 5115 | EURJPY | 15.10.25 | BUY | 175.904 | 175.409 | 177.391 | 175.909 | 17:00 | +0.01R | |
| 5116 | GBPUSD | 15.10.25 | SELL | 1.33441 | 1.33747 | 1.32525 | 1.33747 | SL | -1.00R | |
| 5117 | EURJPY | 16.10.25 | SELL | 175.996 | 176.385 | 174.827 | 176.385 | SL | -1.00R | |
| 5118 | EURJPY | 20.10.25 | BUY | 175.904 | 175.571 | 176.905 | 175.571 | SL | -1.00R | |
| 5119 | GBPUSD | 21.10.25 | BUY | 1.33954 | 1.33703 | 1.34709 | 1.33703 | SL | -1.00R | |
| 5120 | EURJPY | 24.10.25 | SELL | 177.427 | 177.654 | 176.744 | 177.654 | SL | -1.00R | |
| 5121 | GBPJPY | 24.10.25 | SELL | 203.530 | 203.971 | 202.207 | 203.971 | SL | -1.00R | |
| 5122 | GBPUSD | 24.10.25 | SELL | 1.33093 | 1.33348 | 1.32330 | 1.33348 | SL | -1.00R | |
| 5123 | EURUSD | 27.10.25 | BUY | 1.16302 | 1.16164 | 1.16716 | 1.16441 | 17:00 | +1.01R | |
| 5124 | GBPUSD | 27.10.25 | BUY | 1.33354 | 1.33088 | 1.34150 | 1.33353 | 17:00 | -0.00R | |
| 5125 | EURUSD | 29.10.25 | BUY | 1.16353 | 1.16173 | 1.16893 | 1.16173 | SL | -1.00R | |
| 5126 | EURUSD | 31.10.25 | BUY | 1.15746 | 1.15536 | 1.16376 | 1.15536 | SL | -1.00R | |
| 5127 | EURJPY | 03.11.25 | SELL | 177.752 | 178.001 | 177.007 | 177.657 | 17:00 | +0.38R | |
| 5128 | GBPUSD | 04.11.25 | SELL | 1.31109 | 1.31405 | 1.30223 | 1.30223 | TP | +3.00R | |
| 5129 | EURUSD | 04.11.25 | SELL | 1.15085 | 1.15346 | 1.14302 | 1.14824 | 17:00 | +1.00R | |
| 5130 | GBPJPY | 06.11.25 | SELL | 200.776 | 201.225 | 199.429 | 201.225 | SL | -1.00R | |
| 5131 | EURUSD | 06.11.25 | SELL | 1.15057 | 1.15173 | 1.14709 | 1.15173 | SL | -1.00R | |
| 5132 | GBPJPY | 07.11.25 | SELL | 201.198 | 201.415 | 200.547 | 201.415 | SL | -1.00R | |
| 5133 | GBPUSD | 12.11.25 | SELL | 1.31367 | 1.31566 | 1.30772 | 1.31327 | 17:00 | +0.20R | |
| 5134 | GBPJPY | 12.11.25 | SELL | 203.050 | 203.593 | 201.421 | 203.275 | 17:00 | -0.41R | |
| 5135 | EURUSD | 12.11.25 | SELL | 1.15734 | 1.15894 | 1.15254 | 1.15894 | SL | -1.00R | |
| 5136 | EURJPY | 13.11.25 | SELL | 179.364 | 179.837 | 177.943 | 179.837 | SL | -1.00R | |
| 5137 | EURJPY | 14.11.25 | SELL | 179.788 | 179.993 | 179.175 | 179.175 | TP | +3.00R | |
| 5138 | GBPUSD | 14.11.25 | BUY | 1.31926 | 1.31063 | 1.34513 | 1.31665 | 17:00 | -0.30R | |
| 5139 | EURUSD | 17.11.25 | SELL | 1.16033 | 1.16161 | 1.15649 | 1.15918 | 17:00 | +0.90R | |
| 5140 | EURJPY | 17.11.25 | SELL | 179.427 | 179.742 | 178.480 | 179.742 | SL | -1.00R | |
| 5141 | EURUSD | 18.11.25 | SELL | 1.15882 | 1.16074 | 1.15306 | 1.16074 | SL | -1.00R | |
| 5142 | EURUSD | 21.11.25 | SELL | 1.15369 | 1.15489 | 1.15009 | 1.15489 | SL | -1.00R | |
| 5143 | GBPUSD | 21.11.25 | BUY | 1.30987 | 1.30637 | 1.32035 | 1.30637 | SL | -1.00R | |
| 5144 | GBPJPY | 24.11.25 | SELL | 205.193 | 205.427 | 204.491 | 205.427 | SL | -1.00R | |
| 5145 | EURUSD | 05.12.25 | SELL | 1.16518 | 1.16729 | 1.15885 | 1.16394 | 17:00 | +0.59R | |
| 5146 | EURUSD | 09.12.25 | BUY | 1.16472 | 1.16322 | 1.16922 | 1.16322 | SL | -1.00R | |
| 5147 | GBPJPY | 11.12.25 | SELL | 208.404 | 208.683 | 207.567 | 208.237 | 17:00 | +0.60R | |
| 5148 | GBPJPY | 12.12.25 | BUY | 208.647 | 208.190 | 210.018 | 208.190 | SL | -1.00R | |
| 5149 | EURUSD | 15.12.25 | BUY | 1.17395 | 1.17252 | 1.17824 | 1.17515 | 17:00 | +0.84R | |
| 5150 | EURUSD | 16.12.25 | BUY | 1.17568 | 1.17430 | 1.17982 | 1.17982 | TP | +3.00R | |
| 5151 | GBPJPY | 18.12.25 | SELL | 208.132 | 208.582 | 206.782 | 208.582 | SL | -1.00R | |
| 5152 | GBPUSD | 19.12.25 | BUY | 1.33862 | 1.33610 | 1.34616 | 1.33610 | SL | -1.00R | |
| 5153 | EURJPY | 23.12.25 | BUY | 183.809 | 183.547 | 184.597 | 183.547 | SL | -1.00R | |
| 5154 | GBPJPY | 24.12.25 | BUY | 210.605 | 210.362 | 211.334 | 210.362 | SL | -1.00R | |
| 5155 | GBPUSD | 24.12.25 | BUY | 1.35225 | 1.35008 | 1.35874 | 1.35008 | SL | -1.00R | |
| 5156 | EURUSD | 24.12.25 | BUY | 1.18009 | 1.17785 | 1.18681 | 1.17785 | SL | -1.00R | |
| 5157 | EURJPY | 24.12.25 | BUY | 183.823 | 183.534 | 184.692 | 183.534 | SL | -1.00R | |
| 5158 | GBPJPY | 29.12.25 | BUY | 210.915 | 210.402 | 212.454 | 210.796 | 17:00 | -0.23R | |
| 5159 | GBPUSD | 29.12.25 | BUY | 1.35018 | 1.34720 | 1.35910 | 1.34720 | SL | -1.00R | |
| 5160 | GBPUSD | 31.12.25 | BUY | 1.34630 | 1.34494 | 1.35036 | 1.34494 | SL | -1.00R | |
| 5161 | EURJPY | 31.12.25 | BUY | 183.835 | 183.511 | 184.809 | 184.014 | 17:00 | +0.55R | |
| 5162 | EURUSD | 06.01.26 | SELL | 1.17273 | 1.17440 | 1.16772 | 1.16891 | 17:00 | +2.29R | |
| 5163 | GBPUSD | 06.01.26 | SELL | 1.35467 | 1.35689 | 1.34803 | 1.35011 | 17:00 | +2.06R | |
| 5164 | EURJPY | 07.01.26 | BUY | 182.957 | 182.682 | 183.784 | 182.974 | 17:00 | +0.06R | |
| 5165 | EURJPY | 08.01.26 | BUY | 183.043 | 182.688 | 184.110 | 182.688 | SL | -1.00R | |
| 5166 | GBPUSD | 13.01.26 | BUY | 1.34742 | 1.34605 | 1.35151 | 1.34605 | SL | -1.00R | |
| 5167 | EURUSD | 15.01.26 | BUY | 1.16389 | 1.16247 | 1.16815 | 1.16247 | SL | -1.00R | |
| 5168 | EURUSD | 19.01.26 | SELL | 1.16192 | 1.16424 | 1.15496 | 1.16424 | SL | -1.00R | |
| 5169 | GBPJPY | 20.01.26 | SELL | 212.467 | 213.522 | 209.302 | 212.534 | 17:00 | -0.06R | |
| 5170 | GBPJPY | 22.01.26 | SELL | 213.044 | 213.465 | 211.781 | 213.465 | SL | -1.00R | |
| 5171 | GBPUSD | 22.01.26 | BUY | 1.34390 | 1.34079 | 1.35321 | 1.34079 | SL | -1.00R | |
| 5172 | EURJPY | 22.01.26 | SELL | 185.493 | 185.791 | 184.597 | 185.791 | SL | -1.00R | |
| 5173 | EURUSD | 26.01.26 | BUY | 1.18674 | 1.18352 | 1.19640 | 1.18352 | SL | -1.00R | |
| 5174 | EURJPY | 27.01.26 | SELL | 183.377 | 183.711 | 182.377 | 182.377 | TP | +3.00R | |
| 5175 | GBPJPY | 27.01.26 | SELL | 211.288 | 211.783 | 209.803 | 209.803 | TP | +3.00R | |
| 5176 | EURUSD | 27.01.26 | BUY | 1.18861 | 1.18490 | 1.19974 | 1.19974 | TP | +3.00R | |
| 5177 | GBPUSD | 27.01.26 | BUY | 1.36945 | 1.36622 | 1.37912 | 1.37912 | TP | +3.00R | |
| 5178 | GBPUSD | 29.01.26 | SELL | 1.38247 | 1.38492 | 1.37510 | 1.37510 | TP | +3.00R | |
| 5179 | EURUSD | 03.02.26 | SELL | 1.18055 | 1.18255 | 1.17455 | 1.18255 | SL | -1.00R | |
| 5180 | GBPUSD | 03.02.26 | SELL | 1.36820 | 1.37078 | 1.36048 | 1.36950 | 17:00 | -0.50R | |
| 5181 | EURUSD | 04.02.26 | SELL | 1.18222 | 1.18391 | 1.17715 | 1.18072 | 17:00 | +0.89R | |
| 5182 | GBPUSD | 04.02.26 | SELL | 1.37014 | 1.37345 | 1.36023 | 1.36545 | 17:00 | +1.42R | |
| 5183 | EURUSD | 05.02.26 | SELL | 1.17922 | 1.18100 | 1.17388 | 1.18100 | SL | -1.00R | |
| 5184 | GBPUSD | 06.02.26 | SELL | 1.35613 | 1.35801 | 1.35047 | 1.35801 | SL | -1.00R | |
| 5185 | GBPJPY | 09.02.26 | BUY | 213.178 | 212.519 | 215.155 | 212.519 | SL | -1.00R | |
| 5186 | GBPUSD | 10.02.26 | BUY | 1.36808 | 1.36618 | 1.37380 | 1.36618 | SL | -1.00R | |
| 5187 | EURUSD | 13.02.26 | BUY | 1.18630 | 1.18457 | 1.19149 | 1.18649 | 17:00 | +0.11R | |
| 5188 | EURUSD | 16.02.26 | SELL | 1.18573 | 1.18715 | 1.18147 | 1.18510 | 17:00 | +0.44R | |
| 5189 | EURUSD | 17.02.26 | BUY | 1.18477 | 1.18274 | 1.19086 | 1.18274 | SL | -1.00R | |
| 5190 | GBPJPY | 19.02.26 | SELL | 209.174 | 209.564 | 208.004 | 208.683 | 17:00 | +1.26R | |
| 5191 | GBPUSD | 20.02.26 | SELL | 1.34379 | 1.34684 | 1.33466 | 1.34684 | SL | -1.00R | |
| 5192 | EURUSD | 20.02.26 | BUY | 1.17654 | 1.17420 | 1.18356 | 1.17808 | 17:00 | +0.66R | |
| 5193 | GBPUSD | 24.02.26 | BUY | 1.34971 | 1.34684 | 1.35830 | 1.34844 | 17:00 | -0.44R | |
| 5194 | EURUSD | 25.02.26 | SELL | 1.17959 | 1.18090 | 1.17566 | 1.18090 | SL | -1.00R | |
| 5195 | GBPUSD | 27.02.26 | BUY | 1.34928 | 1.34597 | 1.35919 | 1.34597 | SL | -1.00R | |
| 5196 | EURUSD | 27.02.26 | SELL | 1.17944 | 1.18228 | 1.17092 | 1.18228 | SL | -1.00R | |
| 5197 | EURJPY | 05.03.26 | BUY | 182.651 | 182.085 | 184.351 | 182.865 | 17:00 | +0.38R | |
| 5198 | EURUSD | 05.03.26 | BUY | 1.16343 | 1.15803 | 1.17963 | 1.15803 | SL | -1.00R | |
| 5199 | GBPUSD | 06.03.26 | SELL | 1.33533 | 1.33805 | 1.32719 | 1.33805 | SL | -1.00R | |
| 5200 | GBPUSD | 09.03.26 | SELL | 1.33028 | 1.33524 | 1.31542 | 1.33524 | SL | -1.00R | |
| 5201 | GBPUSD | 12.03.26 | SELL | 1.33729 | 1.33988 | 1.32954 | 1.33988 | SL | -1.00R | |
| 5202 | EURJPY | 16.03.26 | BUY | 182.233 | 181.843 | 183.405 | 183.001 | 17:00 | +1.96R | |
| 5203 | EURUSD | 16.03.26 | BUY | 1.14437 | 1.14127 | 1.15367 | 1.15049 | 17:00 | +1.97R | |
| 5204 | GBPUSD | 16.03.26 | BUY | 1.32554 | 1.32284 | 1.33362 | 1.33362 | TP | +3.00R | |
| 5205 | EURJPY | 18.03.26 | BUY | 183.380 | 182.954 | 184.660 | 183.115 | 17:00 | -0.62R | |
| 5206 | GBPJPY | 18.03.26 | BUY | 212.317 | 211.918 | 213.514 | 211.918 | SL | -1.00R | |
| 5207 | EURUSD | 19.03.26 | BUY | 1.14774 | 1.14417 | 1.15845 | 1.15845 | TP | +3.00R | |
| 5208 | GBPUSD | 19.03.26 | BUY | 1.32839 | 1.32442 | 1.34028 | 1.34028 | TP | +3.00R | |
| 5209 | EURUSD | 20.03.26 | SELL | 1.15642 | 1.15817 | 1.15117 | 1.15700 | 17:00 | -0.33R | |
| 5210 | GBPJPY | 23.03.26 | BUY | 212.297 | 211.822 | 213.722 | 211.822 | SL | -1.00R | |
| 5211 | EURJPY | 23.03.26 | BUY | 184.088 | 183.780 | 185.014 | 183.780 | SL | -1.00R | |
| 5212 | GBPJPY | 24.03.26 | SELL | 212.446 | 213.007 | 210.763 | 212.808 | 17:00 | -0.65R | |
| 5213 | GBPUSD | 24.03.26 | SELL | 1.33936 | 1.34468 | 1.32342 | 1.34127 | 17:00 | -0.36R | |
| 5214 | GBPUSD | 25.03.26 | BUY | 1.33971 | 1.33684 | 1.34834 | 1.33684 | SL | -1.00R | |
| 5215 | EURJPY | 25.03.26 | SELL | 184.288 | 184.625 | 183.279 | 184.275 | 17:00 | +0.04R | |
| 5216 | EURJPY | 26.03.26 | BUY | 184.376 | 184.134 | 185.104 | 184.134 | SL | -1.00R | |
| 5217 | GBPJPY | 27.03.26 | SELL | 212.878 | 213.125 | 212.137 | 212.516 | 17:00 | +1.47R | |
| 5218 | EURJPY | 27.03.26 | SELL | 184.138 | 184.364 | 183.458 | 184.364 | SL | -1.00R | |
| 5219 | GBPJPY | 01.04.26 | SELL | 210.184 | 210.546 | 209.098 | 210.546 | SL | -1.00R | |
| 5220 | EURJPY | 02.04.26 | BUY | 183.885 | 183.470 | 185.132 | 184.048 | 17:00 | +0.39R | |
| 5221 | GBPJPY | 02.04.26 | BUY | 210.929 | 210.309 | 212.789 | 210.984 | 17:00 | +0.09R | |
| 5222 | GBPUSD | 06.04.26 | SELL | 1.32093 | 1.32278 | 1.31540 | 1.32278 | SL | -1.00R | |
| 5223 | GBPUSD | 09.04.26 | BUY | 1.34065 | 1.33792 | 1.34882 | 1.34326 | 17:00 | +0.96R | |
| 5224 | GBPUSD | 10.04.26 | BUY | 1.34262 | 1.34115 | 1.34705 | 1.34115 | SL | -1.00R | |
| 5225 | EURJPY | 10.04.26 | SELL | 186.079 | 186.232 | 185.618 | 186.232 | SL | -1.00R | |
| 5226 | GBPUSD | 17.04.26 | BUY | 1.35255 | 1.35027 | 1.35941 | 1.35941 | TP | +3.00R | |
| 5227 | EURUSD | 17.04.26 | BUY | 1.17843 | 1.17708 | 1.18248 | 1.18248 | TP | +3.00R | |
| 5228 | GBPJPY | 20.04.26 | BUY | 214.707 | 214.288 | 215.964 | 214.887 | 17:00 | +0.43R | |
| 5229 | EURJPY | 21.04.26 | BUY | 187.228 | 186.965 | 188.019 | 187.133 | 17:00 | -0.36R | |
| 5230 | EURJPY | 22.04.26 | BUY | 187.168 | 186.932 | 187.878 | 186.932 | SL | -1.00R | |
| 5231 | GBPJPY | 22.04.26 | BUY | 215.382 | 215.054 | 216.366 | 215.054 | SL | -1.00R | |
| 5232 | EURJPY | 24.04.26 | BUY | 186.674 | 186.409 | 187.471 | 186.763 | 17:00 | +0.33R | |
| 5233 | GBPJPY | 24.04.26 | BUY | 215.202 | 214.908 | 216.084 | 215.639 | 17:00 | +1.49R | |
| 5234 | GBPJPY | 27.04.26 | BUY | 215.721 | 215.487 | 216.423 | 215.707 | 17:00 | -0.06R | |
| 5235 | EURJPY | 28.04.26 | BUY | 186.394 | 186.040 | 187.458 | 186.881 | 17:00 | +1.37R | |
| 5236 | GBPJPY | 28.04.26 | BUY | 215.342 | 214.912 | 216.632 | 215.659 | 17:00 | +0.74R | |
| 5237 | EURUSD | 29.04.26 | BUY | 1.17061 | 1.16951 | 1.17391 | 1.16951 | SL | -1.00R | |
| 5238 | EURJPY | 29.04.26 | BUY | 186.850 | 186.649 | 187.455 | 187.208 | 17:00 | +1.77R | |
| 5239 | EURJPY | 30.04.26 | SELL | 187.030 | 187.579 | 185.381 | 185.381 | TP | +3.00R | |
| 5240 | GBPJPY | 30.04.26 | SELL | 215.946 | 216.622 | 213.918 | 213.918 | TP | +3.00R | |
| 5241 | GBPUSD | 15.05.26 | BUY | 1.33669 | 1.33332 | 1.34682 | 1.33332 | SL | -1.00R | |
| 5242 | EURJPY | 21.05.26 | SELL | 184.482 | 184.910 | 183.196 | 184.910 | SL | -1.00R | |
| 5243 | GBPJPY | 21.05.26 | SELL | 213.430 | 213.791 | 212.347 | 213.791 | SL | -1.00R | |
| 5244 | GBPUSD | 21.05.26 | BUY | 1.34464 | 1.34139 | 1.35437 | 1.34139 | SL | -1.00R | |
| 5245 | EURUSD | 21.05.26 | BUY | 1.16274 | 1.15926 | 1.17318 | 1.15926 | SL | -1.00R | |
| 5246 | GBPJPY | 22.05.26 | BUY | 213.613 | 213.418 | 214.198 | 213.757 | 17:00 | +0.74R | |
| 5247 | GBPUSD | 22.05.26 | BUY | 1.34354 | 1.34115 | 1.35069 | 1.34281 | 17:00 | -0.31R | |
| 5248 | GBPUSD | 25.05.26 | BUY | 1.34882 | 1.34690 | 1.35460 | 1.35020 | 17:00 | +0.72R | |
| 5249 | GBPJPY | 27.05.26 | SELL | 214.219 | 214.443 | 213.547 | 214.443 | SL | -1.00R | |
| 5250 | EURUSD | 04.06.26 | SELL | 1.16052 | 1.16160 | 1.15728 | 1.16160 | SL | -1.00R | |
| 5251 | GBPUSD | 04.06.26 | SELL | 1.34190 | 1.34360 | 1.33682 | 1.34360 | SL | -1.00R | |
| 5252 | EURUSD | 09.06.26 | SELL | 1.15378 | 1.15545 | 1.14877 | 1.15545 | SL | -1.00R | |
| 5253 | EURJPY | 11.06.26 | SELL | 185.255 | 185.495 | 184.533 | 185.185 | 17:00 | +0.29R | |
| 5254 | GBPJPY | 11.06.26 | SELL | 214.736 | 214.972 | 214.028 | 214.028 | TP | +3.00R | |
| 5255 | EURUSD | 12.06.26 | BUY | 1.15840 | 1.15557 | 1.16689 | 1.15635 | 17:00 | -0.72R | |
| 5256 | GBPUSD | 12.06.26 | BUY | 1.34159 | 1.33817 | 1.35183 | 1.34017 | 17:00 | -0.42R | |
| 5257 | EURJPY | 18.06.26 | SELL | 184.877 | 185.224 | 183.838 | 185.224 | SL | -1.00R | |
| 5258 | GBPJPY | 18.06.26 | SELL | 213.525 | 214.085 | 211.845 | 213.045 | 17:00 | +0.86R | |
| 5259 | GBPUSD | 18.06.26 | SELL | 1.32946 | 1.33261 | 1.31999 | 1.31999 | TP | +3.00R | |
| 5260 | EURUSD | 18.06.26 | SELL | 1.15075 | 1.15294 | 1.14418 | 1.14580 | 17:00 | +2.26R | |
| 5261 | EURJPY | 22.06.26 | SELL | 185.111 | 185.353 | 184.383 | 185.353 | SL | -1.00R | |
| 5262 | GBPJPY | 22.06.26 | SELL | 213.407 | 213.754 | 212.366 | 213.754 | SL | -1.00R | |
| 5263 | GBPJPY | 23.06.26 | SELL | 213.748 | 214.238 | 212.278 | 213.304 | 17:00 | +0.91R | |
| 5264 | GBPUSD | 23.06.26 | BUY | 1.32488 | 1.32271 | 1.33137 | 1.32271 | SL | -1.00R | |
| 5265 | EURJPY | 23.06.26 | SELL | 184.534 | 184.867 | 183.533 | 183.896 | 17:00 | +1.91R | |
| 5266 | EURUSD | 23.06.26 | SELL | 1.14151 | 1.14402 | 1.13398 | 1.13818 | 17:00 | +1.33R | |
| 5267 | GBPJPY | 24.06.26 | SELL | 213.057 | 213.526 | 211.650 | 212.975 | 17:00 | +0.17R | |
| 5268 | EURUSD | 25.06.26 | BUY | 1.13682 | 1.13435 | 1.14423 | 1.13435 | SL | -1.00R | |
| 5269 | GBPUSD | 01.07.26 | BUY | 1.32479 | 1.32272 | 1.33102 | 1.32272 | SL | -1.00R | |
| 5270 | GBPJPY | 01.07.26 | BUY | 215.526 | 215.164 | 216.612 | 215.164 | SL | -1.00R | |
| 5271 | GBPUSD | 03.07.26 | SELL | 1.33627 | 1.33823 | 1.33037 | 1.33488 | 17:00 | +0.71R | |
| 5272 | GBPUSD | 06.07.26 | BUY | 1.33459 | 1.33269 | 1.34031 | 1.33892 | 17:00 | +2.27R | |
| 5273 | GBPUSD | 07.07.26 | BUY | 1.33906 | 1.33732 | 1.34430 | 1.33732 | SL | -1.00R | |
| 5274 | EURUSD | 08.07.26 | SELL | 1.14069 | 1.14327 | 1.13295 | 1.14166 | 17:00 | -0.38R | |
| 5275 | GBPUSD | 08.07.26 | SELL | 1.33474 | 1.33715 | 1.32749 | 1.33715 | SL | -1.00R | |
| 5276 | EURJPY | 09.07.26 | SELL | 185.548 | 185.802 | 184.784 | 185.802 | SL | -1.00R | |
| 5277 | GBPJPY | 10.07.26 | BUY | 217.082 | 216.807 | 217.907 | 216.807 | SL | -1.00R | |
| 5278 | EURJPY | 10.07.26 | BUY | 184.992 | 184.703 | 185.857 | 184.703 | SL | -1.00R | |
| 5279 | GBPUSD | 15.07.26 | SELL | 1.33987 | 1.34213 | 1.33311 | 1.34213 | SL | -1.00R | |
| 5280 | GBPJPY | 16.07.26 | SELL | 219.318 | 219.564 | 218.580 | 218.846 | 17:00 | +1.92R | |
| 5281 | EURUSD | 16.07.26 | SELL | 1.14652 | 1.14774 | 1.14286 | 1.14419 | 17:00 | +1.91R | |
| 5282 | EURJPY | 17.07.26 | SELL | 185.749 | 185.981 | 185.051 | 185.744 | 17:00 | +0.02R | |
| 5283 | GBPUSD | 17.07.26 | SELL | 1.34562 | 1.34820 | 1.33786 | 1.34493 | 17:00 | +0.27R | |
| 5284 | GBPUSD | 21.07.26 | SELL | 1.34366 | 1.34569 | 1.33755 | 1.33755 | TP | +3.00R | |
| 5285 | EURJPY | 22.07.26 | SELL | 185.944 | 186.210 | 185.144 | 186.154 | 17:00 | -0.79R | |
| 5286 | EURUSD | 22.07.26 | SELL | 1.14045 | 1.14193 | 1.13601 | 1.14193 | SL | -1.00R | |
| 5287 | EURJPY | 27.07.26 | SELL | 186.499 | 186.759 | 185.717 | 186.166 | 17:00 | +1.27R | |
| 5288 | EURUSD | 27.07.26 | SELL | 1.14024 | 1.14193 | 1.13517 | 1.13681 | 17:00 | +2.03R | |
| 5289 | GBPJPY | 30.07.26 | BUY | 218.383 | 218.102 | 219.226 | 218.102 | SL | -1.00R | |
| 5290 | EURJPY | 30.07.26 | BUY | 187.385 | 187.127 | 188.161 | 187.127 | SL | -1.00R | |
| 5291 | GBPUSD | 30.07.26 | BUY | 1.33584 | 1.33311 | 1.34401 | 1.34401 | TP | +3.00R | |
| 5292 | GBPUSD | 07.08.26 | SELL | 1.34476 | 1.34591 | 1.34133 | 1.34591 | SL | -1.00R | |
| 5293 | EURUSD | 13.08.26 | BUY | 1.15284 | 1.15105 | 1.15821 | 1.15263 | 17:00 | -0.12R | |
| 5294 | EURJPY | 14.08.26 | BUY | 183.925 | 183.666 | 184.704 | 183.666 | SL | -1.00R | |
| 5295 | GBPJPY | 17.08.26 | BUY | 215.652 | 215.375 | 216.483 | 215.906 | 17:00 | +0.92R | |
| 5296 | GBPUSD | 17.08.26 | SELL | 1.35494 | 1.35725 | 1.34799 | 1.35441 | 17:00 | +0.23R | |
| 5297 | EURUSD | 18.08.26 | BUY | 1.15762 | 1.15653 | 1.16089 | 1.15743 | 17:00 | -0.17R | |
| 5298 | GBPUSD | 21.08.26 | BUY | 1.36574 | 1.36337 | 1.37287 | 1.36337 | SL | -1.00R | |
| 5299 | GBPUSD | 24.08.26 | BUY | 1.36471 | 1.36359 | 1.36805 | 1.36359 | SL | -1.00R | |
| 5300 | GBPUSD | 25.08.26 | BUY | 1.36360 | 1.36201 | 1.36839 | 1.36472 | 17:00 | +0.70R | |
| 5301 | EURUSD | 25.08.26 | BUY | 1.16632 | 1.16498 | 1.17034 | 1.16738 | 17:00 | +0.79R | |
| 5302 | GBPUSD | 26.08.26 | BUY | 1.36383 | 1.36233 | 1.36831 | 1.36233 | SL | -1.00R | |
| 5303 | EURUSD | 27.08.26 | BUY | 1.16577 | 1.16504 | 1.16796 | 1.16504 | SL | -1.00R | |
| 5304 | GBPUSD | 31.08.26 | SELL | 1.35386 | 1.35502 | 1.35040 | 1.35502 | SL | -1.00R | |
| 5305 | GBPUSD | 02.09.26 | BUY | 1.35093 | 1.34878 | 1.35736 | 1.34878 | SL | -1.00R | |
| 5306 | GBPUSD | 08.09.26 | SELL | 1.35325 | 1.35540 | 1.34678 | 1.35540 | SL | -1.00R | |
| 5307 | GBPJPY | 09.09.26 | BUY | 207.971 | 207.350 | 209.834 | 207.942 | 17:00 | -0.05R | |
| 5308 | GBPUSD | 09.09.26 | SELL | 1.35455 | 1.35692 | 1.34746 | 1.35471 | 17:00 | -0.06R | |
| 5309 | EURJPY | 09.09.26 | BUY | 178.591 | 178.042 | 180.240 | 178.597 | 17:00 | +0.01R | |
| 5310 | EURJPY | 11.09.26 | BUY | 179.087 | 178.767 | 180.049 | 178.767 | SL | -1.00R | |
| 5311 | EURUSD | 15.09.26 | BUY | 1.15394 | 1.15258 | 1.15802 | 1.15421 | 17:00 | +0.20R | |
| 5312 | EURUSD | 16.09.26 | SELL | 1.15426 | 1.15577 | 1.14973 | 1.14973 | TP | +3.00R | |
| 5313 | EURJPY | 22.09.26 | SELL | 180.550 | 180.848 | 179.654 | 180.196 | 17:00 | +1.18R | |
| 5314 | GBPJPY | 22.09.26 | SELL | 210.632 | 210.922 | 209.762 | 209.762 | TP | +3.00R | |
| 5315 | EURUSD | 28.09.26 | BUY | 1.13849 | 1.13699 | 1.14299 | 1.13699 | SL | -1.00R | |
| 5316 | GBPJPY | 02.10.26 | SELL | 208.269 | 208.672 | 207.060 | 208.672 | SL | -1.00R | |
| 5317 | GBPUSD | 02.10.26 | SELL | 1.32020 | 1.32231 | 1.31385 | 1.32231 | SL | -1.00R | |
| 5318 | GBPJPY | 05.10.26 | BUY | 208.768 | 208.199 | 210.475 | 208.748 | 17:00 | -0.04R | |
| 5319 | EURJPY | 05.10.26 | BUY | 176.929 | 176.190 | 179.148 | 177.175 | 17:00 | +0.33R | |
| 5320 | GBPUSD | 06.10.26 | BUY | 1.32225 | 1.31996 | 1.32910 | 1.32730 | 17:00 | +2.21R | |
| 5321 | EURUSD | 06.10.26 | BUY | 1.12224 | 1.12016 | 1.12848 | 1.12578 | 17:00 | +1.70R | |
| 5322 | EURJPY | 09.10.26 | SELL | 177.341 | 177.891 | 175.689 | 177.282 | 17:00 | +0.11R | |
| 5323 | GBPJPY | 09.10.26 | SELL | 209.252 | 209.766 | 207.710 | 209.479 | 17:00 | -0.44R | |
| 5324 | EURJPY | 12.10.26 | SELL | 177.290 | 177.588 | 176.394 | 176.966 | 17:00 | +1.08R | |
| 5325 | GBPJPY | 13.10.26 | BUY | 209.418 | 209.104 | 210.360 | 209.104 | SL | -1.00R | |
| 5326 | EURJPY | 13.10.26 | SELL | 176.719 | 177.127 | 175.493 | 177.127 | SL | -1.00R | |
| 5327 | EURUSD | 14.10.26 | SELL | 1.12003 | 1.12126 | 1.11634 | 1.11634 | TP | +3.00R | |
| 5328 | GBPJPY | 14.10.26 | BUY | 210.118 | 209.805 | 211.057 | 209.805 | SL | -1.00R | |
| 5329 | EURJPY | 19.10.26 | BUY | 177.350 | 176.895 | 178.717 | 177.700 | 17:00 | +0.77R | |
| 5330 | GBPJPY | 21.10.26 | BUY | 211.661 | 211.352 | 212.588 | 211.774 | 17:00 | +0.37R | |
| 5331 | EURJPY | 23.10.26 | SELL | 175.797 | 176.240 | 174.466 | 175.660 | 17:00 | +0.31R | |
| 5332 | GBPUSD | 28.10.26 | BUY | 1.32947 | 1.32708 | 1.33662 | 1.33220 | 17:00 | +1.14R | |
| 5333 | GBPJPY | 29.10.26 | BUY | 210.279 | 209.939 | 211.299 | 210.861 | 17:00 | +1.71R | |
| 5334 | GBPJPY | 30.10.26 | SELL | 210.847 | 211.362 | 209.302 | 210.990 | 17:00 | -0.28R | |
| Total: 409 | +21.4R | |||||||||
- Click the button below and tap “Start” in Telegram.
- Used the bot before and there is no “Start” button? Just send the bot the message /start.
- Not subscribed to @strategy4you yet — the bot will ask you to subscribe: subscribe and tap “✅ I’ve subscribed”. Already subscribed — the bot goes straight to the next step.
- The bot sends a “Get the EA for free” button — tap it to open the bonus page.
- On the page find the “📊 Strategy trade journals” block and click “Download Excel” in the Kill Zones card.
How to calculate the lot size
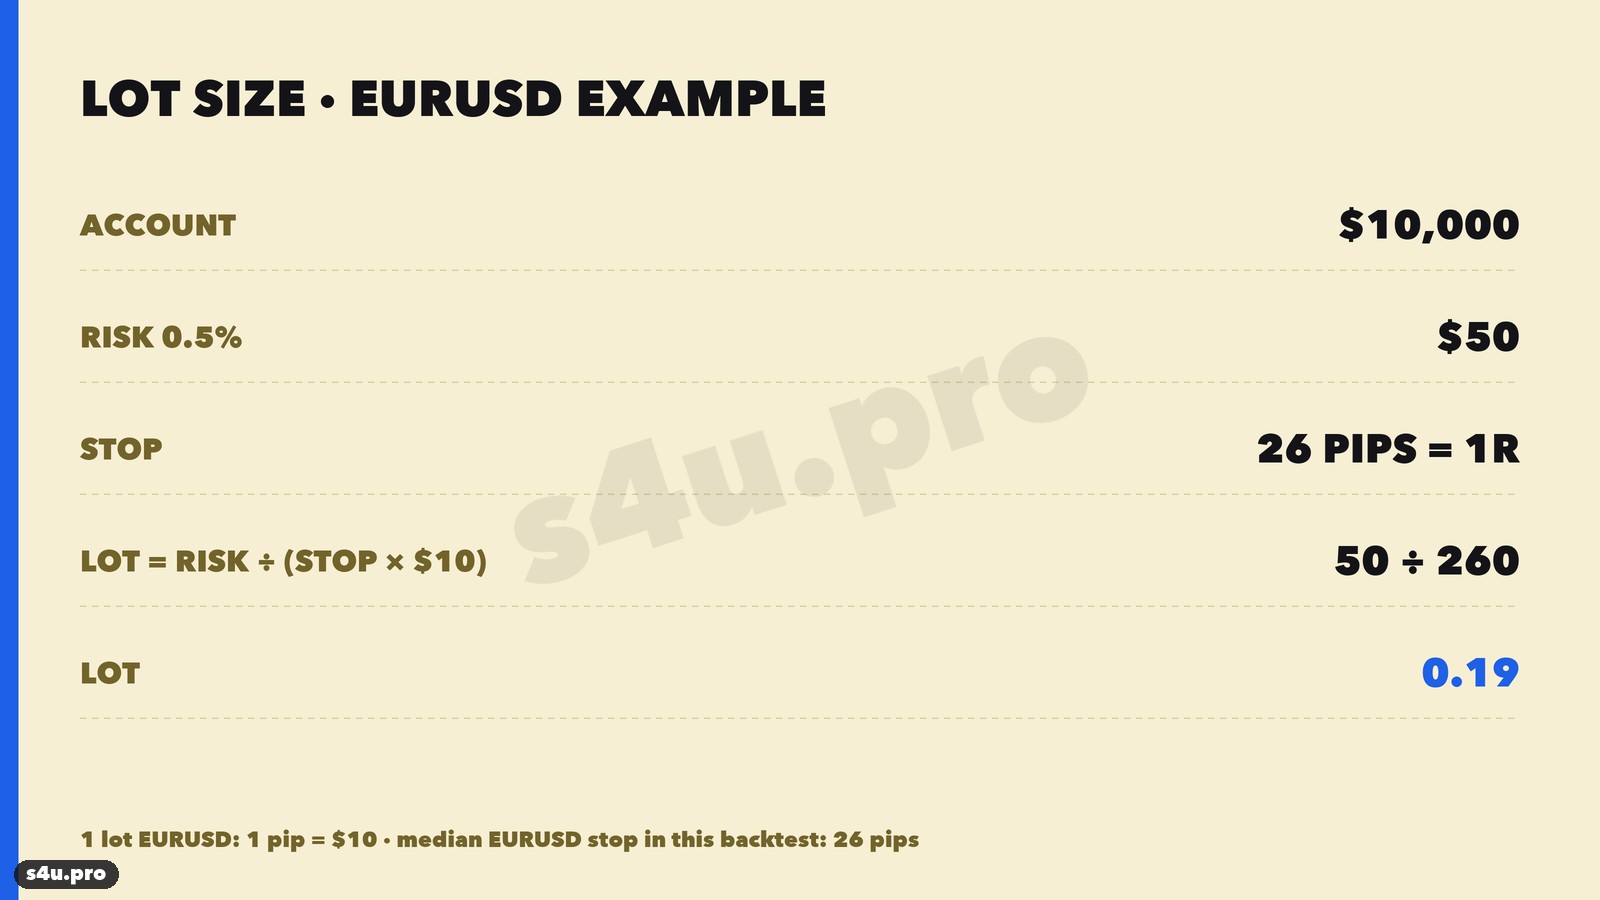
Size the position from the stop: lot = risk amount ÷ (stop in pips × pip value). For EURUSD 1 lot = $10 per pip. With a $10,000 account, 0.5% risk ($50) and a 26-pip stop, lot = 50 ÷ 260 ≈ 0.19.
41% of trades win, losing streaks reach 15 in a row, some years go nowhere, and the maximum drawdown is −70R. At 1% risk per trade that is −70% of the account, at 0.5% −35%. So risk 0.25–0.5% per trade, no more.Why it works: the liquidity logic
- Asia has little volume, so the range is narrow, and stop losses and breakout orders pile up above and below it.
- The European open brings volume. Large players need to build positions, and the easiest place to do it is where other traders’ stops sit. Price goes beyond the edge of Asia, collects liquidity and comes back.
- CHoCH shows the spike is over: price did not just come back, it broke the nearest structure. Without this confirmation (entry right on the return) the model loses.
- The euro and the pound are the currencies London itself trades, so the effect is stronger there than on dollar pairs with the yen, franc or commodity currencies.
Kill Zones with other SMC models
- Liquidity sweep — the heart of the model: the Asian high and low are the liquidity that London takes.
- BOS and CHoCH — confirmation of the reversal. In the test it was the CHoCH that turned −59R into +315R.
- FVG and order blocks — often used for a limit entry on the pullback after the CHoCH. In our test a limit at 50% of the impulse did not improve the result: three times fewer trades and roughly zero.
We keep testing filters for this model — the results will be published separately.
Common session trading mistakes
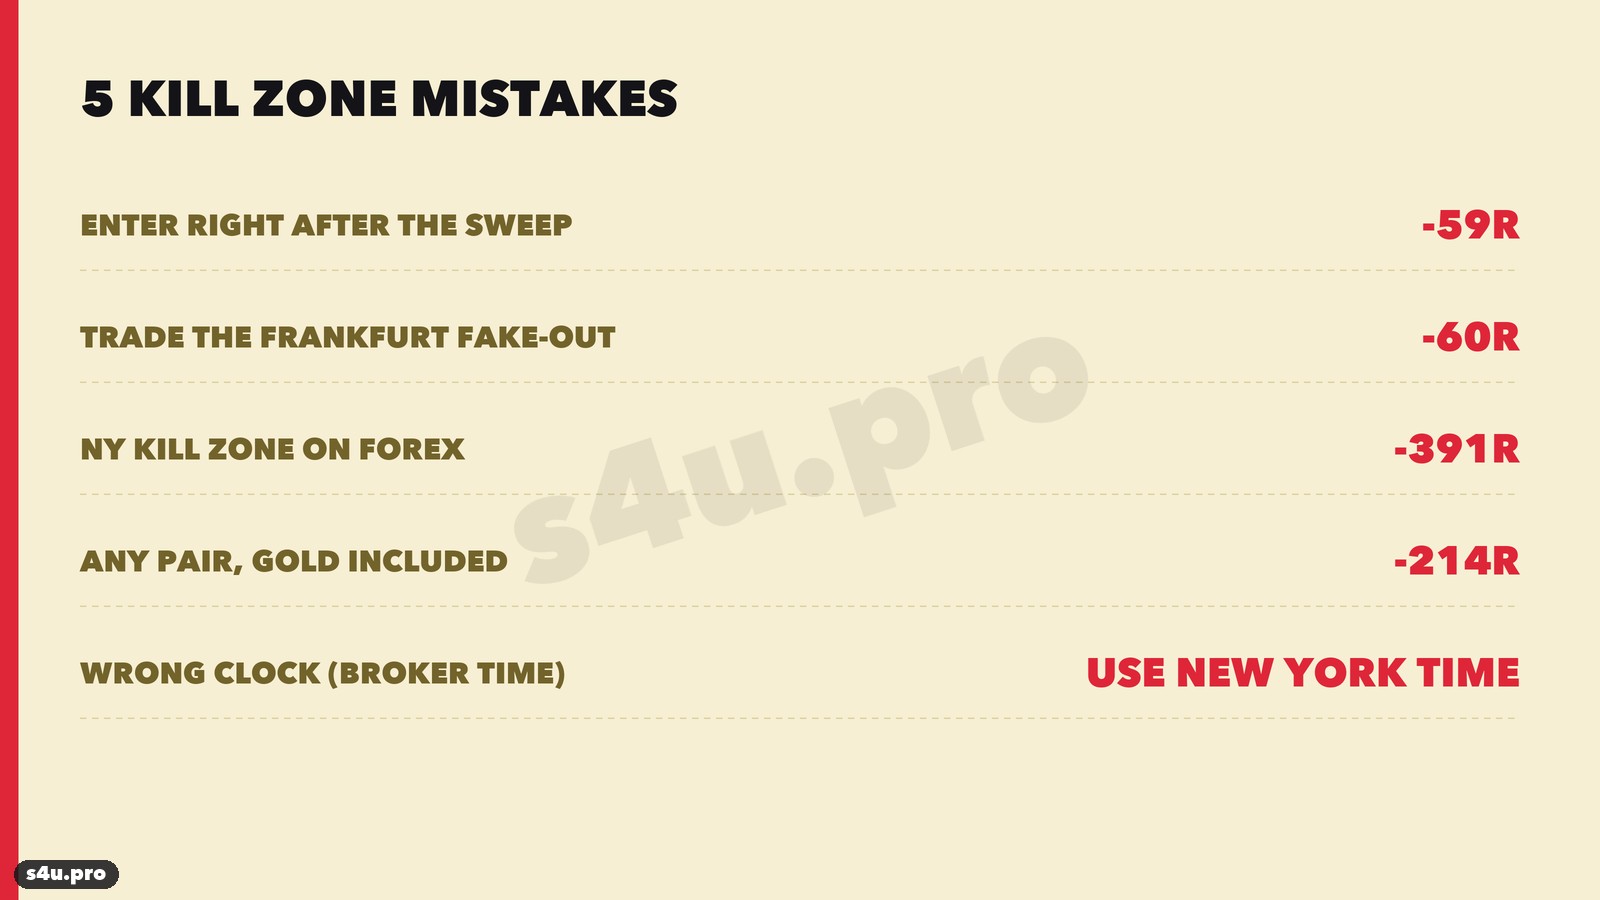
- Entering right after the sweep. Without a break of structure: −59R.
- Trading the Frankfurt spike. 02:00–03:00 is most often the fake move itself: −60R.
- Moving the model to the New York session. Sweeping the London range in New York on currencies made −391R.
- Trading any pair and gold. On USDJPY, AUDUSD, USDCAD, USDCHF, NZDUSD, GBPAUD and gold: −214R.
- Using the wrong clock. The rules are in New York time. On a GMT+2/GMT+3 platform that means Asia 02:00–09:00 and entry 10:00–12:00; if your broker uses another time zone, convert. One hour off changes the Asian range and the entry window completely.
FAQ: Kill Zones
What is a Kill Zone in simple words?
A 2–3 hour window at the start of a session, when the main volume arrives and price makes the key move of the day. The best known is the London one, 02:00–05:00 New York time.
What is the London Kill Zone in UTC and on the platform clock?
The 03:00–05:00 New York entry window is 08:00–10:00 UTC in winter and 07:00–09:00 UTC in summer; on a GMT+2/GMT+3 platform it is 10:00–12:00 all year. The Asian range 19:00–02:00 New York is 02:00–09:00 on the platform.
Why enter from 03:00 and not 02:00?
We tested Frankfurt separately: a CHoCH at 02:00–03:00 made −60R. In the main model the sweep may already happen in Frankfurt, but the entry only after 03:00.
Does it work on gold?
Not in our test: on XAUUSD and the dollar pairs the same rules lose. The best markets are EURUSD and GBPUSD.
Which timeframe?
M5 to find the CHoCH and enter. The Asian range is easy to see on M15–H1.
What is a Judas swing?
A fake spike at the London open beyond the Asian range that collects stops before the real move of the day.
Why a 3R target?
2R made +248R, 3R +315R, 4R +279R with a deeper drawdown. 3R is the best balance. If the target is not reached, close at 17:00 New York time.
What is R?
R is the stop size. −1R means the stop was hit, +3R a profit of three stops. On EURUSD 1R is 26 pips on average; at 0.5% risk, 1R = 0.5% of the account.
Does a partial close help?
No: closing 30–70% at 1–2R lifts the win rate to 51% but cuts the total by 20–110R. Breakeven at 1R barely changes the result.
How much to risk?
0.25–0.5% per trade. The test drawdown is −70R: at 1% risk that is −70% of the account. 41% of trades win, with up to 15 losses in a row.
Video: Kill Zones on real trades
Conclusion
- Kill Zones are the most active windows of the trading day. The main one is London: the Asian range is swept at the London open, and then the main move follows.
- The Asian sweep alone is not a signal: entering right on the return made −59R.
- What works is Asian sweep → M5 CHoCH between 03:00 and 05:00 New York time, stop beyond the sweep, 3R target or exit at 17:00: +315R on 5,334 trades, all 4 pairs and 17 of 22 years in profit.
- Frankfurt, New York, gold and the dollar pairs lose with these rules.
- The edge is small (+0.06R per trade), with long flat periods (2011–2019) and losing years (2025: −8R). Risk 0.25–0.5% per trade.
- A partial close does not increase profit; breakeven at 1R barely changes anything.
Before trading a live account, test the strategy on demo and keep your own trade journal, like the one in this article.
Other strategies we have backtested
This article is educational and is not investment advice. Trading Forex and CFDs carries a high risk of losing money. Past results do not guarantee future profits. Data: one-minute quotes from histdata.com (2005 — October 2026) built into M5 candles and converted to New York time; spread included in every trade, real execution may differ.
 Point your phone camera here