Inhalt 14
- Die berühmtesten Strategien von Larry Williams
- Test der Klassiker: Williams’ Strategien auf Tagescharts
- Larry-Williams-Strategie: die Regeln
- Statistik: 4 016 Trades in 16 Jahren
- Was das Ergebnis verändert
- Warum es funktioniert
- Williams und Silver Bullet: zwei Strategien auf einem Index
- Trade-Beispiele Schritt für Schritt
- Galerie: alle Trades 2025–2026
- So berechnen Sie die Lotgröße
- Häufige Fehler
- FAQ
- Fazit
- Weitere Strategien, die wir an der Historie getestet haben
Larry Williams gehört zu den bekanntesten Tradern der Welt. 1987 gewann er die Robbins World Cup Championship und machte in 12 Monaten aus 10 000 $ 1,1 Mio. $ — +11 376 %, ein Rekord, der bis heute steht. Sein wichtigstes Werkzeug war damals der Volatilitätsausbruch im S&P-500-Future: Man nimmt einen Teil der gestrigen Spanne, addiert ihn zur heutigen Eröffnung und steigt per Stop-Order in die Richtung ein, in die der Kurs zuerst läuft.
Wir haben die sechs berühmtesten Strategien von Larry Williams genau so getestet, wie sie in seinen Büchern stehen, und den Volatilitätsausbruch dann dorthin zurückgebracht, wo er entstanden ist — an die Eröffnung der New Yorker Börse um 9:30 — im Nasdaq 100. Der Test läuft auf 1-Minuten-Kursen des NAS100 von November 2010 bis Oktober 2026, der Spread ist in jedem Trade abgezogen.
❗ R = Stop-Größe: −1R heißt Stop getroffen, +3R ein Gewinn von drei Stops. Im NAS100 ist 1R ≈ 170 Punkte; bei 0,25 % Risiko ist 1R = 0,25 % des Kontos. Mehr ▾
R ist die Größe des Stops in einem Trade. 1R = Abstand vom Einstieg bis zum Stop-Loss. Wird der Stop getroffen, bringt der Trade −1R. Läuft der Kurs drei Stops in unsere Richtung — +3R.
In Punkten: Der Stop ist hier die Hälfte der gestrigen NAS100-Spanne. 2026 lag der Median-Stop bei 170 Punkten, also 1R ≈ 170 Punkte und das 3R-Ziel ≈ 510 Punkte.
In Geld: Wer 0,25 % des Kontos pro Trade riskiert, für den gilt 1R = 0,25 % des Kontos und +3R = +0,75 %.
Wir rechnen in R statt in Punkten, weil jeder Trade seinen eigenen Stop hat und der Nasdaq in 16 Jahren etwa um das 14-Fache gestiegen ist: R erlaubt es, Trades von 2011 und 2026 fair zu addieren. Das Gesamtergebnis des Tests: +280R = +16 595 NAS100-Punkte.
⏰ Zeiten in New Yorker Zeit: Orders um 9:30 = 15:30 MEZ/MESZ (16:30 Serverzeit), Ausstieg um 16:00 = 22:00 MEZ/MESZ. Mehr ▾
Die Strategie hängt an der Eröffnung der US-Börse, deshalb gelten alle Regeln in New Yorker Zeit:
- 9:30 New York (Eröffnung, Orders platzieren) = 16:30 Serverzeit GMT+2 im Winter / GMT+3 im Sommer (die MT4/MT5-Uhr der meisten Broker), 14:30 GMT im Winter und 13:30 GMT im Sommer, in Deutschland (MEZ/MESZ) meist 15:30;
- 12:00 New York (nicht ausgeführte Orders löschen) = 19:00 Serverzeit, 18:00 MEZ/MESZ;
- 16:00 New York (Börsenschluss, Trade schließen) = 23:00 Serverzeit, 22:00 MEZ/MESZ.
Auch die gestrige Spanne wird in Börsenzeit gemessen: 9:30–16:00 New York, also 15:30–22:00 deutscher Zeit. Für Europa ist das der Nachmittag und Abend.
„Sommer“ meint die US-Sommerzeit: vom zweiten Sonntag im März bis zum ersten Sonntag im November. Europa stellt die Uhren an anderen Tagen um (letzter Sonntag im März und Oktober), daher ist der Abstand zu New York 2–3 Wochen im Jahr eine Stunde kürzer. In diesen Wochen gilt die New Yorker Uhr.
Die berühmtesten Strategien von Larry Williams
Williams hat mehr als zehn Bücher geschrieben; das wichtigste ist Long-Term Secrets to Short-Term Trading (1999). Daraus und aus seinen Seminaren übernehmen Trader meist sechs Ideen:
- Volatilitätsausbruch (Volatility Breakout). Kaufen, wenn der Kurs ab Tageseröffnung um einen Teil der gestrigen Spanne steigt, verkaufen, wenn er ebenso fällt. Damit gewann Williams 1987 die Meisterschaft.
- Oops! Der Tag eröffnet mit einer Lücke unter dem gestrigen Tief, dann kehrt der Kurs zu diesem Tief zurück — Kauf: „Die Masse hat sich geirrt“. Umgekehrt für Verkäufe.
- Smash Day. Der Tag schließt unter dem gestrigen Tief — am nächsten Tag Kauf per Stop-Order über dem Hoch dieses Tages: eine Umkehr nach einem Fehlausbruch.
- Outside Day. Eine Kerze umschließt die gestrige auf beiden Seiten und schließt unter dem gestrigen Tief — Kauf zur nächsten Eröffnung.
- 3-Bar-Hoch/Tief-System. Zwei gleitende Durchschnitte mit Periode 3 — über die Hochs und über die Tiefs. Einstieg beim Rücksetzer an den Durchschnitt der Tiefs, Ausstieg am Durchschnitt der Hochs.
- Williams %R. Williams’ Oszillator: Verlassen der überverkauften Zone −80 nach oben — Kauf, Verlassen der überkauften Zone −20 nach unten — Verkauf.
Test der Klassiker: Williams’ Strategien auf Tagescharts
Zuerst haben wir alle sechs Strategien so getestet, wie sie geschrieben sind: Tageskerzen, 19 Märkte (Währungspaare, Gold, NAS100 und S&P 500), 1-Minuten-Kurse von 2005 bis 2026 — damit wir ehrlich wissen, was innerhalb des Tages zuerst getroffen wird, Stop oder Ziel. Spread inklusive.
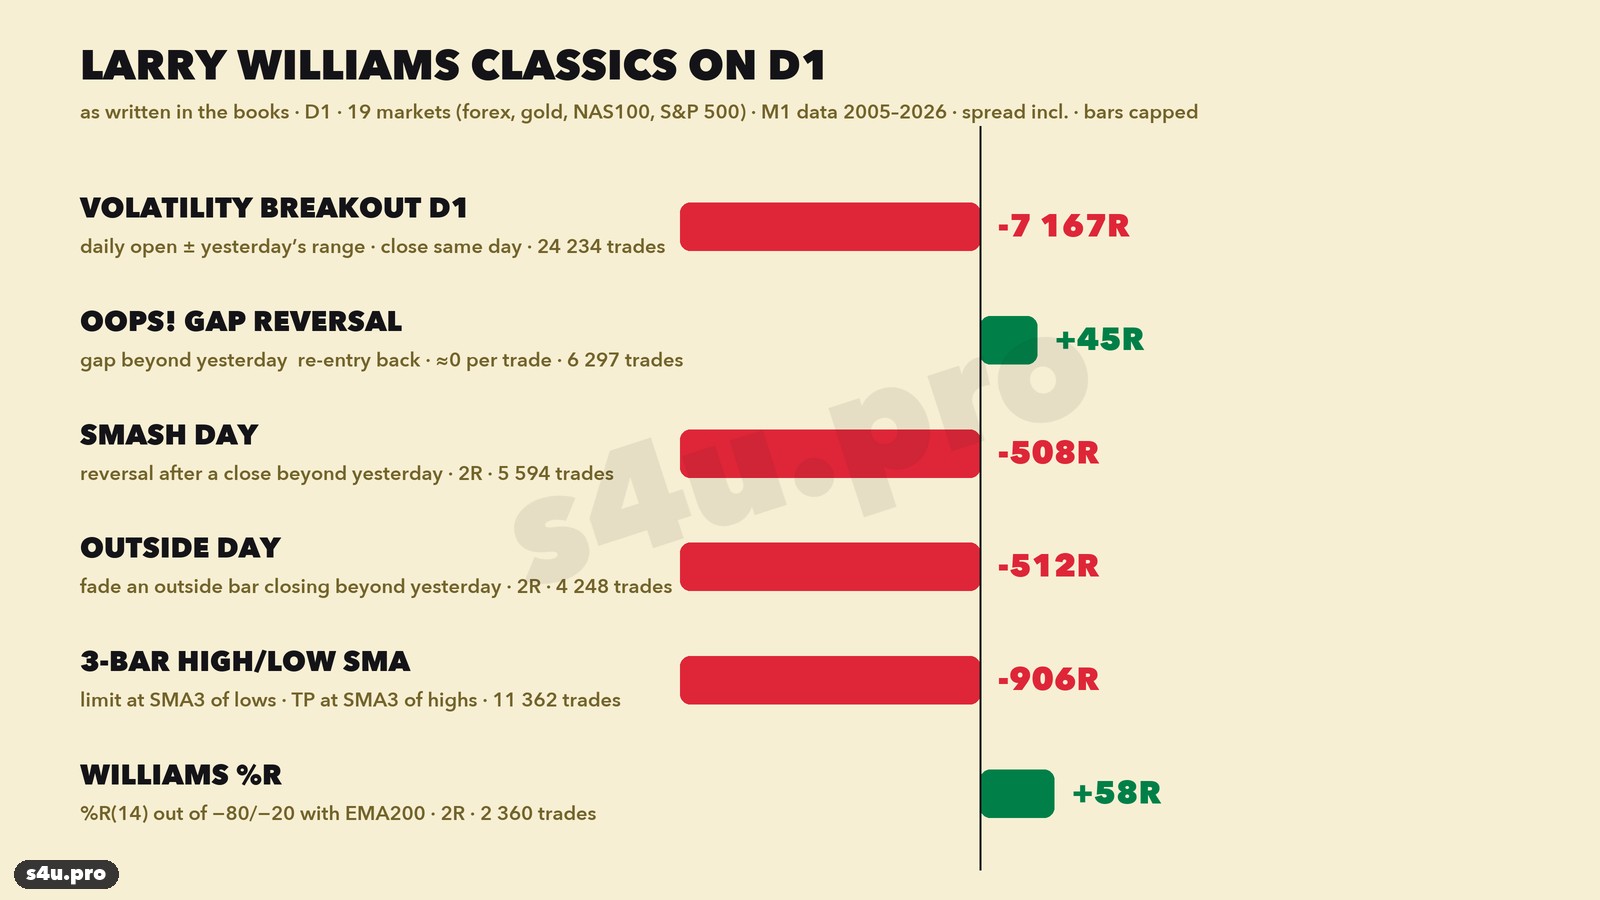
- Volatilitätsausbruch auf Tagesbasis (ab Tageseröffnung um 00:00 Serverzeit, Ausstieg zum Schluss) — deutlicher Verlust: Nachts und in der Asien-Session zuckt der Kurs, Stop-Orders werden durch Zufallsbewegungen ausgelöst, und bei Währungen frisst der Spread den Rest.
- Oops! — etwa null (+0,007R pro Trade). Rund um die Uhr gehandelte Märkte haben kaum echte Lücken.
- Smash Day, Outside Day, das 3-Bar-System — auf den meisten Märkten und Zeitebenen im Minus (geprüft auf D1, H4 und H1).
- Williams %R — ein kleiner Gewinn, fast ganz aus Käufen: Die Märkte sind in diesen Jahren einfach gestiegen.
Warum? Williams handelte Futures mit Tagessitzung: In den 1980ern begann der S&P-500-Tag mit der Börseneröffnung, nicht um Mitternacht. Die Eröffnung ist der Moment, in dem alle über Nacht gesammelten Orders gleichzeitig in den Markt kommen und der Kurs seine Tagesrichtung wählt. Deshalb haben wir Williams’ Hauptidee — den Volatilitätsausbruch — an die Eröffnung der New Yorker Börse um 9:30 gekoppelt.
Free EA for MT4 / MT5 + trade journals Get it freeLarry-Williams-Strategie: die Regeln
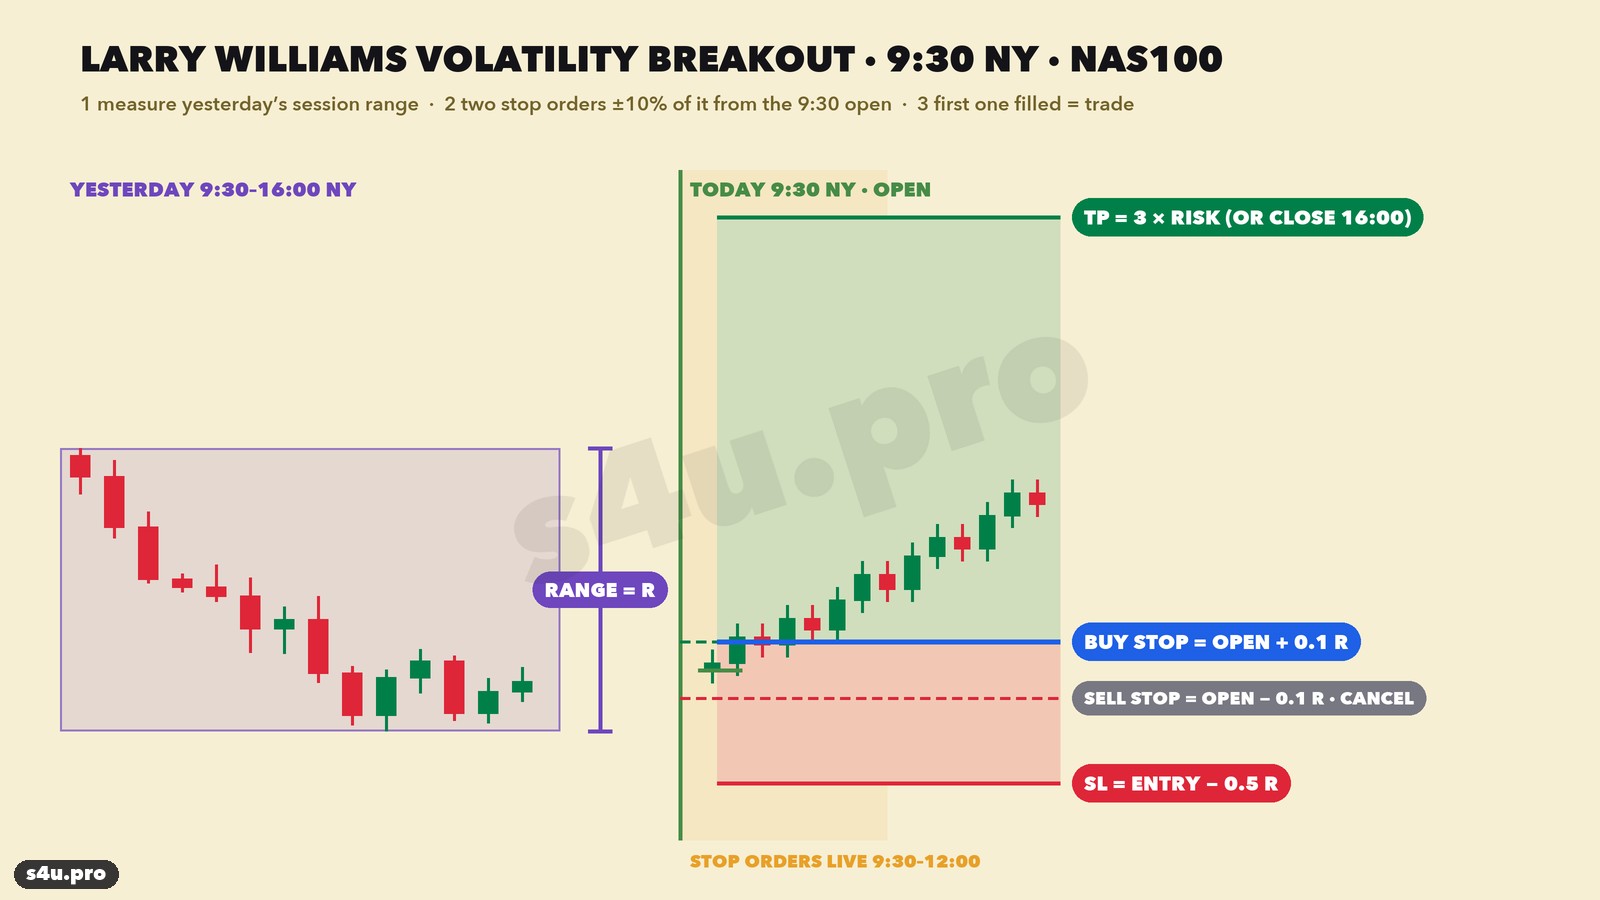
Markt: NAS100 (Nasdaq 100, CFD oder Future). Zeitebene: jeder Intraday-Chart, M5 ist praktisch. Zeit: New York.
- Gestrige Spanne. Nehmen Sie Hoch und Tief der gestrigen Sitzung von 9:30 bis 16:00 New York (15:30–22:00 deutscher Zeit, 16:30–23:00 Serverzeit GMT+2/GMT+3). Die Differenz ist die Spanne D. Die Nachtstunden zählen nicht.
- Orders um 9:30. Heute um 9:30 New York notieren Sie den Eröffnungskurs. Platzieren Sie einen Buy Stop bei Eröffnung + 0,1 × D und einen Sell Stop bei Eröffnung − 0,1 × D.
- Einstieg. Die zuerst ausgeführte Order ist der Trade. Die andere sofort löschen. Wird bis 12:00 New York keine ausgeführt, gibt es heute keinen Trade (in der Praxis wird die Order an 99 % der Tage in der ersten halben Stunde ausgeführt).
- Stop — 0,5 × D vom Einstiegskurs entfernt: beim Kauf darunter, beim Verkauf darüber.
- Ziel — 3R, also drei Stop-Größen (1,5 × D ab Einstieg). Werden bis 16:00 New York weder Stop noch Ziel erreicht, schließen Sie den Trade zum Marktpreis. An verkürzten Handelstagen vor US-Feiertagen schließt die Börse früher — dann vor Handelsende schließen.
- Ein Trade pro Tag. Keine Positionen über Nacht.
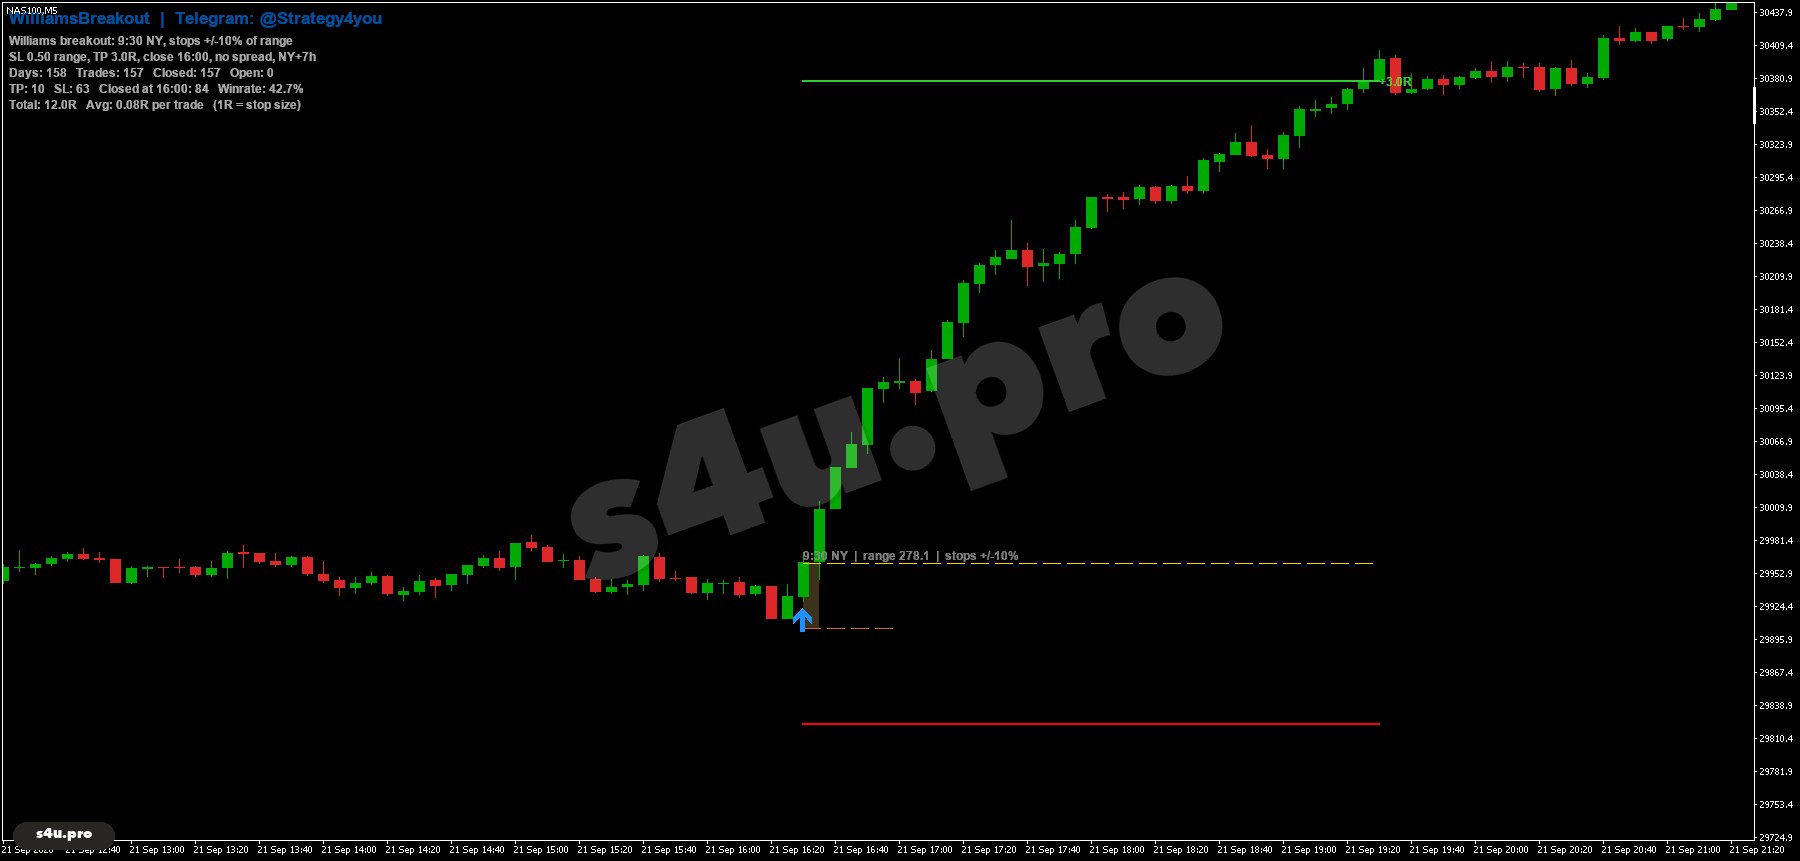
Ein Rechenbeispiel: Gestern bewegte sich der NAS100 von 9:30 bis 16:00 zwischen 28 972 und 29 166 — Spanne D = 194 Punkte. Heute liegt die 9:30-Eröffnung bei 29 204. Buy Stop = 29 204 + 19 = 29 223, Sell Stop = 29 204 − 19 = 29 184. Der Buy Stop wird ausgeführt — der Stop liegt 97 Punkte unter dem Einstieg (29 126), das Ziel 291 Punkte darüber (29 514). Das ist ein echter Trade vom 3. September 2026 — er ist unten unter den Beispielen.
Die mittlere gestrige NAS100-Spanne lag 2026 bei etwa 340 Punkten, der Stop bei etwa 170 Punkten. Ein Trade dauert meist bis Börsenschluss: Mehr als die Hälfte wird um 16:00 zeitbasiert geschlossen.
Statistik: 4 016 Trades in 16 Jahren
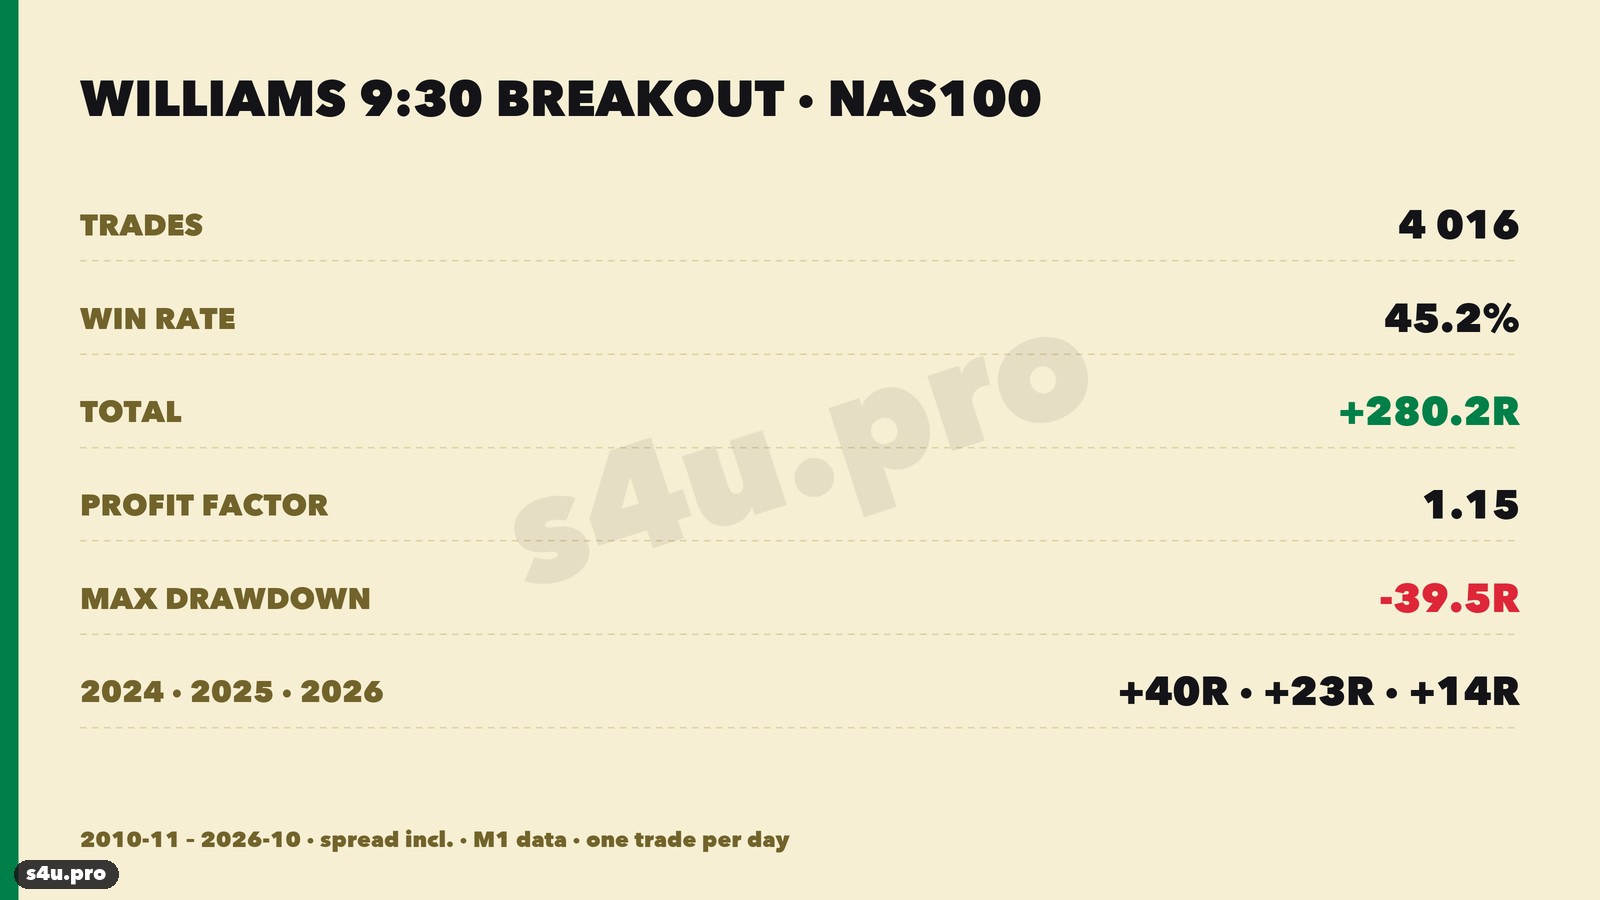
4 016 Trades · 45 % Gewinner · +280,2R · +0,070R pro Trade · Profitfaktor 1,15 · maximaler Drawdown −39,5R · bis zu 15 Verluste in Folge · 15 von 17 Jahren im Plus · 2025–2026: 470 Trades, +36,2R · mit dreifachem Spread +109R.
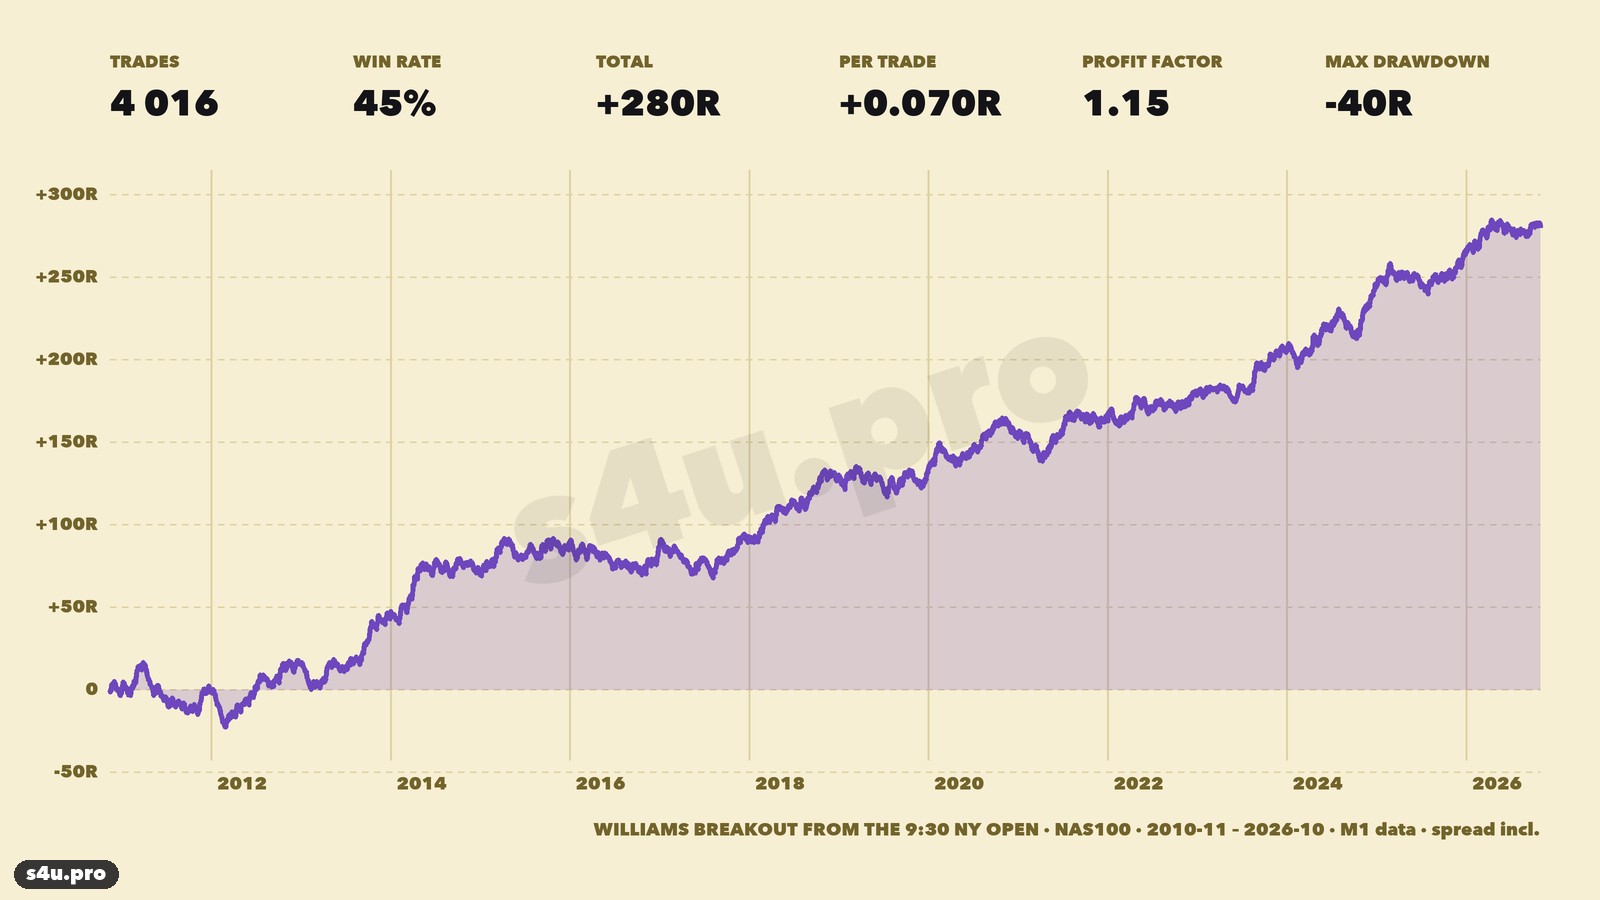
Die Kurve steigt gleichmäßig ohne lange Einbrüche: Der maximale Drawdown beträgt −39,5R, die längste Verlustserie 15 Trades. Es gibt nur zwei Verlustjahre, beide nahe null: 2010 (im Test nur November und Dezember) −3R und 2016 −3R. Die besten Jahre sind 2024 (+40R), 2018 (+34R) und 2013 (+29R).
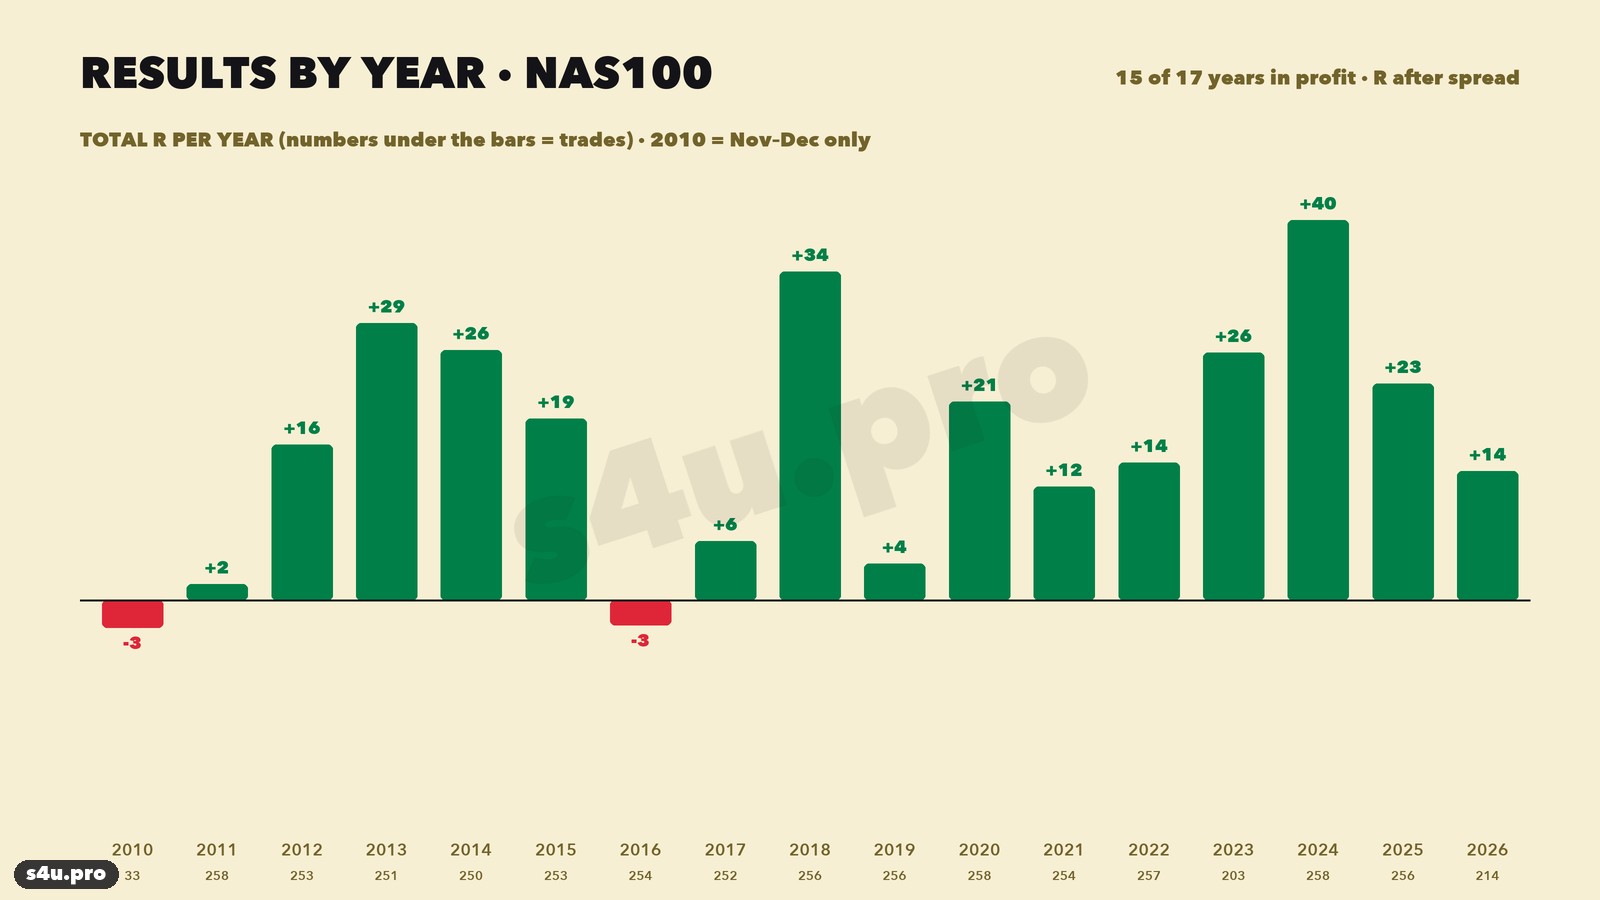
Die letzten Jahre: 2023 +26R, 2024 +40R, 2025 +23R, 2026 (Januar–Oktober) +14R.
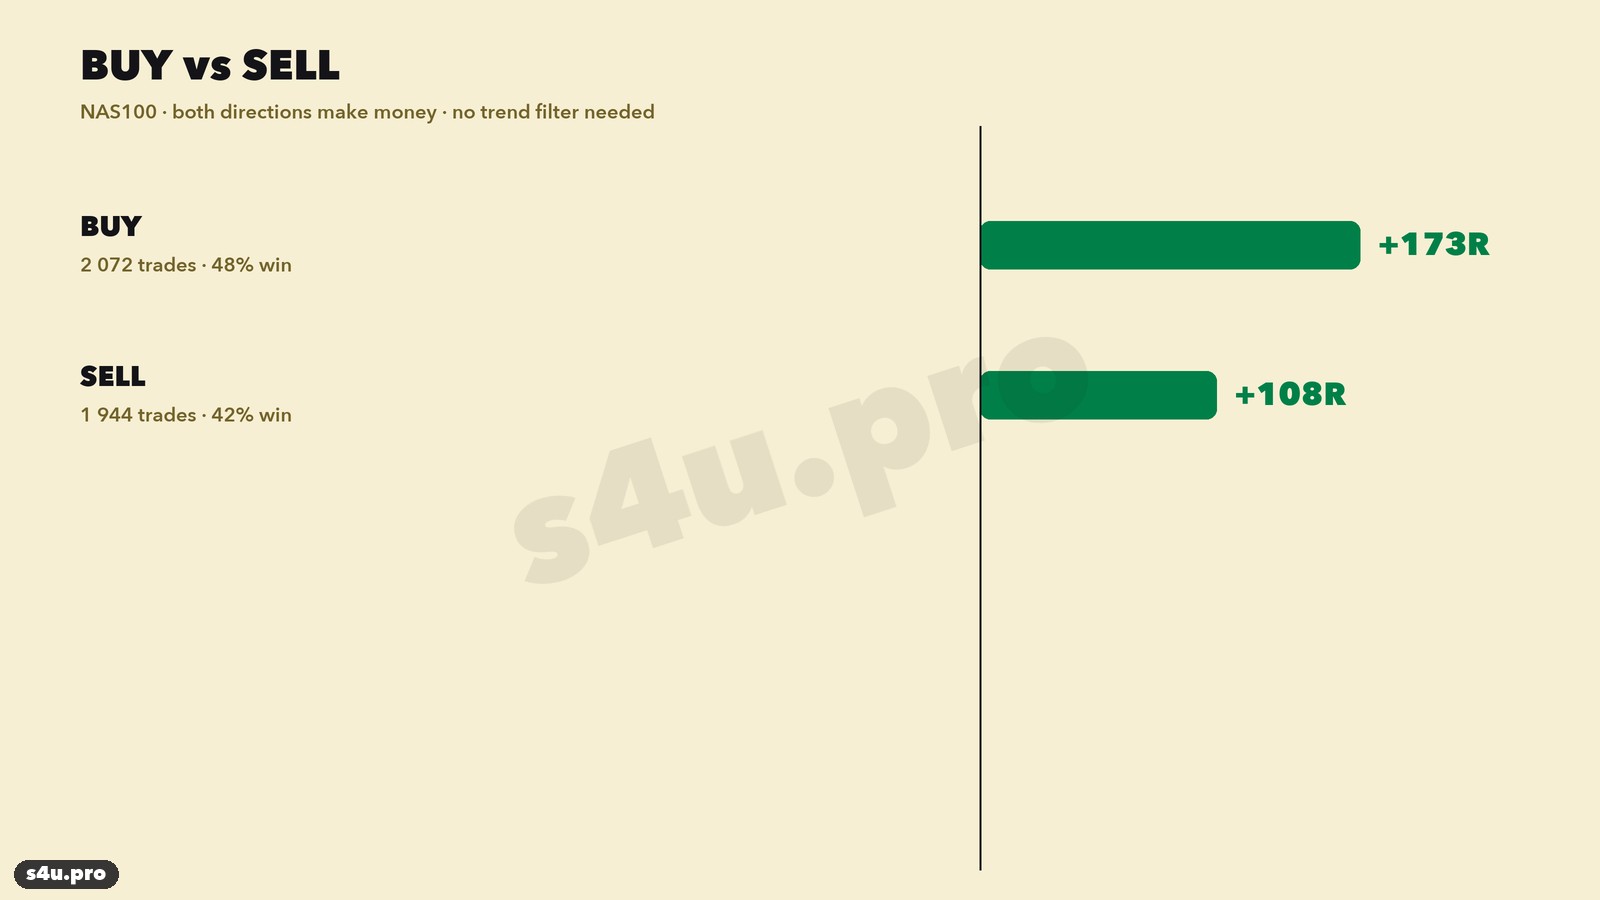
Käufe brachten +173R aus 2 072 Trades (48 % Gewinner), Verkäufe +108R aus 1 944 Trades (42 %). Ein Trendfilter ist nicht nötig: Die Strategie folgt einfach der ersten Bewegung des Tages, und die geht in beide Richtungen.
Von 4 016 Trades erreichten 238 das Ziel (+706R), 1 572 wurden ausgestoppt (−1 611R) und 2 206 um 16:00 zeitbasiert geschlossen (+1 186R, davon 72 % im Gewinn). Die Hauptquelle des Gewinns sind Trades, die den ganzen Tag gehalten werden: Steht die Tagesrichtung fest, läuft der Kurs bis Börsenschluss meist weiter.
Was das Ergebnis verändert
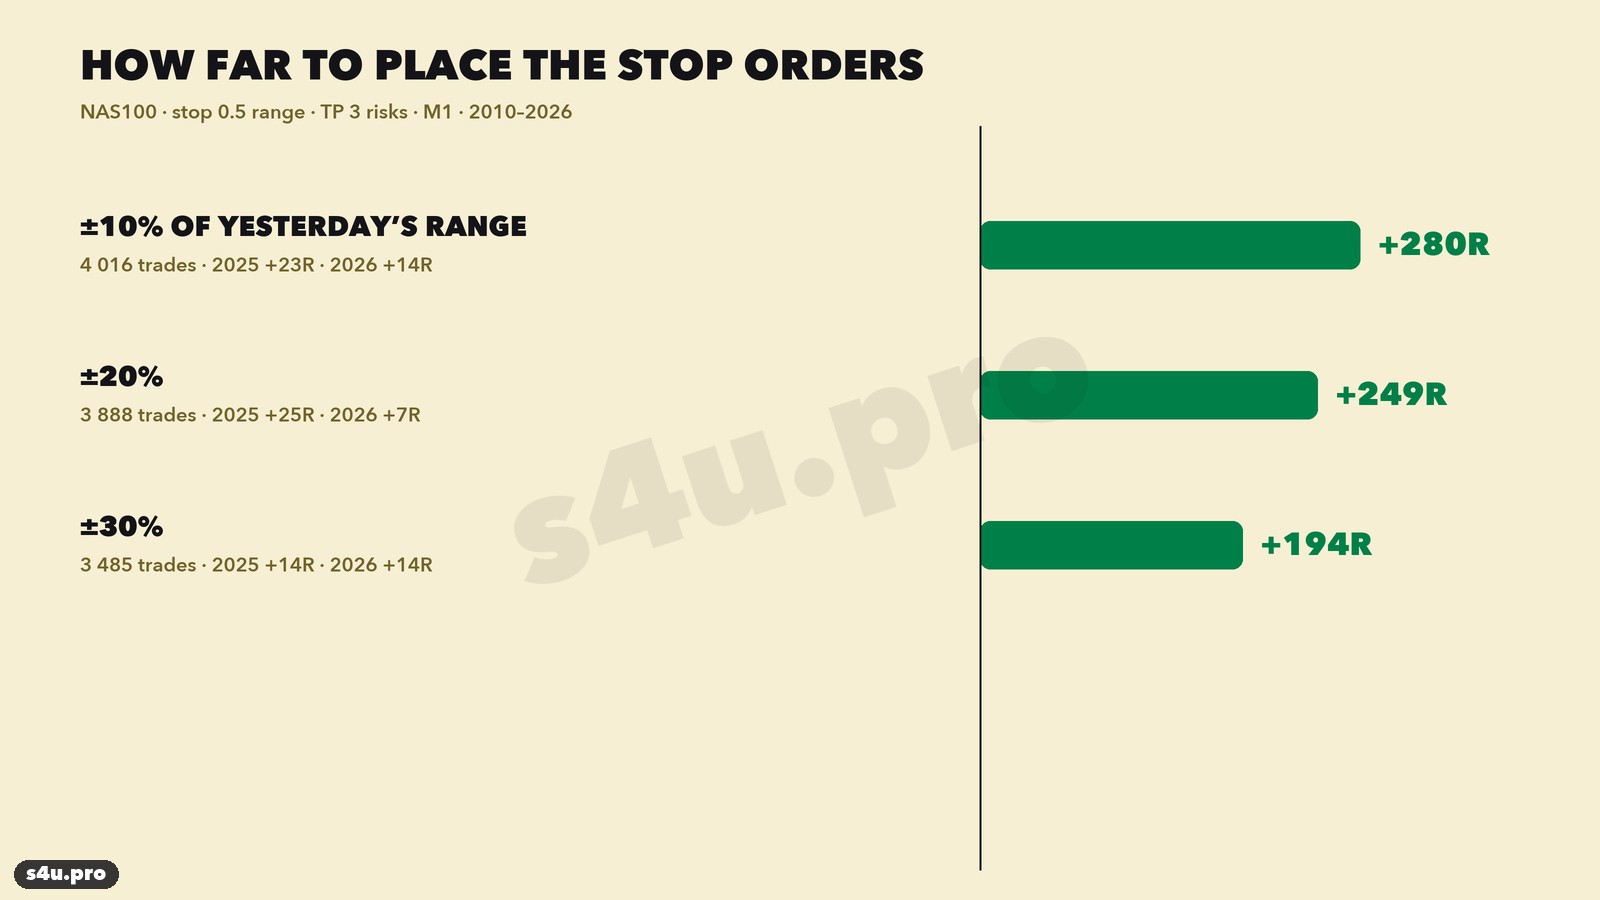
Abstand der Orders. 10 % der gestrigen Spanne — +280R, 20 % — +249R, 30 % — +194R. Je näher die Orders an der Eröffnung liegen, desto früher der Einstieg und desto mehr der Tagesbewegung bleibt für den Trade. Alle Varianten sind profitabel, auch 2025 und 2026.
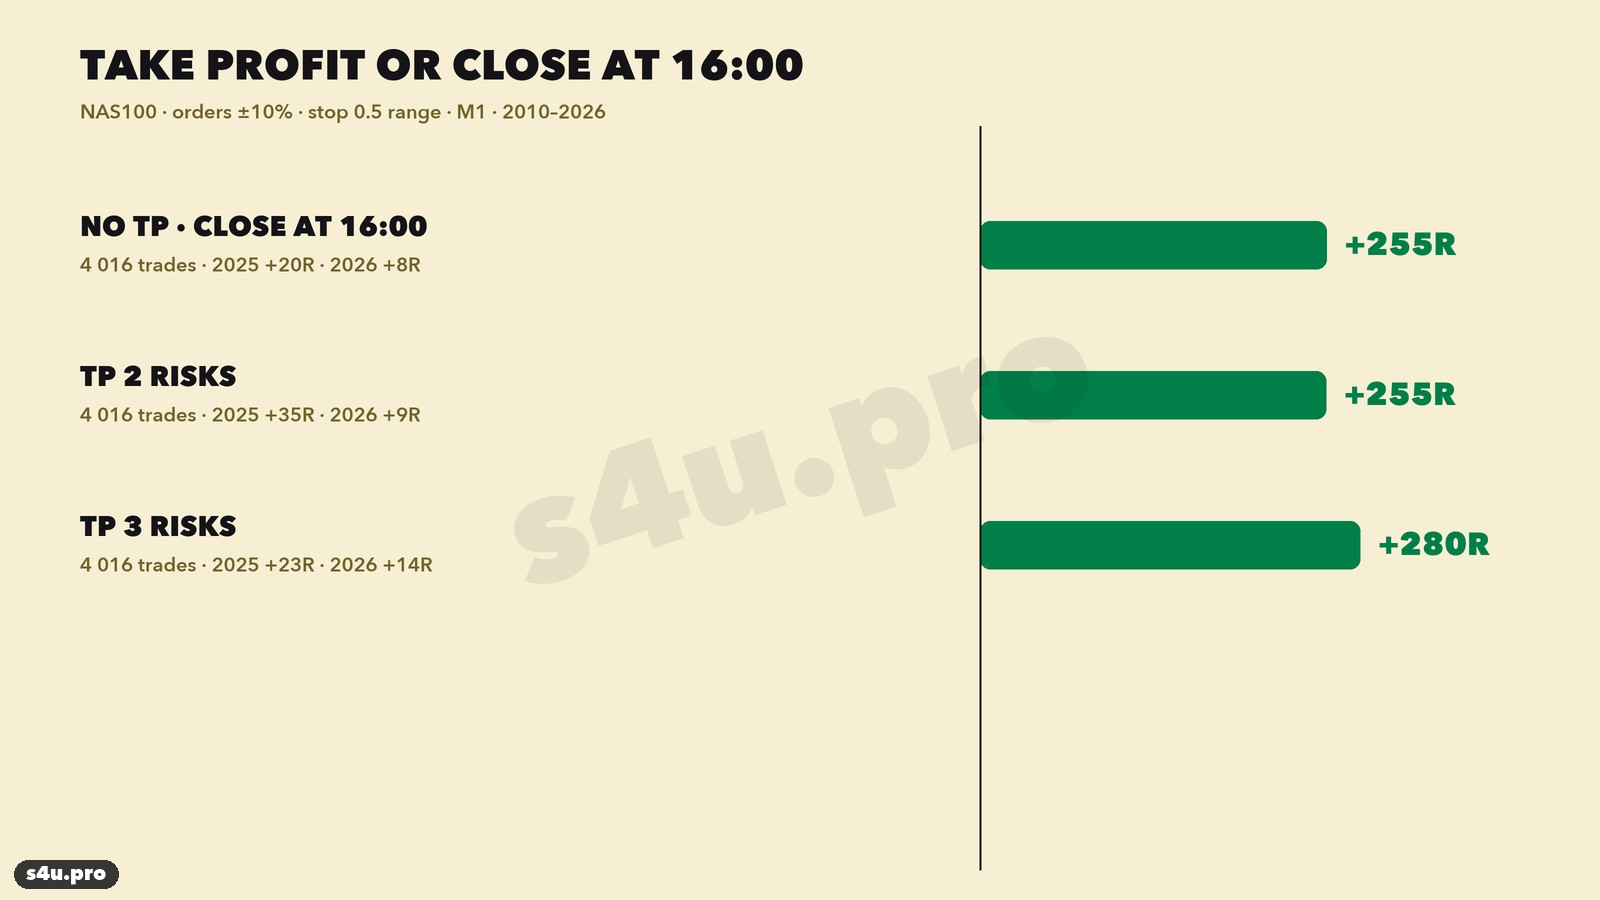
Ziel. Ohne Ziel, Ausstieg um 16:00 — +255R; Ziel 2R — +255R; Ziel 3R — +280R. Der Unterschied ist klein, weil das Ziel selten erreicht wird (6 % der Trades) — die Hauptarbeit leistet der Ausstieg zum Börsenschluss.
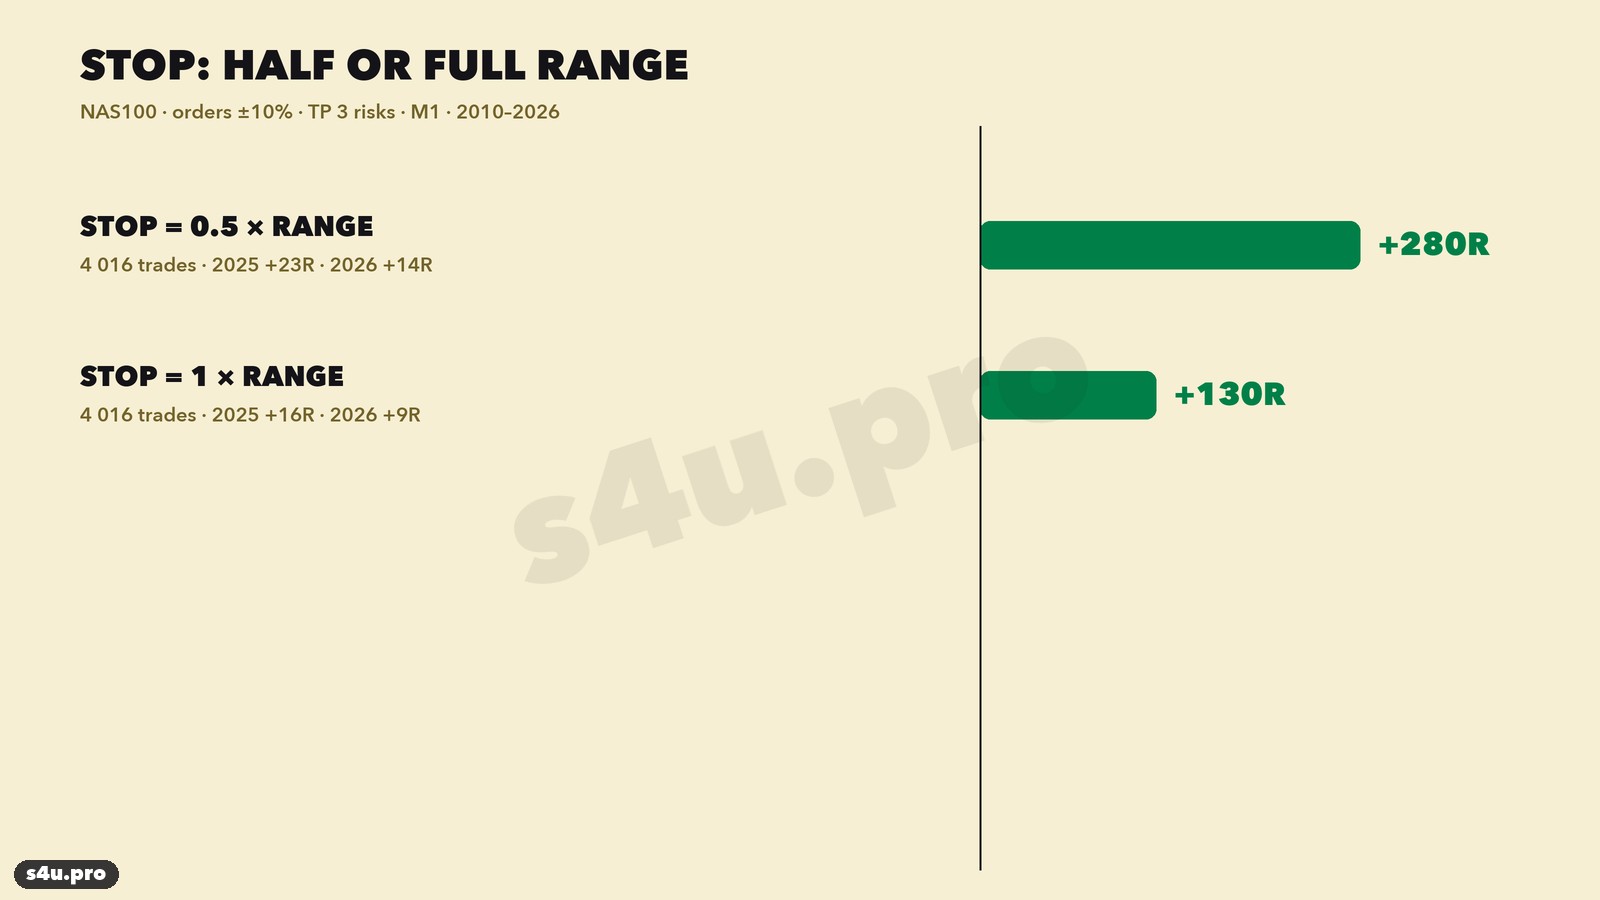
Stop. Halbe Spanne — +280R, ganze Spanne — +130R. Ein weiterer Stop wird seltener getroffen, aber jeder Trade wird in R halb so „groß“.
Wir haben 18 Kombinationen geprüft: Orderabstand 10/20/30 %, Stop 0,5 oder 1 Spanne, Ziel 2R, 3R oder Ausstieg um 16:00. Alle 18 sind profitabel (von +62R bis +280R), und in jeder sind auch 2025 und 2026 im Plus. Das Ergebnis hängt also nicht an einer glücklichen Einstellung.
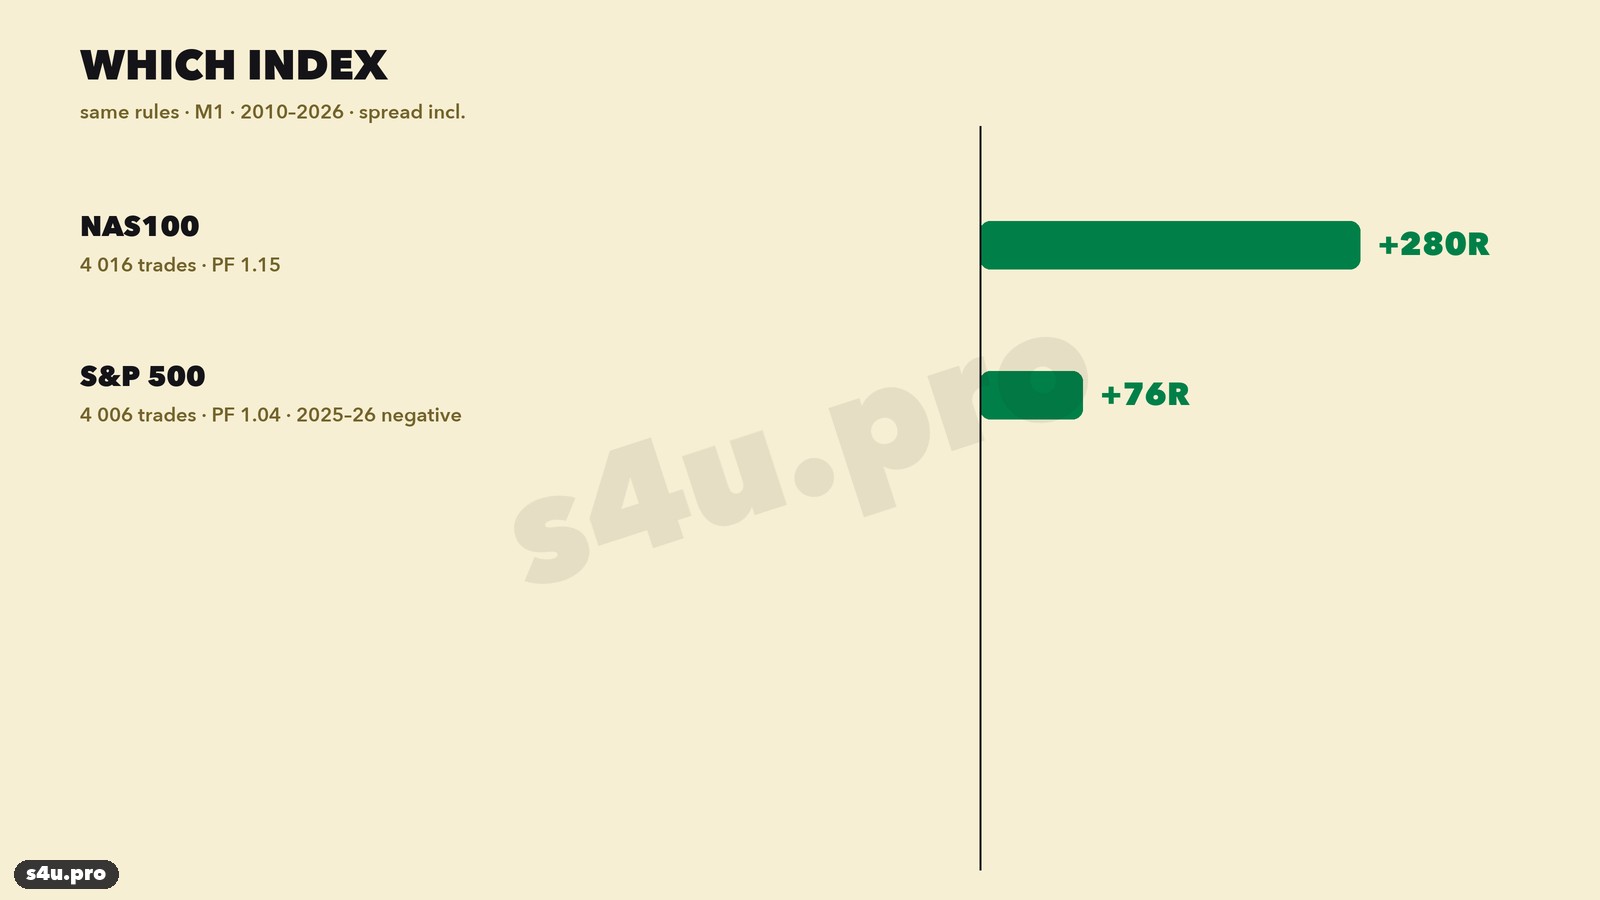
Markt. Im S&P 500 bringen dieselben Regeln nur +76R aus 4 006 Trades, und 2025 und 2026 sind negativ. Der S&P 500 ist ruhiger als der Nasdaq: Die Morgenbewegungen sind kürzer und drehen öfter. Die Strategie ist daher für den NAS100.
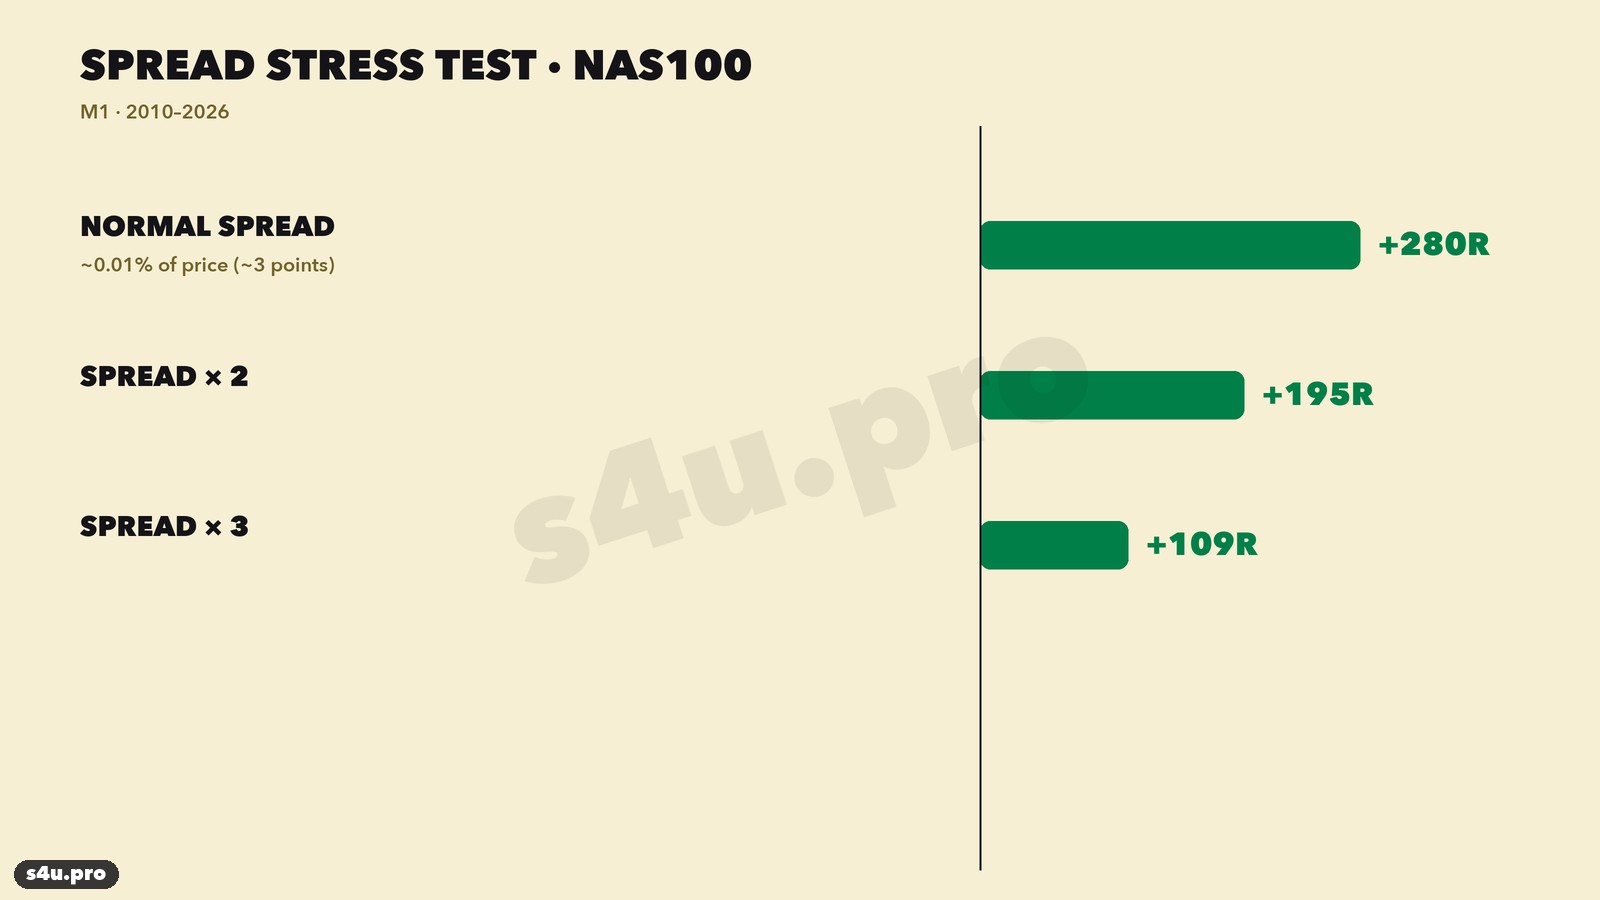
Spread. Wir haben 0,01 % des Kurses angesetzt (etwa 3 Punkte). Mit doppeltem Spread sind es +195R, mit dreifachem +109R, und die letzten Jahre bleiben im Plus. Der Stop ist groß (Hunderte Punkte), daher stören Spread und Slippage der Stop-Order kaum.
Warum es funktioniert
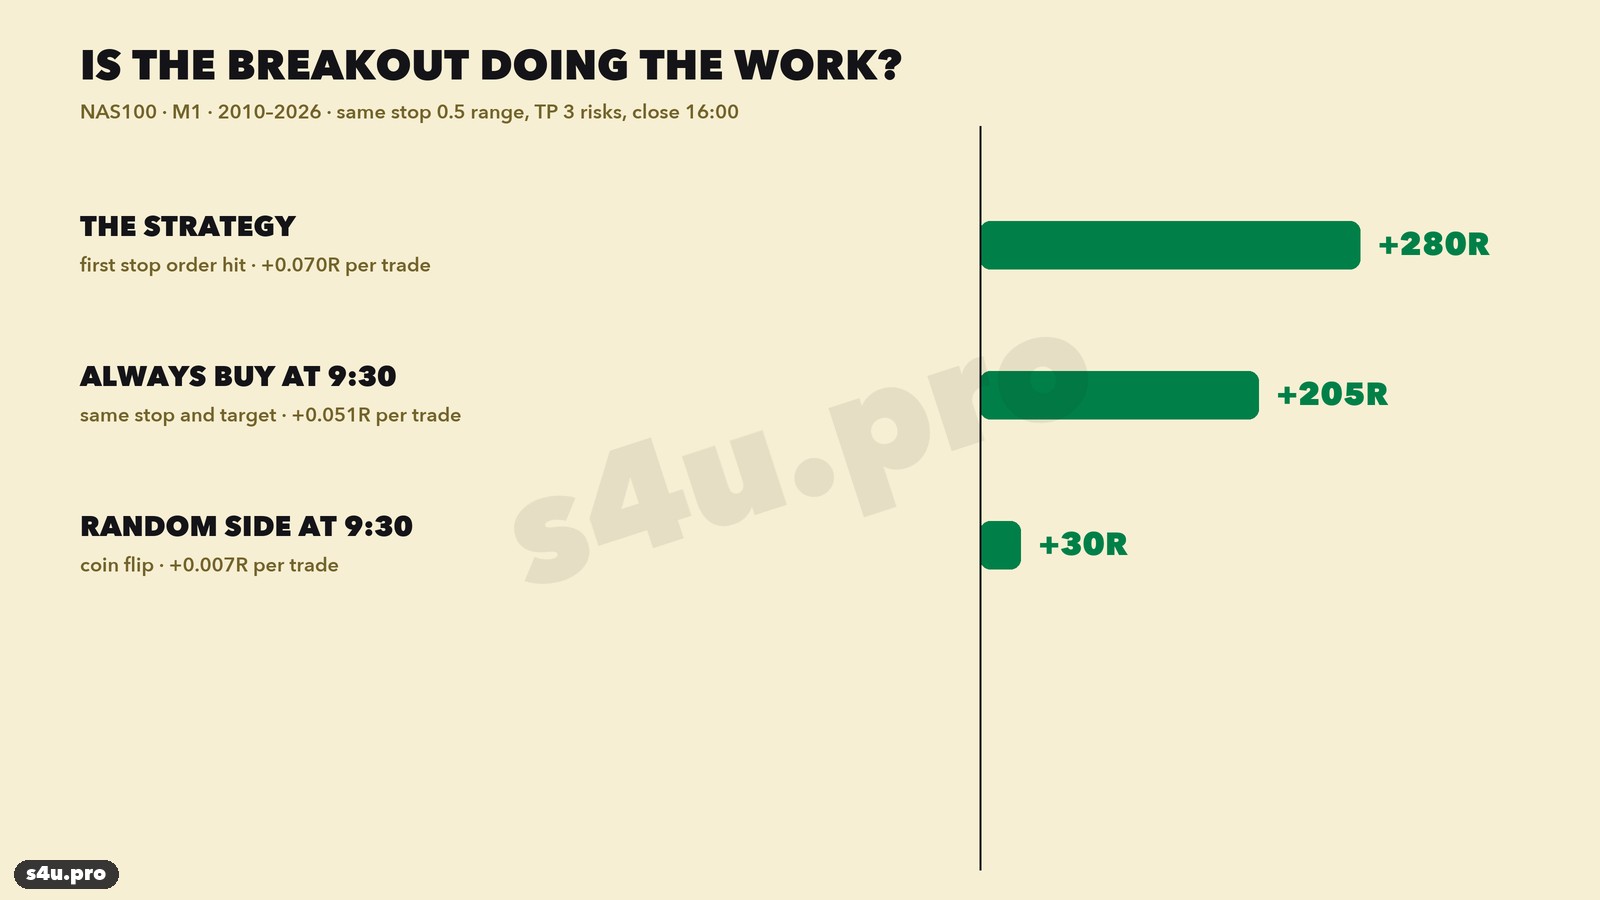
Wir haben getrennt geprüft, dass der Ausbruch wirkt und nicht nur der Anstieg des Nasdaq. An denselben Tagen, mit demselben Stop und Ziel:
- zufällige Richtung um 9:30 („Münzwurf“) — +30R, also +0,007R pro Trade, praktisch null;
- immer kaufen um 9:30 — +205R, +0,051R pro Trade: einfach der Indexanstieg über 16 Jahre;
- der Williams-Ausbruch — +280R, +0,070R pro Trade, und auch Verkäufe sind profitabel.
Die Logik: Um 9:30 öffnet die Börse, und in den ersten Minuten werden alle über Nacht gesammelten Orders ausgeführt. Dominieren die Käufer, läuft der Kurs schnell 10 % der gestrigen Spanne nach oben — und steigt häufiger bis zum Abend weiter, weil große Fonds den ganzen Tag Positionen aufbauen. Die gestrige Spanne passt Orderabstand und Stop an die aktuelle Volatilität an: an ruhigen Tagen enger, an wilden Tagen weiter.
Williams und Silver Bullet: zwei Strategien auf einem Index
Im NAS100 haben wir noch eine getestete Morgenstrategie — Silver Bullet (FVG-Einstieg von 10:00 bis 11:00 New York). Die Zeit ist ähnlich, also haben wir geprüft, ob sie sich doppeln.
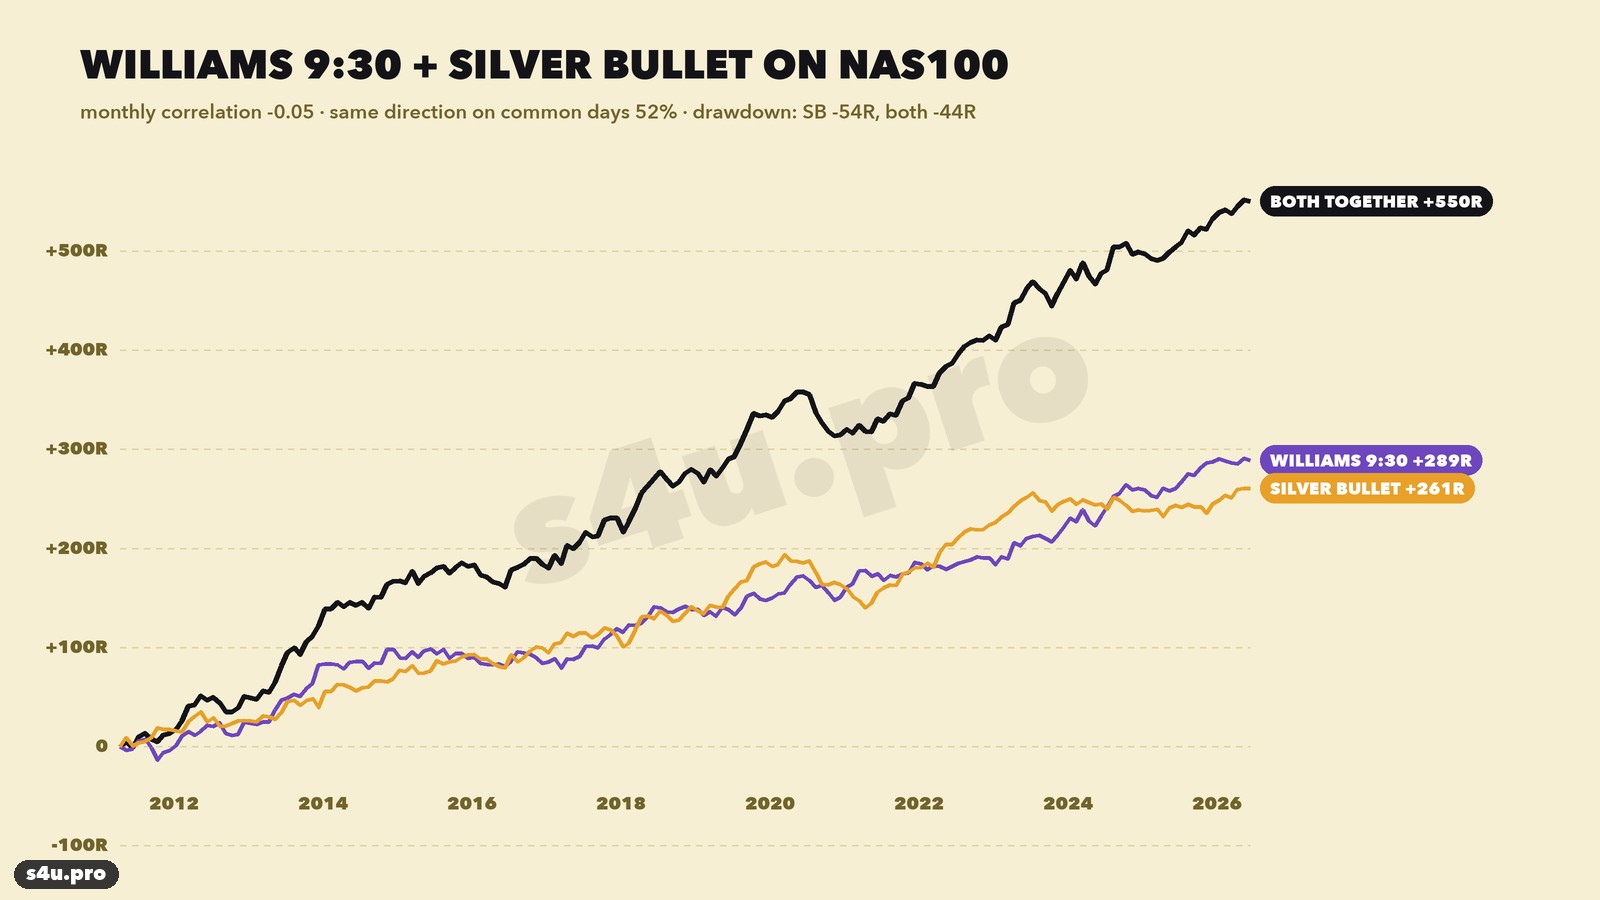
- An Tagen, an denen beide handeln, stimmt die Richtung nur in 52 % der Fälle überein — wie bei Zufallseinstiegen.
- Die Korrelation der Monatsergebnisse beträgt −0,05, also praktisch null.
- Zusammen bringen sie im NAS100 etwa +550R, und der monatliche Drawdown des Paares (−45R) ist kleiner als der von Silver Bullet allein (−54R).
Es sind also zwei verschiedene Strategien: Silver Bullet nutzt den Rücklauf in die Lücke nach einem Impuls, Williams folgt der ersten Bewegung des Tages. Beide lassen sich zusammen handeln — jede mit eigenem Risiko.
Trade-Beispiele Schritt für Schritt
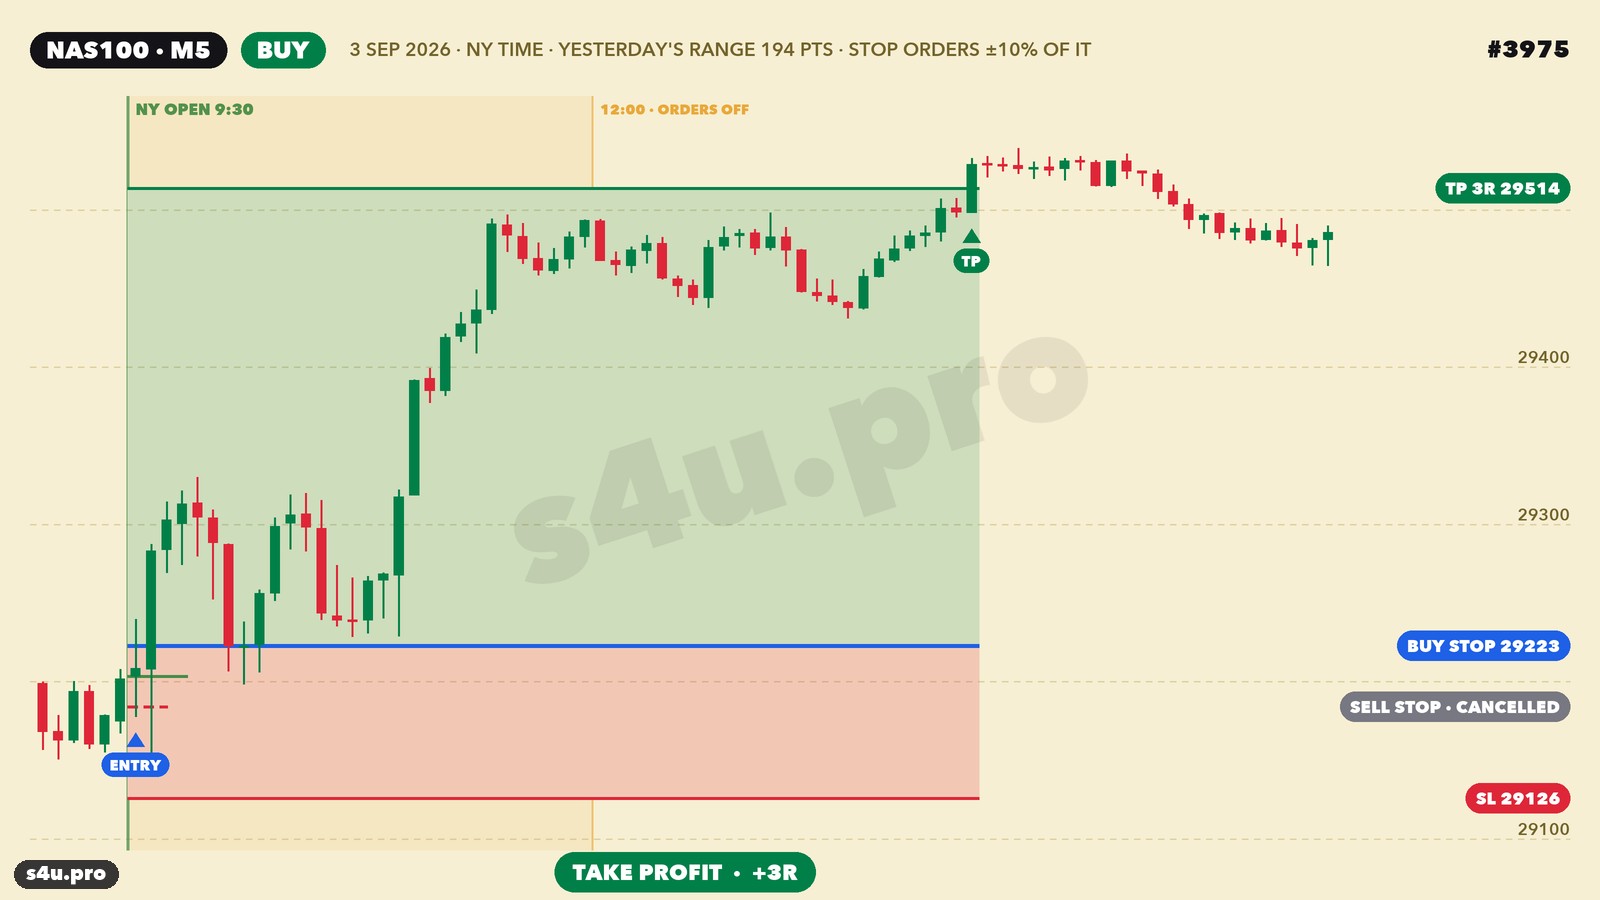
NAS100, 3. September 2026, Kauf. Die gestrige Spanne 9:30–16:00 betrug 194 Punkte, 10 % davon sind 19 Punkte. Eröffnung um 9:30: 29 204; Buy Stop 29 223, Sell Stop 29 184. Der Kurs stieg gleich um 9:30, der Buy Stop wurde ausgeführt, der Sell Stop gelöscht. Stop 29 126 (97 Punkte). Um 14:01 erreichte der Kurs das Ziel 29 514: +3R.
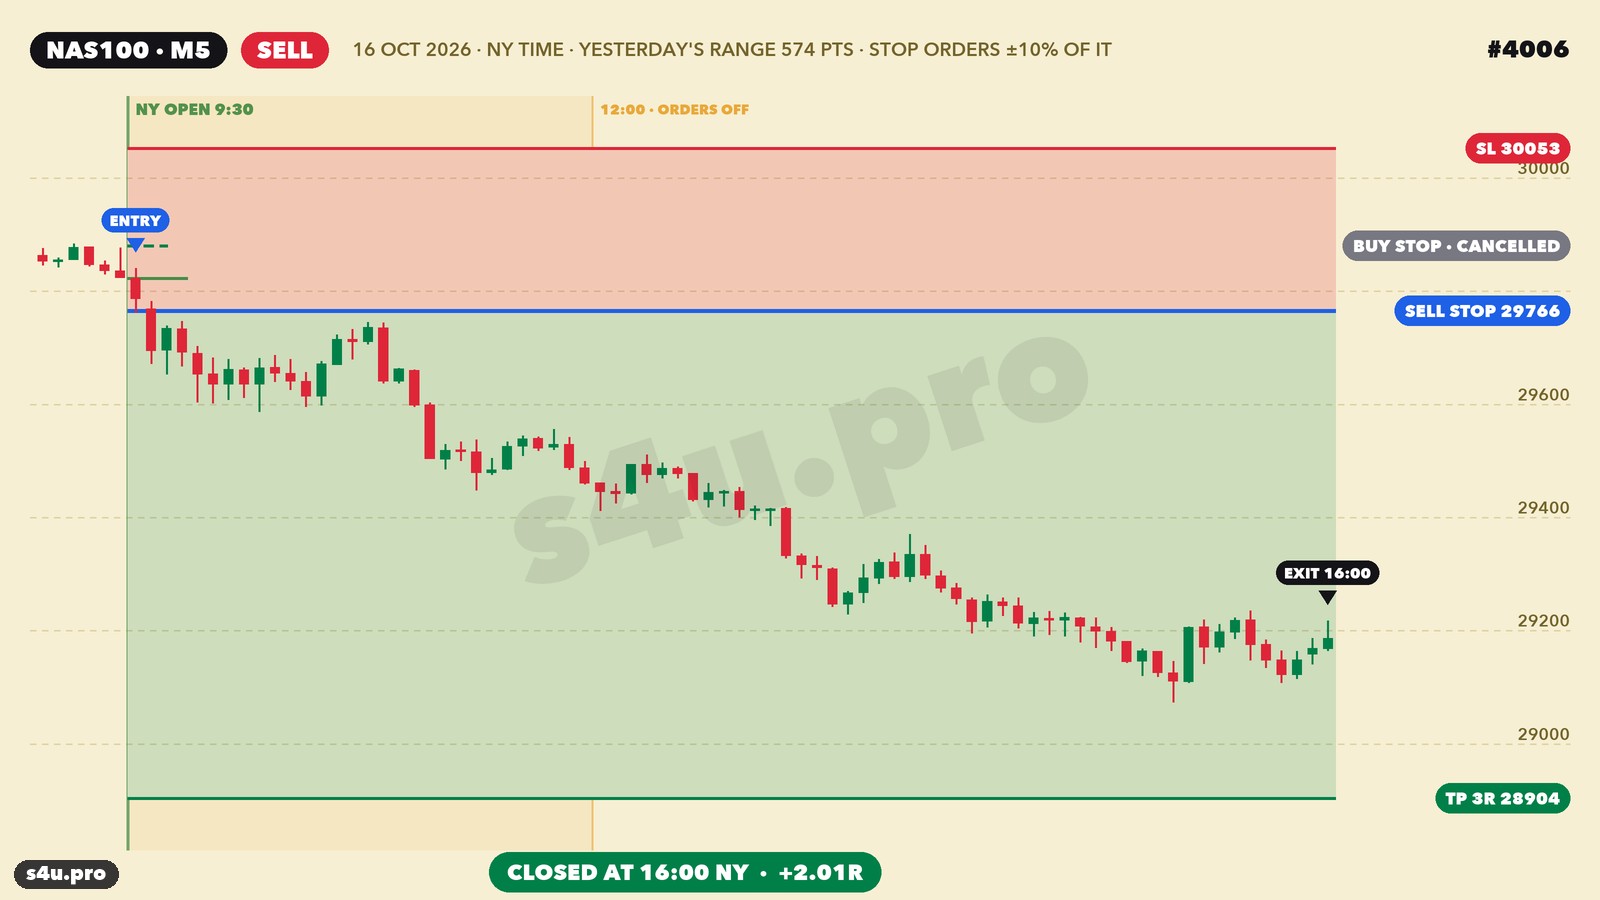
NAS100, 16. Oktober 2026, Verkauf. Die gestrige Spanne war groß — 574 Punkte, die Orders liegen also 57 Punkte von der Eröffnung 29 823 entfernt. Um 9:31 wurde der Sell Stop bei 29 766 ausgeführt, Stop 30 053 (287 Punkte). Der Kurs fiel den ganzen Tag, erreichte das Ziel aber nicht, und um 16:00 wurde der Trade bei 29 187 geschlossen: +576 Punkte, +2,0R.
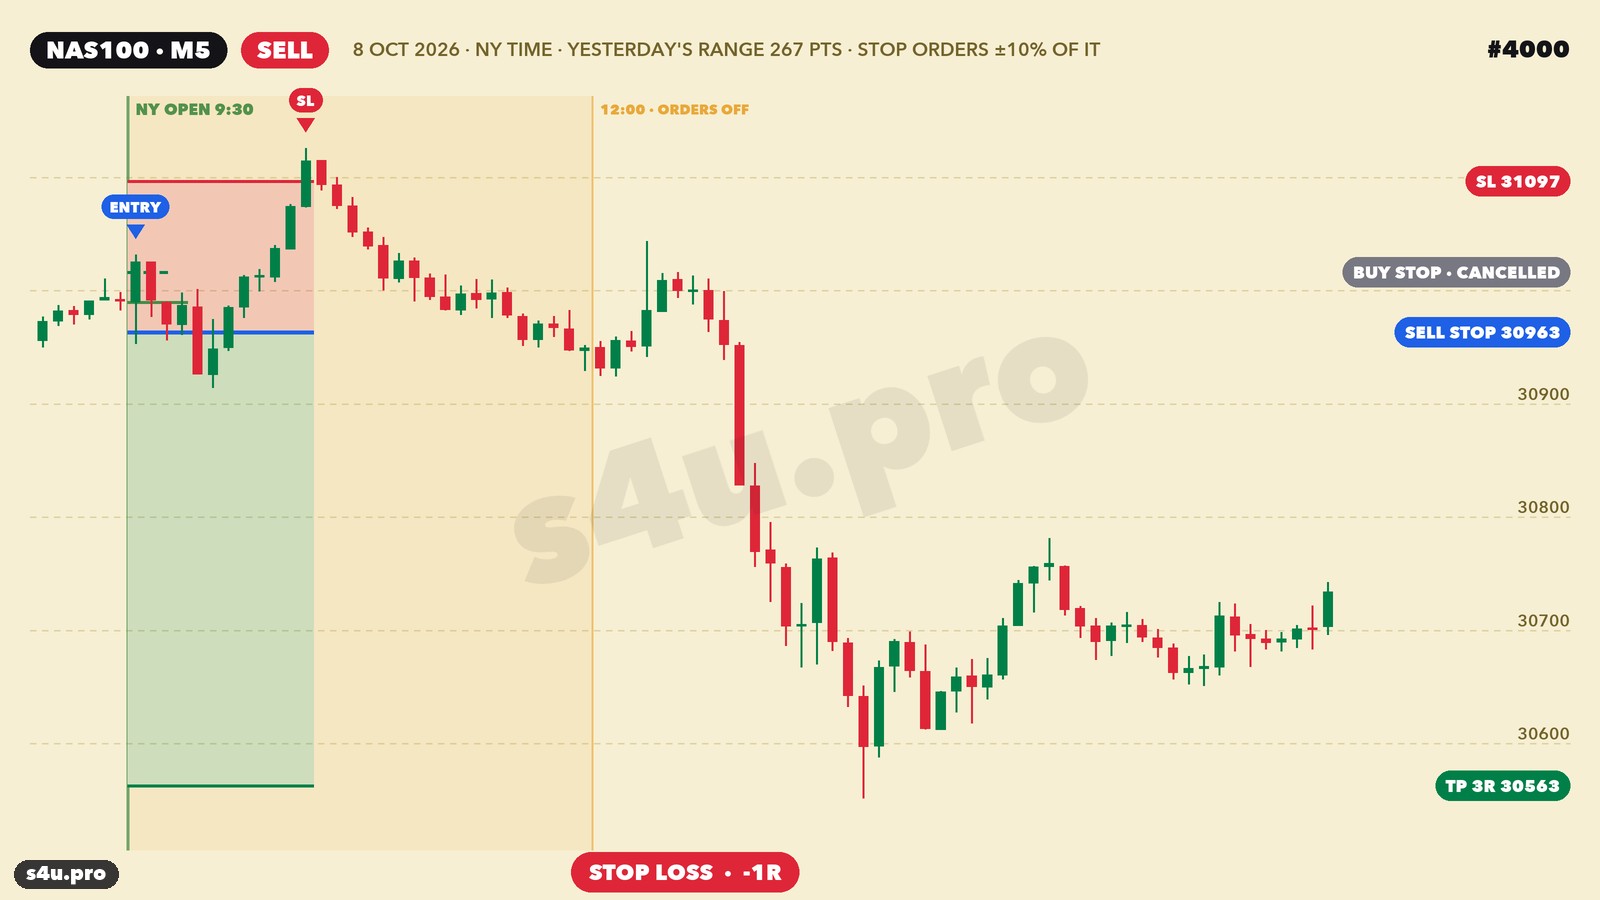
NAS100, 8. Oktober 2026, Verkauf — ausgestoppt. Der Sell Stop wurde bei 30 963 in der ersten Minute ausgeführt, doch eine Stunde später drehte der Kurs nach oben und traf um 10:29 den Stop 31 097: −1R. So enden 39 % der Trades: Die Strategie verdient, weil Gewinntage im Schnitt größer sind als Verlusttage.
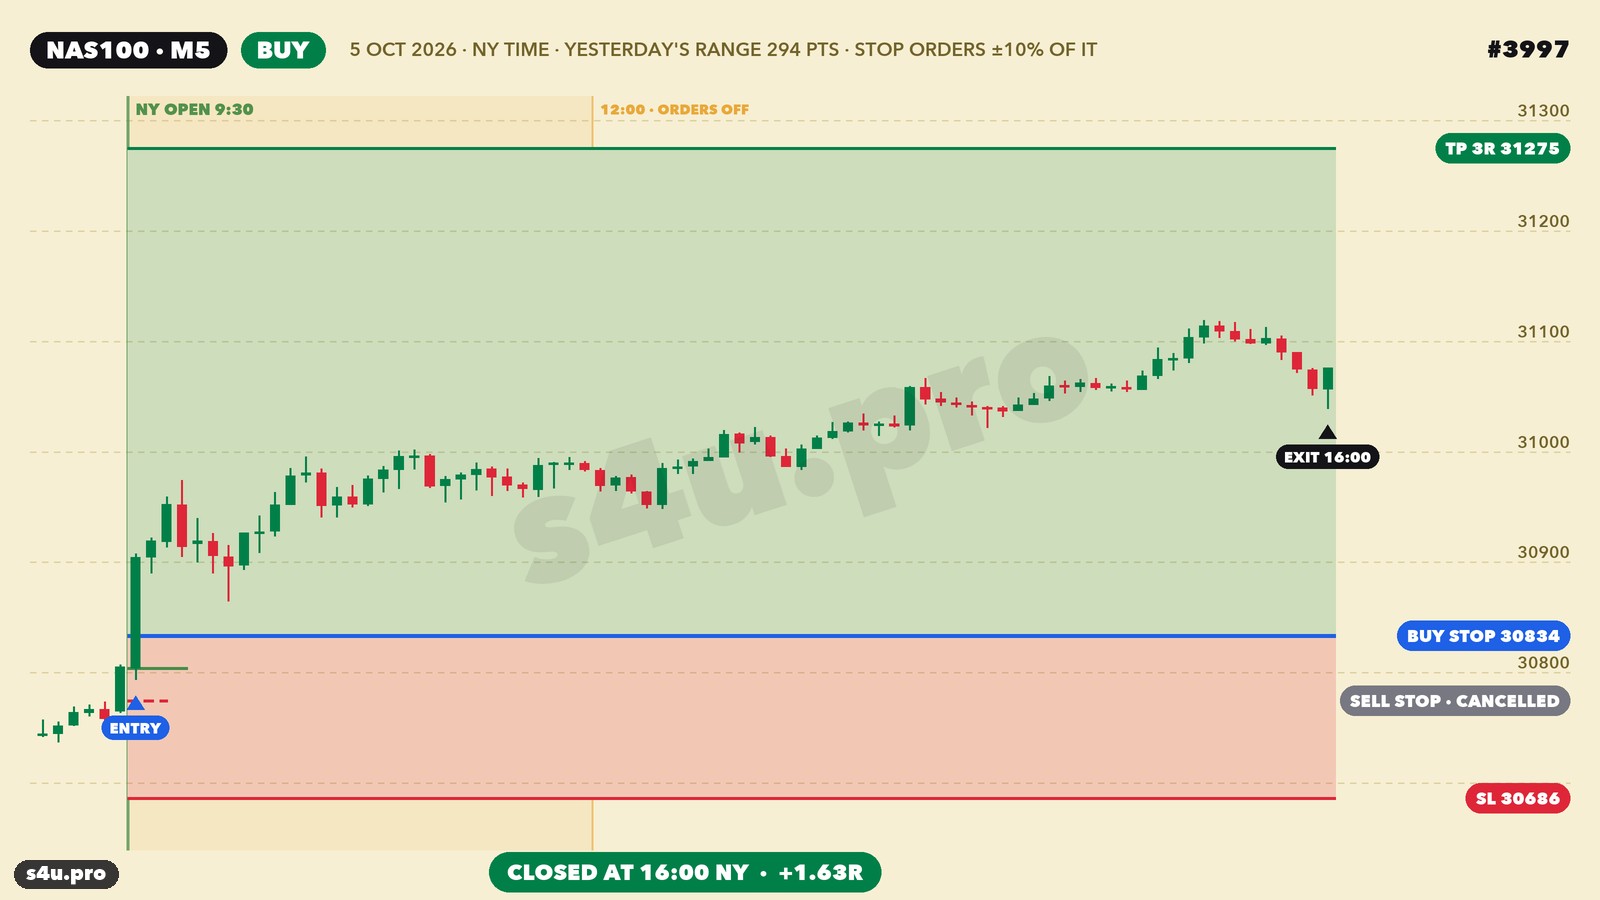
NAS100, 5. Oktober 2026, Kauf. Spanne 294 Punkte, der Buy Stop 30 834 wurde um 9:31 ausgeführt, Stop 30 686. Der Kurs stieg den ganzen Tag, erreichte das Ziel 31 275 aber nicht. Ausstieg um 16:00 bei 31 076: +240 Punkte, +1,6R.
Galerie: alle Trades 2025–2026
Alle 470 Trades aus 2025–2026: 30 am Ziel, 183 ausgestoppt, 257 zeitbasiert geschlossen, gesamt +36,2R. Klicken Sie auf ein Bild, um den Chart zu öffnen.
| # | Markt | Eröffnet | Richtung | Einstieg | Stop | Ziel | Ausstieg | Ergebnis | Punkte | R | Chart |
|---|---|---|---|---|---|---|---|---|---|---|---|
| 4016 | NAS100 | 30.10.26 09:37 | BUY | 28590.06 | 28307.97 | 29436.31 | 28307.97 | SL | -284,9 | -1,01R | |
| 4015 | NAS100 | 29.10.26 09:33 | BUY | 29460.96 | 29264.05 | 30051.69 | 29264.05 | SL | -199,9 | -1,01R | |
| 4014 | NAS100 | 28.10.26 09:38 | SELL | 29659.26 | 29795.04 | 29251.93 | 29795.04 | SL | -138,7 | -1,02R | |
| 4013 | NAS100 | 27.10.26 09:31 | BUY | 29478.28 | 29341.97 | 29887.23 | 29635.65 | Zeit | +154,4 | +1,13R | |
| 4012 | NAS100 | 26.10.26 09:30 | SELL | 29153.55 | 29322.63 | 28646.32 | 29322.63 | SL | -172,0 | -1,02R | |
| 4011 | NAS100 | 23.10.26 09:32 | BUY | 28918.01 | 28641.33 | 29748.04 | 28958.81 | Zeit | +37,9 | +0,14R | |
| 4010 | NAS100 | 22.10.26 09:30 | SELL | 29297.52 | 29468.85 | 28783.52 | 28975.92 | Zeit | +318,7 | +1,86R | |
| 4009 | NAS100 | 21.10.26 09:37 | SELL | 29636.51 | 29892.00 | 28870.03 | 29892.00 | SL | -258,5 | -1,01R | |
| 4008 | NAS100 | 20.10.26 09:30 | SELL | 29368.50 | 29533.12 | 28874.63 | 29533.12 | SL | -167,6 | -1,02R | |
| 4007 | NAS100 | 19.10.26 09:57 | SELL | 29508.10 | 29891.24 | 28358.69 | 29528.55 | Zeit | -23,4 | -0,06R | |
| 4006 | NAS100 | 16.10.26 09:31 | SELL | 29765.72 | 30052.87 | 28904.27 | 29186.80 | Zeit | +575,9 | +2,01R | |
| 4005 | NAS100 | 15.10.26 09:30 | SELL | 29472.80 | 29762.84 | 28602.68 | 29762.84 | SL | -293,0 | -1,01R | |
| 4004 | NAS100 | 14.10.26 09:30 | BUY | 30353.49 | 30241.24 | 30690.24 | 30241.24 | SL | -115,3 | -1,03R | |
| 4003 | NAS100 | 13.10.26 09:30 | BUY | 30415.98 | 30314.12 | 30721.58 | 30567.92 | Zeit | +148,9 | +1,46R | |
| 4002 | NAS100 | 12.10.26 09:30 | SELL | 30800.00 | 30892.08 | 30523.77 | 30671.59 | Zeit | +125,3 | +1,36R | |
| 4001 | NAS100 | 09.10.26 09:36 | SELL | 30877.98 | 31164.98 | 30016.98 | 30876.56 | Zeit | -1,7 | -0,01R | |
| 4000 | NAS100 | 08.10.26 09:30 | SELL | 30963.23 | 31096.70 | 30562.79 | 31096.70 | SL | -136,6 | -1,02R | |
| 3999 | NAS100 | 07.10.26 09:30 | BUY | 30998.28 | 30920.13 | 31232.73 | 30920.13 | SL | -81,2 | -1,04R | |
| 3998 | NAS100 | 06.10.26 09:30 | BUY | 31295.91 | 31133.05 | 31784.50 | 31227.15 | Zeit | -71,9 | -0,44R | |
| 3997 | NAS100 | 05.10.26 09:31 | BUY | 30833.58 | 30686.35 | 31275.26 | 31076.31 | Zeit | +239,7 | +1,63R | |
| 3996 | NAS100 | 02.10.26 09:30 | SELL | 30856.81 | 31034.15 | 30324.79 | 30812.86 | Zeit | +40,9 | +0,23R | |
| 3995 | NAS100 | 01.10.26 09:30 | BUY | 30551.64 | 30439.52 | 30888.01 | 30439.52 | SL | -115,2 | -1,03R | |
| 3994 | NAS100 | 30.09.26 09:30 | BUY | 30448.98 | 30340.84 | 30773.42 | 30412.42 | Zeit | -39,6 | -0,37R | |
| 3993 | NAS100 | 29.09.26 09:30 | SELL | 30389.87 | 30590.05 | 29789.36 | 30333.92 | Zeit | +52,9 | +0,26R | |
| 3992 | NAS100 | 28.09.26 09:31 | SELL | 30414.60 | 30546.87 | 30017.78 | 30282.82 | Zeit | +128,7 | +0,97R | |
| 3991 | NAS100 | 25.09.26 09:30 | SELL | 30503.98 | 30672.00 | 29999.93 | 30672.00 | SL | -171,1 | -1,02R | |
| 3990 | NAS100 | 24.09.26 09:35 | BUY | 30261.71 | 30078.42 | 30811.60 | 30465.72 | Zeit | +201,0 | +1,10R | |
| 3989 | NAS100 | 23.09.26 09:30 | SELL | 30677.50 | 30830.17 | 30219.46 | 30478.32 | Zeit | +196,1 | +1,28R | |
| 3988 | NAS100 | 22.09.26 09:31 | BUY | 30524.13 | 30211.26 | 31462.74 | 30729.92 | Zeit | +202,7 | +0,65R | |
| 3987 | NAS100 | 21.09.26 09:30 | BUY | 29961.37 | 29822.34 | 30378.47 | 30378.47 | TP | +414,1 | +2,98R | |
| 3986 | NAS100 | 18.09.26 09:31 | BUY | 29534.97 | 29441.62 | 29815.00 | 29441.62 | SL | -96,3 | -1,03R | |
| 3985 | NAS100 | 17.09.26 09:32 | SELL | 29362.98 | 29610.89 | 28619.25 | 29425.90 | Zeit | -65,9 | -0,27R | |
| 3984 | NAS100 | 16.09.26 09:30 | BUY | 29107.23 | 28988.13 | 29464.51 | 28988.13 | SL | -122,0 | -1,02R | |
| 3983 | NAS100 | 15.09.26 09:31 | SELL | 29062.12 | 29275.42 | 28422.21 | 28943.74 | Zeit | +115,5 | +0,54R | |
| 3982 | NAS100 | 14.09.26 09:30 | BUY | 28900.68 | 28818.07 | 29148.49 | 29148.49 | TP | +244,9 | +2,96R | |
| 3981 | NAS100 | 11.09.26 09:30 | SELL | 29375.86 | 29484.81 | 29049.03 | 29364.83 | Zeit | +8,1 | +0,07R | |
| 3980 | NAS100 | 10.09.26 09:30 | BUY | 29090.20 | 28972.69 | 29442.71 | 29108.39 | Zeit | +15,3 | +0,13R | |
| 3979 | NAS100 | 09.09.26 09:30 | SELL | 29402.18 | 29532.56 | 29011.04 | 29532.56 | SL | -133,3 | -1,02R | |
| 3978 | NAS100 | 08.09.26 09:30 | BUY | 29619.67 | 29579.12 | 29741.33 | 29579.12 | SL | -43,5 | -1,07R | |
| 3977 | NAS100 | 07.09.26 09:32 | BUY | 29601.74 | 29490.41 | 29935.73 | 29571.25 | Zeit | -33,4 | -0,30R | |
| 3976 | NAS100 | 04.09.26 09:34 | BUY | 29587.64 | 29395.54 | 30163.96 | 29532.47 | Zeit | -58,1 | -0,30R | |
| 3975 | NAS100 | 03.09.26 09:30 | BUY | 29222.97 | 29126.03 | 29513.81 | 29513.81 | TP | +287,9 | +2,97R | |
| 3974 | NAS100 | 02.09.26 09:30 | SELL | 29020.46 | 29177.82 | 28548.36 | 29144.31 | Zeit | -126,8 | -0,81R | |
| 3973 | NAS100 | 01.09.26 09:30 | SELL | 29044.68 | 29136.76 | 28768.45 | 29136.76 | SL | -95,0 | -1,03R | |
| 3972 | NAS100 | 31.08.26 09:30 | BUY | 29422.36 | 29234.65 | 29985.50 | 29449.17 | Zeit | +23,9 | +0,13R | |
| 3971 | NAS100 | 28.08.26 09:30 | SELL | 29541.97 | 29681.55 | 29123.24 | 29681.55 | SL | -142,5 | -1,02R | |
| 3970 | NAS100 | 27.08.26 09:30 | BUY | 29485.30 | 29379.53 | 29802.61 | 29379.53 | SL | -108,7 | -1,03R | |
| 3969 | NAS100 | 26.08.26 09:30 | BUY | 29129.19 | 29004.19 | 29504.19 | 29233.99 | Zeit | +101,9 | +0,81R | |
| 3968 | NAS100 | 25.08.26 09:31 | BUY | 29248.96 | 29103.38 | 29685.69 | 29103.38 | SL | -148,5 | -1,02R | |
| 3967 | NAS100 | 24.08.26 09:30 | SELL | 29135.37 | 29270.00 | 28731.47 | 29020.88 | Zeit | +111,6 | +0,83R | |
| 3966 | NAS100 | 21.08.26 09:30 | SELL | 29361.44 | 29493.91 | 28964.02 | 29317.32 | Zeit | +41,2 | +0,31R | |
| 3965 | NAS100 | 20.08.26 09:30 | BUY | 29294.33 | 29111.60 | 29842.52 | 29209.03 | Zeit | -88,2 | -0,48R | |
| 3964 | NAS100 | 19.08.26 09:30 | SELL | 29582.96 | 29710.43 | 29200.54 | 29427.56 | Zeit | +152,4 | +1,20R | |
| 3963 | NAS100 | 18.08.26 09:30 | BUY | 29619.92 | 29510.14 | 29949.27 | 29510.14 | SL | -112,7 | -1,03R | |
| 3962 | NAS100 | 17.08.26 09:30 | BUY | 30151.10 | 30027.26 | 30522.60 | 30027.26 | SL | -126,8 | -1,02R | |
| 3961 | NAS100 | 14.08.26 09:35 | SELL | 30103.83 | 30306.83 | 29494.83 | 30047.04 | Zeit | +53,8 | +0,27R | |
| 3960 | NAS100 | 13.08.26 09:30 | SELL | 29789.52 | 29880.36 | 29517.02 | 29880.36 | SL | -93,8 | -1,03R | |
| 3959 | NAS100 | 12.08.26 09:31 | SELL | 29855.61 | 30007.18 | 29400.89 | 29749.43 | Zeit | +103,2 | +0,68R | |
| 3958 | NAS100 | 11.08.26 09:30 | SELL | 29710.10 | 29800.60 | 29438.60 | 29438.60 | TP | +268,5 | +2,97R | |
| 3957 | NAS100 | 10.08.26 09:30 | BUY | 29721.56 | 29575.31 | 30160.31 | 29629.85 | Zeit | -94,7 | -0,65R | |
| 3956 | NAS100 | 07.08.26 09:33 | BUY | 29662.14 | 29437.04 | 30337.46 | 29715.30 | Zeit | +50,2 | +0,22R | |
| 3955 | NAS100 | 06.08.26 09:32 | SELL | 29164.05 | 29402.90 | 28447.50 | 29402.90 | SL | -241,8 | -1,01R | |
| 3954 | NAS100 | 05.08.26 09:43 | BUY | 29923.49 | 29553.47 | 31033.54 | 29553.47 | SL | -373,0 | -1,01R | |
| 3953 | NAS100 | 04.08.26 09:30 | BUY | 29177.61 | 28859.82 | 30130.98 | 29736.13 | Zeit | +555,6 | +1,75R | |
| 3952 | NAS100 | 03.08.26 09:31 | SELL | 28233.34 | 28556.31 | 27264.44 | 28556.31 | SL | -325,8 | -1,01R | |
| 3951 | NAS100 | 31.07.26 09:32 | BUY | 28499.61 | 28256.47 | 29229.04 | 28256.47 | SL | -246,0 | -1,01R | |
| 3950 | NAS100 | 30.07.26 09:43 | BUY | 27811.07 | 27421.06 | 28981.07 | 28107.22 | Zeit | +293,4 | +0,75R | |
| 3949 | NAS100 | 29.07.26 09:30 | SELL | 27719.97 | 27955.77 | 27012.57 | 27200.16 | Zeit | +517,0 | +2,19R | |
| 3948 | NAS100 | 28.07.26 09:32 | SELL | 27720.53 | 28058.71 | 26705.96 | 27763.89 | Zeit | -46,1 | -0,14R | |
| 3947 | NAS100 | 27.07.26 09:32 | SELL | 28398.85 | 28607.55 | 27772.73 | 28039.29 | Zeit | +356,7 | +1,71R | |
| 3946 | NAS100 | 24.07.26 09:33 | BUY | 28429.82 | 28206.23 | 29100.57 | 28206.23 | SL | -226,4 | -1,01R | |
| 3945 | NAS100 | 23.07.26 09:30 | SELL | 28523.79 | 28651.44 | 28140.86 | 28651.44 | SL | -130,5 | -1,02R | |
| 3944 | NAS100 | 22.07.26 09:30 | BUY | 28947.97 | 28801.09 | 29388.62 | 28997.28 | Zeit | +46,4 | +0,32R | |
| 3943 | NAS100 | 21.07.26 09:31 | SELL | 29009.01 | 29219.00 | 28379.05 | 29137.10 | Zeit | -131,0 | -0,62R | |
| 3942 | NAS100 | 20.07.26 09:33 | BUY | 28931.82 | 28611.23 | 29893.60 | 28611.23 | SL | -323,5 | -1,01R | |
| 3941 | NAS100 | 17.07.26 09:30 | BUY | 28464.90 | 28239.29 | 29141.72 | 28239.29 | SL | -228,4 | -1,01R | |
| 3940 | NAS100 | 16.07.26 09:30 | BUY | 29327.00 | 29036.45 | 30198.65 | 29036.45 | SL | -293,5 | -1,01R | |
| 3939 | NAS100 | 15.07.26 09:31 | SELL | 29722.38 | 29885.42 | 29233.27 | 29233.27 | TP | +486,1 | +2,98R | |
| 3938 | NAS100 | 14.07.26 09:30 | SELL | 29570.94 | 29750.10 | 29033.46 | 29585.75 | Zeit | -17,8 | -0,10R | |
| 3937 | NAS100 | 13.07.26 09:30 | SELL | 29458.71 | 29655.74 | 28867.63 | 29260.74 | Zeit | +195,0 | +0,99R | |
| 3936 | NAS100 | 10.07.26 09:30 | BUY | 29661.95 | 29474.70 | 30223.70 | 29474.70 | SL | -190,2 | -1,02R | |
| 3935 | NAS100 | 09.07.26 09:30 | SELL | 29477.55 | 29713.73 | 28769.02 | 29713.73 | SL | -239,1 | -1,01R | |
| 3934 | NAS100 | 08.07.26 09:30 | BUY | 29019.25 | 28782.65 | 29729.03 | 29234.59 | Zeit | +212,4 | +0,90R | |
| 3933 | NAS100 | 07.07.26 09:30 | BUY | 29385.68 | 29233.10 | 29843.43 | 29233.10 | SL | -155,5 | -1,02R | |
| 3932 | NAS100 | 06.07.26 09:30 | BUY | 29598.09 | 29563.02 | 29703.29 | 29563.02 | SL | -38,0 | -1,08R | |
| 3931 | NAS100 | 02.07.26 09:30 | SELL | 29790.59 | 29943.06 | 29333.19 | 29943.06 | SL | -155,4 | -1,02R | |
| 3930 | NAS100 | 01.07.26 09:30 | SELL | 29904.28 | 30191.15 | 29043.67 | 29819.90 | Zeit | +81,4 | +0,28R | |
| 3929 | NAS100 | 30.06.26 09:31 | BUY | 29842.93 | 29442.50 | 31044.22 | 30247.97 | Zeit | +402,1 | +1,00R | |
| 3928 | NAS100 | 29.06.26 09:30 | SELL | 29303.75 | 29567.95 | 28511.18 | 29567.95 | SL | -267,1 | -1,01R | |
| 3927 | NAS100 | 26.06.26 09:33 | SELL | 28973.39 | 29425.07 | 27618.36 | 29085.85 | Zeit | -115,4 | -0,26R | |
| 3926 | NAS100 | 25.06.26 09:31 | SELL | 29788.78 | 30107.45 | 28832.75 | 29440.81 | Zeit | +345,0 | +1,08R | |
| 3925 | NAS100 | 24.06.26 09:30 | SELL | 29356.51 | 29592.95 | 28647.22 | 29592.95 | SL | -239,4 | -1,01R | |
| 3924 | NAS100 | 23.06.26 09:30 | SELL | 29361.08 | 29592.10 | 28668.01 | 29592.10 | SL | -234,0 | -1,01R | |
| 3923 | NAS100 | 22.06.26 09:30 | BUY | 30520.70 | 30485.32 | 30626.83 | 30485.32 | SL | -38,4 | -1,09R | |
| 3922 | NAS100 | 19.06.26 09:56 | BUY | 30374.27 | 30179.51 | 30958.57 | 30336.89 | Zeit | -40,4 | -0,21R | |
| 3921 | NAS100 | 18.06.26 09:34 | SELL | 30213.16 | 30519.14 | 29295.22 | 30383.45 | Zeit | -173,3 | -0,57R | |
| 3920 | NAS100 | 17.06.26 09:31 | SELL | 30133.40 | 30432.97 | 29234.68 | 29673.41 | Zeit | +457,0 | +1,52R | |
| 3919 | NAS100 | 16.06.26 09:30 | SELL | 30459.80 | 30610.98 | 30006.29 | 30006.29 | TP | +450,5 | +2,98R | |
| 3918 | NAS100 | 15.06.26 09:32 | BUY | 30357.04 | 30091.94 | 31152.34 | 30540.45 | Zeit | +180,4 | +0,68R | |
| 3917 | NAS100 | 12.06.26 09:30 | SELL | 29370.59 | 29851.36 | 27928.25 | 29625.14 | Zeit | -257,5 | -0,54R | |
| 3916 | NAS100 | 11.06.26 09:34 | SELL | 28643.98 | 29022.40 | 27508.71 | 29022.40 | SL | -381,3 | -1,01R | |
| 3915 | NAS100 | 10.06.26 09:38 | BUY | 28971.21 | 28187.38 | 31322.71 | 28490.55 | Zeit | -483,5 | -0,62R | |
| 3914 | NAS100 | 09.06.26 09:30 | SELL | 29657.73 | 29862.00 | 29044.94 | 29044.94 | TP | +609,8 | +2,98R | |
| 3913 | NAS100 | 08.06.26 09:35 | SELL | 29372.27 | 29930.00 | 27699.06 | 29408.69 | Zeit | -39,4 | -0,07R | |
| 3912 | NAS100 | 05.06.26 09:31 | BUY | 30024.64 | 29800.40 | 30697.39 | 29800.40 | SL | -227,2 | -1,01R | |
| 3911 | NAS100 | 04.06.26 09:30 | SELL | 30181.64 | 30336.94 | 29715.71 | 30336.94 | SL | -158,3 | -1,02R | |
| 3910 | NAS100 | 03.06.26 09:31 | BUY | 30738.03 | 30589.25 | 31184.36 | 30589.25 | SL | -151,8 | -1,02R | |
| 3909 | NAS100 | 02.06.26 09:30 | SELL | 30462.22 | 30663.67 | 29857.89 | 30663.67 | SL | -204,5 | -1,01R | |
| 3908 | NAS100 | 01.06.26 09:30 | SELL | 30256.45 | 30386.66 | 29865.81 | 30386.66 | SL | -133,2 | -1,02R | |
| 3907 | NAS100 | 29.05.26 09:32 | BUY | 30350.80 | 30143.59 | 30972.44 | 30328.84 | Zeit | -25,0 | -0,12R | |
| 3906 | NAS100 | 28.05.26 09:30 | BUY | 30014.56 | 29860.64 | 30476.35 | 29860.64 | SL | -156,9 | -1,02R | |
| 3905 | NAS100 | 27.05.26 09:30 | SELL | 30086.20 | 30230.98 | 29651.84 | 29971.31 | Zeit | +111,9 | +0,77R | |
| 3904 | NAS100 | 26.05.26 09:30 | BUY | 29838.35 | 29796.63 | 29963.51 | 29796.63 | SL | -44,7 | -1,07R | |
| 3903 | NAS100 | 25.05.26 09:37 | BUY | 29889.85 | 29762.85 | 30270.86 | 29879.66 | Zeit | -13,2 | -0,10R | |
| 3902 | NAS100 | 22.05.26 09:31 | BUY | 29545.29 | 29333.34 | 30181.17 | 29474.30 | Zeit | -73,9 | -0,35R | |
| 3901 | NAS100 | 21.05.26 09:31 | SELL | 29084.72 | 29279.62 | 28499.99 | 29279.62 | SL | -197,8 | -1,01R | |
| 3900 | NAS100 | 20.05.26 09:31 | BUY | 29026.61 | 28794.33 | 29723.47 | 29302.69 | Zeit | +273,2 | +1,18R | |
| 3899 | NAS100 | 19.05.26 09:30 | BUY | 28807.31 | 28536.02 | 29621.21 | 28826.23 | Zeit | +16,0 | +0,06R | |
| 3898 | NAS100 | 18.05.26 09:32 | SELL | 29203.62 | 29403.09 | 28605.19 | 28997.78 | Zeit | +202,9 | +1,02R | |
| 3897 | NAS100 | 15.05.26 09:30 | SELL | 29148.85 | 29311.21 | 28661.78 | 29311.21 | SL | -165,3 | -1,02R | |
| 3896 | NAS100 | 14.05.26 09:32 | BUY | 29417.94 | 29175.97 | 30143.83 | 29581.75 | Zeit | +160,9 | +0,67R | |
| 3895 | NAS100 | 13.05.26 09:31 | SELL | 29128.24 | 29405.40 | 28296.76 | 29405.40 | SL | -280,1 | -1,01R | |
| 3894 | NAS100 | 12.05.26 09:30 | SELL | 29081.43 | 29195.69 | 28738.63 | 28738.63 | TP | +339,9 | +2,98R | |
| 3893 | NAS100 | 11.05.26 09:31 | BUY | 29243.43 | 29005.59 | 29956.95 | 29317.18 | Zeit | +70,8 | +0,30R | |
| 3892 | NAS100 | 08.05.26 09:31 | BUY | 28804.64 | 28608.62 | 29392.72 | 29223.90 | Zeit | +416,4 | +2,12R | |
| 3891 | NAS100 | 07.05.26 09:45 | SELL | 28595.33 | 28789.01 | 28014.31 | 28789.01 | SL | -196,5 | -1,01R | |
| 3890 | NAS100 | 06.05.26 09:30 | SELL | 28249.12 | 28354.27 | 27933.70 | 28354.27 | SL | -108,0 | -1,03R | |
| 3889 | NAS100 | 05.05.26 09:30 | BUY | 27902.60 | 27747.28 | 28368.53 | 28013.76 | Zeit | +108,4 | +0,70R | |
| 3888 | NAS100 | 04.05.26 09:31 | SELL | 27704.64 | 27854.24 | 27255.86 | 27661.37 | Zeit | +40,5 | +0,27R | |
| 3887 | NAS100 | 01.05.26 09:31 | BUY | 27550.30 | 27323.63 | 28230.33 | 27713.89 | Zeit | +160,8 | +0,71R | |
| 3886 | NAS100 | 30.04.26 09:30 | SELL | 27340.18 | 27446.22 | 27022.08 | 27446.22 | SL | -108,8 | -1,03R | |
| 3885 | NAS100 | 29.04.26 09:30 | SELL | 27048.53 | 27168.53 | 26688.53 | 27168.53 | SL | -122,7 | -1,02R | |
| 3884 | NAS100 | 28.04.26 09:32 | BUY | 26983.57 | 26907.79 | 27210.91 | 26907.79 | SL | -78,5 | -1,04R | |
| 3883 | NAS100 | 27.04.26 09:30 | SELL | 27241.31 | 27403.99 | 26753.28 | 27307.19 | Zeit | -68,6 | -0,42R | |
| 3882 | NAS100 | 24.04.26 09:42 | BUY | 27115.38 | 26879.96 | 27821.62 | 27295.43 | Zeit | +177,3 | +0,75R | |
| 3881 | NAS100 | 23.04.26 09:30 | SELL | 26839.56 | 26978.51 | 26422.70 | 26978.51 | SL | -141,6 | -1,02R | |
| 3880 | NAS100 | 22.04.26 09:32 | SELL | 26696.62 | 26862.09 | 26200.23 | 26862.09 | SL | -168,1 | -1,02R | |
| 3879 | NAS100 | 21.04.26 09:30 | SELL | 26628.11 | 26756.38 | 26243.28 | 26488.54 | Zeit | +136,9 | +1,07R | |
| 3878 | NAS100 | 20.04.26 09:30 | BUY | 26663.06 | 26541.38 | 27028.10 | 26541.38 | SL | -124,3 | -1,02R | |
| 3877 | NAS100 | 17.04.26 09:32 | SELL | 26510.49 | 26653.15 | 26082.51 | 26653.15 | SL | -145,3 | -1,02R | |
| 3876 | NAS100 | 16.04.26 09:30 | SELL | 26239.44 | 26434.81 | 25653.32 | 26323.12 | Zeit | -86,3 | -0,44R | |
| 3875 | NAS100 | 15.04.26 09:40 | BUY | 25894.18 | 25723.68 | 26405.67 | 26199.00 | Zeit | +302,2 | +1,77R | |
| 3874 | NAS100 | 14.04.26 09:30 | BUY | 25534.15 | 25338.79 | 26120.20 | 25835.49 | Zeit | +298,8 | +1,53R | |
| 3873 | NAS100 | 13.04.26 09:30 | BUY | 25069.20 | 24983.97 | 25324.88 | 25324.88 | TP | +253,2 | +2,97R | |
| 3872 | NAS100 | 10.04.26 09:31 | BUY | 25180.75 | 25026.07 | 25644.80 | 25116.85 | Zeit | -66,4 | -0,43R | |
| 3871 | NAS100 | 09.04.26 09:32 | SELL | 24877.56 | 25034.69 | 24406.17 | 25034.69 | SL | -159,6 | -1,02R | |
| 3870 | NAS100 | 08.04.26 09:31 | SELL | 24984.84 | 25202.31 | 24332.43 | 24906.35 | Zeit | +76,0 | +0,35R | |
| 3869 | NAS100 | 07.04.26 09:30 | BUY | 24097.58 | 23977.23 | 24458.65 | 23977.23 | SL | -122,8 | -1,02R | |
| 3868 | NAS100 | 06.04.26 09:30 | BUY | 24145.90 | 23872.50 | 24966.09 | 24190.69 | Zeit | +42,4 | +0,15R | |
| 3867 | NAS100 | 02.04.26 09:30 | BUY | 23616.81 | 23468.00 | 24063.21 | 24045.90 | Zeit | +426,7 | +2,87R | |
| 3866 | NAS100 | 01.04.26 09:34 | BUY | 23967.97 | 23670.93 | 24859.08 | 24017.81 | Zeit | +47,4 | +0,16R | |
| 3865 | NAS100 | 31.03.26 09:31 | BUY | 23250.93 | 22993.41 | 24023.48 | 23731.05 | Zeit | +477,8 | +1,85R | |
| 3864 | NAS100 | 30.03.26 09:34 | SELL | 23293.92 | 23461.32 | 22791.72 | 22952.20 | Zeit | +339,4 | +2,03R | |
| 3863 | NAS100 | 27.03.26 09:50 | BUY | 23331.50 | 23103.83 | 24014.51 | 23103.83 | SL | -230,0 | -1,01R | |
| 3862 | NAS100 | 26.03.26 09:31 | BUY | 23987.23 | 23870.88 | 24336.28 | 23870.88 | SL | -118,7 | -1,02R | |
| 3861 | NAS100 | 25.03.26 09:35 | BUY | 24290.75 | 24179.68 | 24623.94 | 24179.68 | SL | -113,5 | -1,02R | |
| 3860 | NAS100 | 24.03.26 09:42 | BUY | 24031.25 | 23844.09 | 24592.72 | 24025.08 | Zeit | -8,6 | -0,05R | |
| 3859 | NAS100 | 23.03.26 09:45 | SELL | 24374.14 | 24566.80 | 23796.17 | 24193.88 | Zeit | +177,8 | +0,92R | |
| 3858 | NAS100 | 20.03.26 09:32 | BUY | 24087.68 | 23933.67 | 24549.74 | 23933.67 | SL | -156,4 | -1,02R | |
| 3857 | NAS100 | 19.03.26 09:31 | BUY | 24239.05 | 24083.28 | 24706.36 | 24388.88 | Zeit | +147,4 | +0,95R | |
| 3856 | NAS100 | 18.03.26 09:30 | BUY | 24609.94 | 24539.21 | 24822.10 | 24539.21 | SL | -73,2 | -1,03R | |
| 3855 | NAS100 | 17.03.26 09:31 | SELL | 24811.01 | 24908.52 | 24518.49 | 24795.30 | Zeit | +13,2 | +0,14R | |
| 3854 | NAS100 | 16.03.26 09:33 | SELL | 24663.28 | 24851.77 | 24097.79 | 24663.01 | Zeit | -2,2 | -0,01R | |
| 3853 | NAS100 | 13.03.26 09:30 | BUY | 24676.87 | 24580.19 | 24966.90 | 24580.19 | SL | -99,1 | -1,03R | |
| 3852 | NAS100 | 12.03.26 09:33 | SELL | 24577.31 | 24684.50 | 24255.76 | 24684.50 | SL | -109,6 | -1,02R | |
| 3851 | NAS100 | 11.03.26 09:32 | SELL | 24975.80 | 25113.50 | 24562.70 | 24939.74 | Zeit | +33,6 | +0,24R | |
| 3850 | NAS100 | 10.03.26 09:37 | BUY | 25041.04 | 24715.76 | 26016.89 | 25005.54 | Zeit | -38,0 | -0,12R | |
| 3849 | NAS100 | 09.03.26 09:30 | BUY | 24405.76 | 24248.14 | 24878.62 | 24878.62 | TP | +470,4 | +2,98R | |
| 3848 | NAS100 | 06.03.26 09:33 | BUY | 24698.36 | 24483.15 | 25343.99 | 24639.53 | Zeit | -61,3 | -0,28R | |
| 3847 | NAS100 | 05.03.26 09:30 | BUY | 24992.65 | 24798.26 | 25575.84 | 24798.26 | SL | -196,9 | -1,01R | |
| 3846 | NAS100 | 04.03.26 09:30 | BUY | 24867.28 | 24619.49 | 25610.64 | 25087.12 | Zeit | +217,4 | +0,88R | |
| 3845 | NAS100 | 03.03.26 09:30 | BUY | 24537.84 | 24293.10 | 25272.07 | 24718.84 | Zeit | +178,6 | +0,73R | |
| 3844 | NAS100 | 02.03.26 09:30 | BUY | 24632.48 | 24506.38 | 25010.79 | 25010.79 | TP | +375,8 | +2,98R | |
| 3843 | NAS100 | 27.02.26 09:30 | BUY | 24818.69 | 24580.76 | 25532.46 | 24953.84 | Zeit | +132,7 | +0,56R | |
| 3842 | NAS100 | 26.02.26 09:30 | SELL | 25270.43 | 25390.34 | 24910.69 | 24910.69 | TP | +357,2 | +2,98R | |
| 3841 | NAS100 | 25.02.26 09:30 | BUY | 25147.29 | 24958.31 | 25714.23 | 25334.05 | Zeit | +184,3 | +0,97R | |
| 3840 | NAS100 | 24.02.26 09:31 | SELL | 24717.83 | 24902.27 | 24164.52 | 24902.27 | SL | -186,9 | -1,01R | |
| 3839 | NAS100 | 23.02.26 09:30 | BUY | 24970.07 | 24740.65 | 25658.35 | 24740.65 | SL | -231,9 | -1,01R | |
| 3838 | NAS100 | 20.02.26 09:30 | BUY | 24676.74 | 24573.26 | 24987.20 | 24987.20 | TP | +308,0 | +2,98R | |
| 3837 | NAS100 | 19.02.26 09:31 | BUY | 24804.02 | 24617.80 | 25362.67 | 24796.50 | Zeit | -10,0 | -0,05R | |
| 3836 | NAS100 | 18.02.26 09:30 | SELL | 24701.70 | 24920.77 | 24044.49 | 24920.77 | SL | -221,5 | -1,01R | |
| 3835 | NAS100 | 17.02.26 09:30 | BUY | 24600.92 | 24537.91 | 24789.93 | 24537.91 | SL | -65,5 | -1,04R | |
| 3834 | NAS100 | 16.02.26 09:42 | SELL | 24652.67 | 24860.94 | 24027.88 | 24666.25 | Zeit | -16,0 | -0,08R | |
| 3833 | NAS100 | 13.02.26 09:39 | SELL | 24602.92 | 24937.44 | 23599.37 | 24733.72 | Zeit | -133,3 | -0,40R | |
| 3832 | NAS100 | 12.02.26 09:38 | BUY | 25306.76 | 25103.80 | 25915.64 | 25103.80 | SL | -205,5 | -1,01R | |
| 3831 | NAS100 | 11.02.26 09:30 | BUY | 25361.11 | 25237.54 | 25731.82 | 25237.54 | SL | -126,1 | -1,02R | |
| 3830 | NAS100 | 10.02.26 09:36 | SELL | 25243.31 | 25478.16 | 24538.79 | 25134.33 | Zeit | +106,5 | +0,45R | |
| 3829 | NAS100 | 09.02.26 09:30 | SELL | 24918.54 | 25179.69 | 24135.08 | 25179.69 | SL | -263,7 | -1,01R | |
| 3828 | NAS100 | 06.02.26 09:32 | BUY | 24709.57 | 24504.45 | 25324.94 | 25056.78 | Zeit | +344,7 | +1,68R | |
| 3827 | NAS100 | 05.02.26 09:30 | SELL | 24610.94 | 24911.67 | 23708.76 | 24540.24 | Zeit | +68,2 | +0,23R | |
| 3826 | NAS100 | 04.02.26 09:30 | SELL | 25205.64 | 25570.42 | 24111.30 | 24896.76 | Zeit | +306,4 | +0,84R | |
| 3825 | NAS100 | 03.02.26 09:31 | SELL | 25782.81 | 25984.92 | 25176.47 | 25176.47 | TP | +603,8 | +2,99R | |
| 3824 | NAS100 | 02.02.26 09:30 | BUY | 25465.46 | 25282.62 | 26013.98 | 25741.13 | Zeit | +273,1 | +1,49R | |
| 3823 | NAS100 | 30.01.26 09:30 | BUY | 25778.90 | 25460.87 | 26732.99 | 25460.87 | SL | -320,6 | -1,01R | |
| 3822 | NAS100 | 29.01.26 09:30 | BUY | 26024.46 | 25925.91 | 26320.08 | 25925.91 | SL | -101,1 | -1,03R | |
| 3821 | NAS100 | 28.01.26 09:30 | SELL | 26104.17 | 26200.89 | 25814.00 | 26018.60 | Zeit | +83,0 | +0,86R | |
| 3820 | NAS100 | 27.01.26 09:30 | SELL | 25831.71 | 25942.95 | 25497.98 | 25942.95 | SL | -113,8 | -1,02R | |
| 3819 | NAS100 | 26.01.26 09:30 | SELL | 25589.96 | 25730.64 | 25167.95 | 25730.64 | SL | -143,2 | -1,02R | |
| 3818 | NAS100 | 23.01.26 09:30 | BUY | 25491.19 | 25395.12 | 25779.39 | 25601.12 | Zeit | +107,4 | +1,12R | |
| 3817 | NAS100 | 22.01.26 09:30 | SELL | 25535.37 | 25794.10 | 24759.18 | 25519.58 | Zeit | +13,2 | +0,05R | |
| 3816 | NAS100 | 21.01.26 09:31 | SELL | 25020.15 | 25185.25 | 24524.84 | 25185.25 | SL | -167,6 | -1,01R | |
| 3815 | NAS100 | 20.01.26 09:30 | BUY | 25110.19 | 25020.10 | 25380.49 | 25020.10 | SL | -92,6 | -1,03R | |
| 3814 | NAS100 | 19.01.26 09:33 | SELL | 25105.93 | 25255.21 | 24658.08 | 25255.21 | SL | -151,8 | -1,02R | |
| 3813 | NAS100 | 16.01.26 09:33 | SELL | 25686.56 | 25823.96 | 25274.38 | 25527.80 | Zeit | +156,2 | +1,14R | |
| 3812 | NAS100 | 15.01.26 09:34 | SELL | 25726.42 | 25908.33 | 25180.72 | 25552.79 | Zeit | +171,1 | +0,94R | |
| 3811 | NAS100 | 14.01.26 09:30 | SELL | 25553.09 | 25671.44 | 25198.03 | 25472.43 | Zeit | +78,1 | +0,66R | |
| 3810 | NAS100 | 13.01.26 09:34 | BUY | 25811.86 | 25674.42 | 26224.16 | 25674.42 | SL | -140,0 | -1,02R | |
| 3809 | NAS100 | 12.01.26 09:30 | BUY | 25614.77 | 25430.18 | 26168.52 | 25782.93 | Zeit | +165,6 | +0,90R | |
| 3808 | NAS100 | 09.01.26 09:30 | SELL | 25518.50 | 25633.65 | 25173.06 | 25633.65 | SL | -117,7 | -1,02R | |
| 3807 | NAS100 | 08.01.26 09:30 | SELL | 25586.11 | 25698.08 | 25250.20 | 25504.23 | Zeit | +79,3 | +0,71R | |
| 3806 | NAS100 | 07.01.26 09:33 | BUY | 25630.19 | 25517.67 | 25967.73 | 25653.56 | Zeit | +20,8 | +0,18R | |
| 3805 | NAS100 | 06.01.26 09:30 | BUY | 25466.60 | 25385.08 | 25711.17 | 25628.21 | Zeit | +159,1 | +1,95R | |
| 3804 | NAS100 | 05.01.26 09:32 | SELL | 25408.82 | 25669.33 | 24627.29 | 25401.80 | Zeit | +4,5 | +0,02R | |
| 3803 | NAS100 | 02.01.26 09:30 | BUY | 25509.45 | 25387.37 | 25875.67 | 25387.37 | SL | -124,6 | -1,02R | |
| 3802 | NAS100 | 31.12.25 09:30 | SELL | 25458.00 | 25519.52 | 25273.43 | 25273.43 | TP | +182,0 | +2,96R | |
| 3801 | NAS100 | 30.12.25 09:30 | BUY | 25496.32 | 25413.76 | 25743.97 | 25465.53 | Zeit | -33,3 | -0,40R | |
| 3800 | NAS100 | 29.12.25 09:30 | SELL | 25481.57 | 25531.60 | 25331.47 | 25531.60 | SL | -52,6 | -1,05R | |
| 3799 | NAS100 | 26.12.25 09:30 | SELL | 25669.04 | 25722.38 | 25509.00 | 25647.18 | Zeit | +19,3 | +0,36R | |
| 3798 | NAS100 | 24.12.25 09:30 | BUY | 25588.64 | 25493.94 | 25872.75 | 25642.84 | Zeit | +51,6 | +0,55R | |
| 3797 | NAS100 | 23.12.25 09:30 | BUY | 25429.27 | 25347.26 | 25675.30 | 25578.06 | Zeit | +146,3 | +1,78R | |
| 3796 | NAS100 | 22.12.25 09:30 | SELL | 25519.65 | 25637.72 | 25165.42 | 25453.08 | Zeit | +64,0 | +0,54R | |
| 3795 | NAS100 | 19.12.25 09:30 | BUY | 25156.79 | 25037.65 | 25514.21 | 25342.15 | Zeit | +182,9 | +1,53R | |
| 3794 | NAS100 | 18.12.25 09:38 | SELL | 24987.09 | 25260.52 | 24166.83 | 25008.89 | Zeit | -24,3 | -0,09R | |
| 3793 | NAS100 | 17.12.25 09:35 | SELL | 25143.85 | 25284.62 | 24721.54 | 24721.54 | TP | +419,8 | +2,98R | |
| 3792 | NAS100 | 16.12.25 09:30 | BUY | 25003.22 | 24813.85 | 25571.36 | 25120.04 | Zeit | +114,3 | +0,60R | |
| 3791 | NAS100 | 15.12.25 09:33 | SELL | 25343.94 | 25593.06 | 24596.58 | 25062.52 | Zeit | +278,9 | +1,12R | |
| 3790 | NAS100 | 12.12.25 09:36 | BUY | 25568.98 | 25402.19 | 26069.36 | 25402.19 | SL | -169,3 | -1,01R | |
| 3789 | NAS100 | 11.12.25 09:30 | SELL | 25584.26 | 25751.05 | 25083.92 | 25687.99 | Zeit | -106,3 | -0,64R | |
| 3788 | NAS100 | 10.12.25 09:30 | BUY | 25631.44 | 25544.94 | 25890.95 | 25544.94 | SL | -89,1 | -1,03R | |
| 3787 | NAS100 | 09.12.25 09:31 | SELL | 25555.10 | 25702.16 | 25113.93 | 25668.68 | Zeit | -116,1 | -0,79R | |
| 3786 | NAS100 | 08.12.25 09:30 | BUY | 25776.16 | 25669.75 | 26095.40 | 25669.75 | SL | -109,0 | -1,02R | |
| 3785 | NAS100 | 05.12.25 09:30 | BUY | 25661.34 | 25550.31 | 25994.43 | 25687.01 | Zeit | +23,1 | +0,21R | |
| 3784 | NAS100 | 04.12.25 09:30 | SELL | 25640.55 | 25768.09 | 25257.93 | 25580.81 | Zeit | +57,2 | +0,45R | |
| 3783 | NAS100 | 03.12.25 09:30 | SELL | 25422.41 | 25549.48 | 25041.20 | 25549.48 | SL | -129,6 | -1,02R | |
| 3782 | NAS100 | 02.12.25 09:33 | BUY | 25471.93 | 25328.91 | 25900.99 | 25551.30 | Zeit | +76,8 | +0,54R | |
| 3781 | NAS100 | 01.12.25 09:30 | BUY | 25220.51 | 25136.45 | 25472.67 | 25350.08 | Zeit | +127,1 | +1,51R | |
| 3780 | NAS100 | 28.11.25 09:30 | BUY | 25307.35 | 25291.56 | 25354.73 | 25354.73 | TP | +44,9 | +2,84R | |
| 3779 | NAS100 | 26.11.25 09:51 | BUY | 25213.54 | 24947.30 | 26012.27 | 25233.29 | Zeit | +17,2 | +0,07R | |
| 3778 | NAS100 | 25.11.25 09:40 | SELL | 24740.63 | 24975.75 | 24035.28 | 24975.75 | SL | -237,6 | -1,01R | |
| 3777 | NAS100 | 24.11.25 09:31 | BUY | 24519.15 | 24186.00 | 25518.62 | 24864.79 | Zeit | +343,2 | +1,03R | |
| 3776 | NAS100 | 21.11.25 10:03 | SELL | 24009.30 | 24609.82 | 22207.74 | 24241.53 | Zeit | -234,6 | -0,39R | |
| 3775 | NAS100 | 20.11.25 09:30 | SELL | 25076.65 | 25314.34 | 24363.57 | 24363.57 | TP | +710,6 | +2,99R | |
| 3774 | NAS100 | 19.11.25 09:35 | BUY | 24574.29 | 24349.42 | 25248.88 | 24642.52 | Zeit | +65,8 | +0,29R | |
| 3773 | NAS100 | 18.11.25 09:31 | SELL | 24580.79 | 24840.63 | 23801.28 | 24496.83 | Zeit | +81,5 | +0,31R | |
| 3772 | NAS100 | 17.11.25 09:32 | BUY | 24977.05 | 24642.56 | 25980.49 | 24799.75 | Zeit | -179,8 | -0,54R | |
| 3771 | NAS100 | 14.11.25 09:32 | SELL | 24579.07 | 24826.07 | 23838.05 | 24826.07 | SL | -249,5 | -1,01R | |
| 3770 | NAS100 | 13.11.25 09:31 | SELL | 25347.54 | 25491.62 | 24915.30 | 24915.30 | TP | +429,7 | +2,98R | |
| 3769 | NAS100 | 12.11.25 09:30 | SELL | 25653.14 | 25758.87 | 25335.96 | 25523.09 | Zeit | +127,5 | +1,21R | |
| 3768 | NAS100 | 11.11.25 09:37 | BUY | 25532.01 | 25380.23 | 25987.33 | 25380.23 | SL | -154,3 | -1,02R | |
| 3767 | NAS100 | 10.11.25 09:33 | BUY | 25479.01 | 25247.07 | 26174.83 | 25607.78 | Zeit | +126,2 | +0,54R | |
| 3766 | NAS100 | 07.11.25 09:30 | SELL | 24951.44 | 25192.44 | 24228.47 | 25057.27 | Zeit | -108,3 | -0,45R | |
| 3765 | NAS100 | 06.11.25 09:32 | SELL | 25513.27 | 25707.07 | 24931.87 | 25140.40 | Zeit | +370,3 | +1,91R | |
| 3764 | NAS100 | 05.11.25 09:34 | SELL | 25384.00 | 25556.78 | 24865.67 | 25556.78 | SL | -175,3 | -1,01R | |
| 3763 | NAS100 | 04.11.25 09:30 | SELL | 25587.37 | 25711.44 | 25215.17 | 25711.44 | SL | -126,6 | -1,02R | |
| 3762 | NAS100 | 03.11.25 09:33 | BUY | 26128.25 | 25982.26 | 26566.24 | 25982.26 | SL | -148,6 | -1,02R | |
| 3761 | NAS100 | 31.10.25 09:33 | BUY | 25994.94 | 25873.19 | 26360.16 | 25873.19 | SL | -124,3 | -1,02R | |
| 3760 | NAS100 | 30.10.25 09:30 | BUY | 25911.00 | 25748.64 | 26398.08 | 25748.64 | SL | -164,9 | -1,02R | |
| 3759 | NAS100 | 29.10.25 09:44 | SELL | 26133.16 | 26244.35 | 25799.59 | 26084.96 | Zeit | +45,6 | +0,41R | |
| 3758 | NAS100 | 28.10.25 09:31 | SELL | 25889.49 | 25954.34 | 25694.92 | 25954.34 | SL | -67,4 | -1,04R | |
| 3757 | NAS100 | 27.10.25 09:36 | BUY | 25734.97 | 25666.77 | 25939.56 | 25827.80 | Zeit | +90,3 | +1,32R | |
| 3756 | NAS100 | 24.10.25 09:30 | SELL | 25290.39 | 25430.29 | 24870.68 | 25359.01 | Zeit | -71,2 | -0,51R | |
| 3755 | NAS100 | 23.10.25 09:37 | BUY | 24910.52 | 24669.88 | 25632.42 | 25094.15 | Zeit | +181,1 | +0,75R | |
| 3754 | NAS100 | 22.10.25 09:30 | SELL | 25090.46 | 25162.17 | 24875.36 | 24875.36 | TP | +212,6 | +2,96R | |
| 3753 | NAS100 | 21.10.25 09:31 | SELL | 25113.06 | 25229.81 | 24762.81 | 25127.41 | Zeit | -16,9 | -0,14R | |
| 3752 | NAS100 | 20.10.25 09:30 | BUY | 24991.28 | 24803.02 | 25556.08 | 25132.85 | Zeit | +139,1 | +0,74R | |
| 3751 | NAS100 | 17.10.25 09:34 | BUY | 24624.59 | 24359.14 | 25420.94 | 24818.20 | Zeit | +191,2 | +0,72R | |
| 3750 | NAS100 | 16.10.25 09:31 | BUY | 24917.77 | 24693.01 | 25592.04 | 24693.01 | SL | -227,2 | -1,01R | |
| 3749 | NAS100 | 15.10.25 09:34 | SELL | 24775.05 | 25036.70 | 23990.11 | 24750.25 | Zeit | +22,3 | +0,09R | |
| 3748 | NAS100 | 14.10.25 09:30 | SELL | 24437.58 | 24553.22 | 24090.67 | 24553.22 | SL | -118,1 | -1,02R | |
| 3747 | NAS100 | 13.10.25 09:36 | SELL | 24549.37 | 25045.31 | 23061.52 | 24740.28 | Zeit | -193,4 | -0,39R | |
| 3746 | NAS100 | 10.10.25 09:30 | SELL | 25106.74 | 25191.20 | 24853.35 | 25191.20 | SL | -87,0 | -1,03R | |
| 3745 | NAS100 | 09.10.25 09:33 | SELL | 25101.69 | 25233.94 | 24704.96 | 25099.41 | Zeit | -0,2 | -0,00R | |
| 3744 | NAS100 | 08.10.25 09:31 | BUY | 24908.43 | 24768.99 | 25326.77 | 25127.80 | Zeit | +216,9 | +1,55R | |
| 3743 | NAS100 | 07.10.25 09:30 | SELL | 25015.48 | 25085.73 | 24804.74 | 24804.74 | TP | +208,2 | +2,96R | |
| 3742 | NAS100 | 06.10.25 09:30 | SELL | 24984.91 | 25107.42 | 24617.38 | 24973.94 | Zeit | +8,5 | +0,07R | |
| 3741 | NAS100 | 03.10.25 09:31 | BUY | 24941.60 | 24855.34 | 25200.40 | 24855.34 | SL | -88,8 | -1,03R | |
| 3740 | NAS100 | 02.10.25 09:32 | SELL | 24919.47 | 25074.76 | 24453.61 | 24894.52 | Zeit | +22,5 | +0,14R | |
| 3739 | NAS100 | 01.10.25 09:30 | SELL | 24524.43 | 24618.98 | 24240.76 | 24618.98 | SL | -97,0 | -1,03R | |
| 3738 | NAS100 | 30.09.25 09:31 | SELL | 24577.36 | 24673.44 | 24289.14 | 24673.44 | SL | -98,5 | -1,03R | |
| 3737 | NAS100 | 29.09.25 09:31 | BUY | 24647.47 | 24541.03 | 24966.80 | 24610.45 | Zeit | -39,5 | -0,37R | |
| 3736 | NAS100 | 26.09.25 09:30 | SELL | 24397.03 | 24534.42 | 23984.88 | 24497.36 | Zeit | -102,8 | -0,75R | |
| 3735 | NAS100 | 25.09.25 09:30 | SELL | 24313.39 | 24448.08 | 23909.31 | 24448.08 | SL | -137,1 | -1,02R | |
| 3734 | NAS100 | 24.09.25 09:32 | SELL | 24620.51 | 24735.71 | 24274.91 | 24498.41 | Zeit | +119,6 | +1,04R | |
| 3733 | NAS100 | 23.09.25 09:36 | SELL | 24737.46 | 24845.48 | 24413.41 | 24585.99 | Zeit | +149,0 | +1,38R | |
| 3732 | NAS100 | 22.09.25 09:30 | BUY | 24582.23 | 24498.28 | 24834.06 | 24753.97 | Zeit | +169,3 | +2,02R | |
| 3731 | NAS100 | 19.09.25 09:33 | SELL | 24501.21 | 24608.53 | 24179.27 | 24608.53 | SL | -109,8 | -1,02R | |
| 3730 | NAS100 | 18.09.25 09:36 | BUY | 24458.32 | 24307.00 | 24912.29 | 24444.95 | Zeit | -15,8 | -0,10R | |
| 3729 | NAS100 | 17.09.25 09:30 | BUY | 24281.45 | 24232.76 | 24427.51 | 24232.76 | SL | -51,1 | -1,05R | |
| 3728 | NAS100 | 16.09.25 09:33 | SELL | 24317.72 | 24388.36 | 24105.78 | 24272.14 | Zeit | +43,1 | +0,61R | |
| 3727 | NAS100 | 15.09.25 09:30 | BUY | 24175.64 | 24099.00 | 24405.57 | 24293.06 | Zeit | +115,0 | +1,50R | |
| 3726 | NAS100 | 12.09.25 09:30 | BUY | 24034.00 | 23968.70 | 24229.88 | 24087.34 | Zeit | +50,9 | +0,78R | |
| 3725 | NAS100 | 11.09.25 09:36 | SELL | 23930.52 | 24037.99 | 23608.12 | 23983.20 | Zeit | -55,1 | -0,51R | |
| 3724 | NAS100 | 10.09.25 09:30 | SELL | 23953.03 | 24033.49 | 23711.64 | 23845.30 | Zeit | +105,3 | +1,31R | |
| 3723 | NAS100 | 09.09.25 09:30 | BUY | 23817.00 | 23753.70 | 24006.91 | 23753.70 | SL | -65,7 | -1,04R | |
| 3722 | NAS100 | 08.09.25 09:35 | BUY | 23789.55 | 23591.63 | 24383.34 | 23765.66 | Zeit | -26,3 | -0,13R | |
| 3721 | NAS100 | 05.09.25 09:30 | BUY | 23863.56 | 23729.37 | 24266.12 | 23729.37 | SL | -136,6 | -1,02R | |
| 3720 | NAS100 | 04.09.25 09:30 | SELL | 23418.58 | 23520.05 | 23114.15 | 23520.05 | SL | -103,8 | -1,02R | |
| 3719 | NAS100 | 03.09.25 09:31 | SELL | 23354.65 | 23486.17 | 22960.09 | 23408.12 | Zeit | -55,8 | -0,42R | |
| 3718 | NAS100 | 02.09.25 09:30 | SELL | 23048.96 | 23080.77 | 22953.52 | 23080.77 | SL | -34,1 | -1,07R | |
| 3717 | NAS100 | 01.09.25 09:31 | SELL | 23402.59 | 23534.11 | 23008.02 | 23452.28 | Zeit | -52,0 | -0,40R | |
| 3716 | NAS100 | 29.08.25 09:35 | SELL | 23576.32 | 23689.93 | 23235.49 | 23421.86 | Zeit | +152,1 | +1,34R | |
| 3715 | NAS100 | 28.08.25 09:30 | BUY | 23592.30 | 23522.11 | 23802.87 | 23522.11 | SL | -72,5 | -1,03R | |
| 3714 | NAS100 | 27.08.25 09:30 | BUY | 23492.01 | 23407.18 | 23746.49 | 23558.04 | Zeit | +63,7 | +0,75R | |
| 3713 | NAS100 | 26.08.25 09:30 | BUY | 23420.71 | 23334.26 | 23680.04 | 23519.58 | Zeit | +96,5 | +1,12R | |
| 3712 | NAS100 | 25.08.25 09:33 | SELL | 23380.36 | 23600.99 | 22718.48 | 23426.90 | Zeit | -48,9 | -0,22R | |
| 3711 | NAS100 | 22.08.25 09:30 | SELL | 23166.67 | 23279.90 | 22826.99 | 23279.90 | SL | -115,5 | -1,02R | |
| 3710 | NAS100 | 21.08.25 09:31 | SELL | 23141.58 | 23336.89 | 22555.65 | 23140.81 | Zeit | -1,5 | -0,01R | |
| 3709 | NAS100 | 20.08.25 09:30 | SELL | 23310.17 | 23481.53 | 22796.10 | 23248.61 | Zeit | +59,2 | +0,35R | |
| 3708 | NAS100 | 19.08.25 09:30 | SELL | 23666.29 | 23718.78 | 23508.83 | 23508.83 | TP | +155,1 | +2,96R | |
| 3707 | NAS100 | 18.08.25 09:30 | BUY | 23696.89 | 23610.54 | 23955.94 | 23710.69 | Zeit | +11,4 | +0,13R | |
| 3706 | NAS100 | 15.08.25 09:30 | SELL | 23802.72 | 23884.37 | 23557.77 | 23715.49 | Zeit | +84,9 | +1,04R | |
| 3705 | NAS100 | 14.08.25 09:31 | BUY | 23779.58 | 23688.88 | 24051.70 | 23824.37 | Zeit | +42,4 | +0,47R | |
| 3704 | NAS100 | 13.08.25 09:56 | SELL | 23910.41 | 24071.79 | 23426.26 | 23847.47 | Zeit | +60,5 | +0,38R | |
| 3703 | NAS100 | 12.08.25 09:38 | BUY | 23646.47 | 23538.24 | 23971.15 | 23538.24 | SL | -110,6 | -1,02R | |
| 3702 | NAS100 | 11.08.25 09:31 | SELL | 23591.47 | 23685.89 | 23308.22 | 23685.89 | SL | -96,8 | -1,02R | |
| 3701 | NAS100 | 08.08.25 09:31 | BUY | 23474.29 | 23306.34 | 23978.14 | 23609.26 | Zeit | +132,6 | +0,79R | |
| 3700 | NAS100 | 07.08.25 09:34 | BUY | 23518.53 | 23372.72 | 23955.93 | 23372.72 | SL | -148,1 | -1,02R | |
| 3699 | NAS100 | 06.08.25 09:31 | BUY | 23086.71 | 22946.85 | 23506.30 | 23310.45 | Zeit | +221,4 | +1,58R | |
| 3698 | NAS100 | 05.08.25 09:30 | SELL | 23209.53 | 23317.81 | 22884.72 | 23021.15 | Zeit | +186,1 | +1,72R | |
| 3697 | NAS100 | 04.08.25 09:33 | BUY | 23006.07 | 22856.14 | 23455.87 | 23178.15 | Zeit | +169,8 | +1,13R | |
| 3696 | NAS100 | 01.08.25 09:30 | SELL | 22915.88 | 23138.40 | 22248.32 | 22761.88 | Zeit | +151,7 | +0,68R | |
| 3695 | NAS100 | 31.07.25 09:30 | SELL | 23587.73 | 23703.42 | 23240.66 | 23240.66 | TP | +344,7 | +2,98R | |
| 3694 | NAS100 | 30.07.25 09:31 | SELL | 23325.59 | 23441.19 | 22978.77 | 23441.19 | SL | -117,9 | -1,02R | |
| 3693 | NAS100 | 29.07.25 09:30 | BUY | 23464.67 | 23419.87 | 23599.07 | 23419.87 | SL | -47,1 | -1,05R | |
| 3692 | NAS100 | 28.07.25 09:30 | BUY | 23342.28 | 23270.82 | 23556.66 | 23350.11 | Zeit | +5,5 | +0,08R | |
| 3691 | NAS100 | 25.07.25 09:30 | SELL | 23203.84 | 23264.86 | 23020.77 | 23264.86 | SL | -63,3 | -1,04R | |
| 3690 | NAS100 | 24.07.25 09:30 | BUY | 23239.90 | 23152.49 | 23502.15 | 23152.49 | SL | -89,7 | -1,03R | |
| 3689 | NAS100 | 23.07.25 09:30 | SELL | 23084.05 | 23200.96 | 22733.30 | 23171.04 | Zeit | -89,3 | -0,76R | |
| 3688 | NAS100 | 22.07.25 09:30 | SELL | 23168.52 | 23252.03 | 22917.96 | 23066.71 | Zeit | +99,5 | +1,19R | |
| 3687 | NAS100 | 21.07.25 09:30 | BUY | 23110.21 | 23044.42 | 23307.60 | 23185.50 | Zeit | +73,0 | +1,11R | |
| 3686 | NAS100 | 18.07.25 09:30 | SELL | 23114.10 | 23219.82 | 22796.92 | 23064.45 | Zeit | +47,3 | +0,45R | |
| 3685 | NAS100 | 17.07.25 09:33 | SELL | 22903.54 | 23034.28 | 22511.35 | 23034.28 | SL | -133,0 | -1,02R | |
| 3684 | NAS100 | 16.07.25 09:31 | SELL | 22881.75 | 22967.69 | 22623.94 | 22903.58 | Zeit | -24,1 | -0,28R | |
| 3683 | NAS100 | 15.07.25 09:30 | BUY | 23044.61 | 22932.93 | 23379.64 | 22932.93 | SL | -114,0 | -1,02R | |
| 3682 | NAS100 | 14.07.25 09:30 | BUY | 22779.34 | 22700.65 | 23015.38 | 22700.65 | SL | -81,0 | -1,03R | |
| 3681 | NAS100 | 11.07.25 09:30 | BUY | 22751.03 | 22657.63 | 23031.25 | 22773.84 | Zeit | +20,5 | +0,22R | |
| 3680 | NAS100 | 10.07.25 09:32 | SELL | 22864.78 | 22958.63 | 22583.23 | 22826.95 | Zeit | +35,5 | +0,38R | |
| 3679 | NAS100 | 09.07.25 09:30 | BUY | 22795.65 | 22735.08 | 22977.35 | 22735.08 | SL | -62,8 | -1,04R | |
| 3678 | NAS100 | 08.07.25 09:32 | SELL | 22718.85 | 22818.05 | 22421.25 | 22695.70 | Zeit | +20,9 | +0,21R | |
| 3677 | NAS100 | 07.07.25 09:30 | BUY | 22755.66 | 22727.34 | 22840.65 | 22727.34 | SL | -30,6 | -1,08R | |
| 3676 | NAS100 | 04.07.25 09:35 | SELL | 22704.26 | 22793.21 | 22437.43 | 22708.95 | Zeit | -7,0 | -0,08R | |
| 3675 | NAS100 | 03.07.25 09:30 | BUY | 22741.00 | 22640.07 | 23043.78 | 22866.39 | Zeit | +123,1 | +1,22R | |
| 3674 | NAS100 | 02.07.25 09:32 | BUY | 22468.05 | 22343.74 | 22840.97 | 22632.13 | Zeit | +161,8 | +1,30R | |
| 3673 | NAS100 | 01.07.25 09:30 | BUY | 22603.17 | 22526.69 | 22832.62 | 22526.69 | SL | -78,7 | -1,03R | |
| 3672 | NAS100 | 30.06.25 09:31 | SELL | 22630.70 | 22741.04 | 22299.66 | 22669.67 | Zeit | -41,2 | -0,37R | |
| 3671 | NAS100 | 27.06.25 09:34 | BUY | 22512.04 | 22404.94 | 22833.36 | 22404.94 | SL | -109,4 | -1,02R | |
| 3670 | NAS100 | 26.06.25 09:32 | SELL | 22314.81 | 22395.38 | 22073.07 | 22395.38 | SL | -82,8 | -1,03R | |
| 3669 | NAS100 | 25.06.25 09:30 | BUY | 22294.94 | 22204.79 | 22565.39 | 22204.79 | SL | -92,4 | -1,02R | |
| 3668 | NAS100 | 24.06.25 09:42 | BUY | 22103.70 | 21926.75 | 22634.55 | 22182.78 | Zeit | +76,9 | +0,43R | |
| 3667 | NAS100 | 23.06.25 09:31 | SELL | 21614.05 | 21794.94 | 21071.39 | 21794.94 | SL | -183,1 | -1,01R | |
| 3666 | NAS100 | 20.06.25 09:30 | BUY | 21864.56 | 21797.01 | 22067.23 | 21797.01 | SL | -69,7 | -1,03R | |
| 3665 | NAS100 | 19.06.25 09:30 | SELL | 21534.39 | 21639.47 | 21219.17 | 21477.32 | Zeit | +54,9 | +0,52R | |
| 3664 | NAS100 | 18.06.25 09:30 | SELL | 21737.29 | 21849.60 | 21400.38 | 21849.60 | SL | -114,5 | -1,02R | |
| 3663 | NAS100 | 17.06.25 09:30 | BUY | 21846.19 | 21744.52 | 22151.21 | 21744.52 | SL | -103,9 | -1,02R | |
| 3662 | NAS100 | 16.06.25 09:30 | BUY | 21803.73 | 21678.69 | 22178.84 | 21936.63 | Zeit | +130,7 | +1,04R | |
| 3661 | NAS100 | 13.06.25 09:30 | BUY | 21678.01 | 21598.84 | 21915.52 | 21598.84 | SL | -81,3 | -1,03R | |
| 3660 | NAS100 | 12.06.25 09:30 | BUY | 21832.16 | 21694.52 | 22245.06 | 21914.88 | Zeit | +80,5 | +0,58R | |
| 3659 | NAS100 | 11.06.25 09:31 | SELL | 21967.54 | 22091.51 | 21595.62 | 21864.59 | Zeit | +100,7 | +0,81R | |
| 3658 | NAS100 | 10.06.25 09:30 | BUY | 21822.67 | 21754.11 | 22028.35 | 21754.11 | SL | -70,7 | -1,03R | |
| 3657 | NAS100 | 09.06.25 09:30 | BUY | 21782.22 | 21708.27 | 22004.09 | 21790.80 | Zeit | +6,4 | +0,09R | |
| 3656 | NAS100 | 06.06.25 09:42 | BUY | 21807.89 | 21594.20 | 22448.96 | 21756.12 | Zeit | -53,9 | -0,25R | |
| 3655 | NAS100 | 05.06.25 09:30 | BUY | 21794.55 | 21714.40 | 22034.98 | 21714.40 | SL | -82,3 | -1,03R | |
| 3654 | NAS100 | 04.06.25 09:31 | BUY | 21713.43 | 21589.65 | 22084.78 | 21718.87 | Zeit | +3,3 | +0,03R | |
| 3653 | NAS100 | 03.06.25 09:30 | BUY | 21536.96 | 21383.16 | 21998.34 | 21664.29 | Zeit | +125,2 | +0,81R | |
| 3652 | NAS100 | 02.06.25 09:30 | BUY | 21283.00 | 21101.09 | 21828.72 | 21491.15 | Zeit | +206,0 | +1,13R | |
| 3651 | NAS100 | 30.05.25 09:31 | SELL | 21296.70 | 21484.79 | 20732.42 | 21322.05 | Zeit | -27,5 | -0,15R | |
| 3650 | NAS100 | 29.05.25 09:30 | SELL | 21599.75 | 21707.22 | 21277.33 | 21277.33 | TP | +320,3 | +2,98R | |
| 3649 | NAS100 | 28.05.25 09:37 | BUY | 21476.60 | 21331.16 | 21912.90 | 21331.16 | SL | -147,6 | -1,01R | |
| 3648 | NAS100 | 27.05.25 09:30 | BUY | 21214.49 | 21168.66 | 21351.97 | 21168.66 | SL | -47,9 | -1,05R | |
| 3647 | NAS100 | 26.05.25 09:32 | BUY | 21230.77 | 21098.31 | 21628.13 | 21224.28 | Zeit | -8,6 | -0,07R | |
| 3646 | NAS100 | 23.05.25 09:30 | BUY | 20807.73 | 20696.94 | 21140.11 | 20920.85 | Zeit | +111,0 | +1,00R | |
| 3645 | NAS100 | 22.05.25 09:32 | BUY | 21147.31 | 20904.88 | 21874.59 | 21115.08 | Zeit | -34,3 | -0,14R | |
| 3644 | NAS100 | 21.05.25 09:30 | BUY | 21223.90 | 21136.31 | 21486.69 | 21136.31 | SL | -89,7 | -1,02R | |
| 3643 | NAS100 | 20.05.25 09:47 | SELL | 21302.88 | 21473.18 | 20792.00 | 21373.61 | Zeit | -72,9 | -0,43R | |
| 3642 | NAS100 | 19.05.25 09:30 | BUY | 21142.39 | 21046.92 | 21428.82 | 21428.82 | TP | +284,3 | +2,98R | |
| 3641 | NAS100 | 16.05.25 09:30 | SELL | 21356.78 | 21496.13 | 20938.73 | 21424.75 | Zeit | -70,1 | -0,50R | |
| 3640 | NAS100 | 15.05.25 09:30 | SELL | 21205.55 | 21279.16 | 20984.73 | 21279.16 | SL | -75,7 | -1,03R | |
| 3639 | NAS100 | 14.05.25 09:32 | BUY | 21270.55 | 21084.21 | 21829.57 | 21315.53 | Zeit | +42,9 | +0,23R | |
| 3638 | NAS100 | 13.05.25 09:31 | SELL | 20895.75 | 21026.65 | 20503.05 | 21026.65 | SL | -133,0 | -1,02R | |
| 3637 | NAS100 | 12.05.25 09:30 | SELL | 20819.46 | 20930.15 | 20487.38 | 20864.51 | Zeit | -47,1 | -0,43R | |
| 3636 | NAS100 | 09.05.25 09:34 | BUY | 20181.39 | 20005.54 | 20708.94 | 20005.54 | SL | -177,9 | -1,01R | |
| 3635 | NAS100 | 08.05.25 09:32 | SELL | 20042.90 | 20230.16 | 19481.12 | 20230.16 | SL | -189,3 | -1,01R | |
| 3634 | NAS100 | 07.05.25 09:30 | SELL | 19784.20 | 19927.47 | 19354.40 | 19927.47 | SL | -145,2 | -1,01R | |
| 3633 | NAS100 | 06.05.25 09:31 | BUY | 19727.53 | 19622.30 | 20043.23 | 19787.15 | Zeit | +57,6 | +0,55R | |
| 3632 | NAS100 | 05.05.25 09:35 | BUY | 19940.02 | 19814.35 | 20317.06 | 19974.78 | Zeit | +32,8 | +0,26R | |
| 3631 | NAS100 | 02.05.25 09:32 | BUY | 20023.87 | 19889.73 | 20426.29 | 20087.88 | Zeit | +62,0 | +0,46R | |
| 3630 | NAS100 | 01.05.25 09:39 | SELL | 19812.92 | 20116.44 | 18902.33 | 19773.75 | Zeit | +37,2 | +0,12R | |
| 3629 | NAS100 | 30.04.25 09:30 | SELL | 19170.69 | 19311.28 | 18748.93 | 19311.28 | SL | -142,5 | -1,01R | |
| 3628 | NAS100 | 29.04.25 09:32 | BUY | 19361.12 | 19179.96 | 19904.61 | 19540.50 | Zeit | +177,4 | +0,98R | |
| 3627 | NAS100 | 28.04.25 09:33 | SELL | 19409.25 | 19567.66 | 18934.02 | 19421.95 | Zeit | -14,6 | -0,09R | |
| 3626 | NAS100 | 25.04.25 09:35 | BUY | 19242.63 | 18999.02 | 19973.48 | 19421.71 | Zeit | +177,2 | +0,73R | |
| 3625 | NAS100 | 24.04.25 09:40 | BUY | 18801.42 | 18583.14 | 19456.25 | 19204.64 | Zeit | +401,3 | +1,84R | |
| 3624 | NAS100 | 23.04.25 09:32 | BUY | 18877.80 | 18673.81 | 19489.77 | 18673.81 | SL | -205,9 | -1,01R | |
| 3623 | NAS100 | 22.04.25 09:30 | SELL | 17997.16 | 18225.74 | 17311.43 | 18225.74 | SL | -230,4 | -1,01R | |
| 3622 | NAS100 | 21.04.25 09:31 | BUY | 18032.31 | 17904.19 | 18416.66 | 17904.19 | SL | -129,9 | -1,01R | |
| 3621 | NAS100 | 17.04.25 09:31 | SELL | 18321.23 | 18627.89 | 17401.25 | 18250.05 | Zeit | +69,3 | +0,23R | |
| 3620 | NAS100 | 16.04.25 09:30 | BUY | 18475.07 | 18346.19 | 18861.72 | 18346.19 | SL | -130,7 | -1,01R | |
| 3619 | NAS100 | 15.04.25 09:33 | BUY | 18899.13 | 18642.70 | 19668.43 | 18823.45 | Zeit | -77,6 | -0,30R | |
| 3618 | NAS100 | 14.04.25 09:35 | SELL | 19031.98 | 19329.06 | 18140.75 | 18799.42 | Zeit | +230,7 | +0,78R | |
| 3617 | NAS100 | 11.04.25 09:39 | BUY | 18371.58 | 17902.45 | 19778.98 | 18668.41 | Zeit | +295,0 | +0,63R | |
| 3616 | NAS100 | 10.04.25 11:16 | SELL | 18419.38 | 19495.79 | 15190.15 | 18339.88 | Zeit | +77,6 | +0,07R | |
| 3615 | NAS100 | 09.04.25 09:32 | BUY | 17213.48 | 16523.77 | 19282.62 | 19124.31 | Zeit | +1909,1 | +2,77R | |
| 3614 | NAS100 | 08.04.25 10:05 | BUY | 18187.89 | 17344.97 | 20716.68 | 17344.97 | SL | -844,7 | -1,00R | |
| 3613 | NAS100 | 07.04.25 09:35 | SELL | 16713.49 | 17065.80 | 15656.55 | 17065.80 | SL | -354,0 | -1,00R | |
| 3612 | NAS100 | 04.04.25 09:30 | BUY | 18032.60 | 17833.31 | 18630.47 | 17833.31 | SL | -201,1 | -1,01R | |
| 3611 | NAS100 | 03.04.25 09:30 | BUY | 18806.34 | 18521.48 | 19660.89 | 18521.48 | SL | -286,7 | -1,01R | |
| 3610 | NAS100 | 02.04.25 09:33 | BUY | 19195.43 | 19004.76 | 19767.46 | 19573.26 | Zeit | +375,9 | +1,97R | |
| 3609 | NAS100 | 01.04.25 09:33 | BUY | 19257.81 | 19000.48 | 20029.77 | 19430.00 | Zeit | +170,3 | +0,66R | |
| 3608 | NAS100 | 31.03.25 09:31 | SELL | 18963.10 | 19085.86 | 18594.84 | 19085.86 | SL | -124,7 | -1,01R | |
| 3607 | NAS100 | 28.03.25 09:33 | SELL | 19431.16 | 19542.02 | 19098.56 | 19231.16 | Zeit | +198,0 | +1,79R | |
| 3606 | NAS100 | 27.03.25 09:37 | BUY | 19950.60 | 19814.36 | 20359.30 | 19814.36 | SL | -138,2 | -1,01R | |
| 3605 | NAS100 | 26.03.25 09:30 | SELL | 20075.37 | 20128.40 | 19916.29 | 19916.29 | TP | +157,1 | +2,96R | |
| 3604 | NAS100 | 25.03.25 09:31 | SELL | 20244.69 | 20293.84 | 20097.26 | 20293.84 | SL | -51,2 | -1,04R | |
| 3603 | NAS100 | 24.03.25 10:07 | BUY | 20165.22 | 20020.60 | 20599.07 | 20163.74 | Zeit | -3,5 | -0,02R | |
| 3602 | NAS100 | 21.03.25 09:40 | SELL | 19512.20 | 19663.93 | 19057.02 | 19663.93 | SL | -153,7 | -1,01R | |
| 3601 | NAS100 | 20.03.25 09:43 | BUY | 19877.85 | 19697.20 | 20419.78 | 19697.20 | SL | -182,6 | -1,01R | |
| 3600 | NAS100 | 19.03.25 09:42 | SELL | 19616.82 | 19705.33 | 19351.27 | 19705.33 | SL | -90,5 | -1,02R | |
| 3599 | NAS100 | 18.03.25 09:42 | BUY | 19519.38 | 19354.35 | 20014.47 | 19508.48 | Zeit | -12,9 | -0,08R | |
| 3598 | NAS100 | 17.03.25 09:36 | SELL | 19673.92 | 19810.69 | 19263.60 | 19810.69 | SL | -138,7 | -1,01R | |
| 3597 | NAS100 | 14.03.25 09:32 | BUY | 19494.39 | 19313.92 | 20035.83 | 19644.06 | Zeit | +147,7 | +0,82R | |
| 3596 | NAS100 | 13.03.25 09:30 | BUY | 19492.44 | 19326.30 | 19990.85 | 19326.30 | SL | -168,1 | -1,01R | |
| 3595 | NAS100 | 12.03.25 09:31 | SELL | 19561.89 | 19802.65 | 18839.61 | 19550.80 | Zeit | +9,1 | +0,04R | |
| 3594 | NAS100 | 11.03.25 09:30 | BUY | 19337.68 | 19122.72 | 19982.58 | 19411.11 | Zeit | +71,5 | +0,33R | |
| 3593 | NAS100 | 10.03.25 09:45 | SELL | 19584.70 | 19845.18 | 18803.29 | 19433.70 | Zeit | +149,0 | +0,57R | |
| 3592 | NAS100 | 07.03.25 09:33 | BUY | 20054.87 | 19800.47 | 20818.07 | 19800.47 | SL | -256,4 | -1,01R | |
| 3591 | NAS100 | 06.03.25 09:30 | SELL | 20225.94 | 20479.01 | 19466.74 | 20056.71 | Zeit | +167,2 | +0,66R | |
| 3590 | NAS100 | 05.03.25 09:36 | SELL | 20312.94 | 20641.08 | 19328.52 | 20641.08 | SL | -330,2 | -1,01R | |
| 3589 | NAS100 | 04.03.25 09:32 | SELL | 20221.19 | 20620.34 | 19023.74 | 20620.34 | SL | -401,2 | -1,00R | |
| 3588 | NAS100 | 03.03.25 09:33 | BUY | 21057.02 | 20815.86 | 21780.49 | 20815.86 | SL | -243,3 | -1,01R | |
| 3587 | NAS100 | 28.02.25 09:31 | SELL | 20462.23 | 20852.16 | 19292.45 | 20852.16 | SL | -392,0 | -1,00R | |
| 3586 | NAS100 | 27.02.25 09:36 | BUY | 21318.49 | 21146.65 | 21834.02 | 21146.65 | SL | -174,0 | -1,01R | |
| 3585 | NAS100 | 26.02.25 09:30 | SELL | 21134.53 | 21337.66 | 20525.13 | 21337.66 | SL | -205,3 | -1,01R | |
| 3584 | NAS100 | 25.02.25 09:31 | SELL | 21288.10 | 21484.27 | 20699.56 | 21085.66 | Zeit | +200,3 | +1,02R | |
| 3583 | NAS100 | 24.02.25 09:37 | SELL | 21634.17 | 21894.78 | 20852.31 | 21356.29 | Zeit | +275,7 | +1,06R | |
| 3582 | NAS100 | 21.02.25 09:31 | SELL | 22087.55 | 22222.46 | 21682.81 | 21682.81 | TP | +402,5 | +2,98R | |
| 3581 | NAS100 | 20.02.25 09:33 | SELL | 22110.83 | 22201.07 | 21840.09 | 22070.09 | Zeit | +38,5 | +0,43R | |
| 3580 | NAS100 | 19.02.25 09:31 | SELL | 22112.27 | 22196.07 | 21860.87 | 22196.07 | SL | -86,0 | -1,03R | |
| 3579 | NAS100 | 18.02.25 09:30 | SELL | 22177.07 | 22206.53 | 22088.70 | 22088.70 | TP | +86,2 | +2,92R | |
| 3578 | NAS100 | 17.02.25 09:30 | SELL | 22150.72 | 22218.54 | 21947.29 | 22156.81 | Zeit | -8,3 | -0,12R | |
| 3577 | NAS100 | 14.02.25 09:31 | BUY | 22052.30 | 21909.13 | 22481.78 | 22115.82 | Zeit | +61,3 | +0,43R | |
| 3576 | NAS100 | 13.02.25 09:31 | BUY | 21811.52 | 21659.56 | 22267.40 | 22020.83 | Zeit | +207,1 | +1,36R | |
| 3575 | NAS100 | 12.02.25 09:30 | BUY | 21476.58 | 21390.01 | 21736.30 | 21736.30 | TP | +257,6 | +2,98R | |
| 3574 | NAS100 | 11.02.25 09:30 | BUY | 21625.24 | 21552.75 | 21842.72 | 21697.32 | Zeit | +69,9 | +0,96R | |
| 3573 | NAS100 | 10.02.25 09:45 | BUY | 21712.18 | 21507.93 | 22324.93 | 21747.91 | Zeit | +33,6 | +0,16R | |
| 3572 | NAS100 | 07.02.25 09:30 | SELL | 21774.12 | 21858.74 | 21520.25 | 21858.74 | SL | -86,8 | -1,03R | |
| 3571 | NAS100 | 06.02.25 09:31 | SELL | 21647.10 | 21779.07 | 21251.22 | 21767.93 | Zeit | -123,0 | -0,93R | |
| 3570 | NAS100 | 05.02.25 09:32 | SELL | 21415.67 | 21558.49 | 20987.18 | 21558.49 | SL | -145,0 | -1,01R | |
| 3569 | NAS100 | 04.02.25 09:35 | BUY | 21357.97 | 21154.06 | 21969.68 | 21559.92 | Zeit | +199,8 | +0,98R | |
| 3568 | NAS100 | 03.02.25 09:36 | BUY | 21146.24 | 20933.36 | 21784.89 | 21294.74 | Zeit | +146,4 | +0,69R | |
| 3567 | NAS100 | 31.01.25 09:31 | BUY | 21692.42 | 21529.31 | 22181.74 | 21529.31 | SL | -165,3 | -1,01R | |
| 3566 | NAS100 | 30.01.25 09:34 | SELL | 21506.38 | 21624.43 | 21152.23 | 21624.43 | SL | -120,2 | -1,02R | |
| 3565 | NAS100 | 29.01.25 09:32 | SELL | 21430.86 | 21664.04 | 20731.31 | 21409.67 | Zeit | +19,0 | +0,08R | |
| 3564 | NAS100 | 28.01.25 09:31 | SELL | 21142.04 | 21304.48 | 20654.72 | 21304.48 | SL | -164,6 | -1,01R | |
| 3563 | NAS100 | 27.01.25 09:30 | BUY | 21015.05 | 20897.22 | 21368.55 | 21130.28 | Zeit | +113,1 | +0,96R | |
| 3562 | NAS100 | 24.01.25 09:32 | SELL | 21888.74 | 21979.08 | 21617.71 | 21771.04 | Zeit | +115,5 | +1,28R | |
| 3561 | NAS100 | 23.01.25 09:30 | SELL | 21720.89 | 21814.02 | 21441.51 | 21814.02 | SL | -95,3 | -1,02R | |
| 3560 | NAS100 | 22.01.25 09:31 | BUY | 21791.88 | 21669.97 | 22157.59 | 21846.63 | Zeit | +52,6 | +0,43R | |
| 3559 | NAS100 | 21.01.25 09:30 | SELL | 21542.64 | 21619.16 | 21313.06 | 21619.16 | SL | -78,7 | -1,03R | |
| 3558 | NAS100 | 20.01.25 09:35 | BUY | 21588.40 | 21493.85 | 21872.05 | 21493.85 | SL | -96,7 | -1,02R | |
| 3557 | NAS100 | 17.01.25 09:30 | SELL | 21474.00 | 21596.48 | 21106.55 | 21447.92 | Zeit | +23,9 | +0,20R | |
| 3556 | NAS100 | 16.01.25 09:30 | SELL | 21301.66 | 21428.66 | 20920.68 | 21087.72 | Zeit | +211,8 | +1,67R | |
| 3555 | NAS100 | 15.01.25 09:37 | SELL | 21059.31 | 21234.86 | 20532.67 | 21234.86 | SL | -177,7 | -1,01R | |
| 3554 | NAS100 | 14.01.25 09:30 | SELL | 20885.65 | 21016.71 | 20492.48 | 20761.67 | Zeit | +121,9 | +0,93R | |
| 3553 | NAS100 | 13.01.25 09:36 | SELL | 20567.79 | 20727.56 | 20088.47 | 20727.56 | SL | -161,8 | -1,01R | |
| 3552 | NAS100 | 10.01.25 09:30 | SELL | 20991.84 | 21124.80 | 20592.94 | 20848.80 | Zeit | +140,9 | +1,06R | |
| 3551 | NAS100 | 08.01.25 09:39 | SELL | 21118.14 | 21379.01 | 20335.52 | 21174.90 | Zeit | -58,9 | -0,23R | |
| 3550 | NAS100 | 07.01.25 09:33 | SELL | 21580.44 | 21703.91 | 21210.04 | 21210.04 | TP | +368,2 | +2,98R | |
| 3549 | NAS100 | 06.01.25 09:30 | BUY | 21566.20 | 21417.71 | 22011.66 | 21560.39 | Zeit | -8,0 | -0,05R | |
| 3548 | NAS100 | 03.01.25 09:31 | BUY | 21147.26 | 20918.06 | 21834.84 | 21310.38 | Zeit | +161,0 | +0,70R | |
| 3547 | NAS100 | 02.01.25 09:33 | SELL | 21112.28 | 21261.93 | 20663.33 | 20972.84 | Zeit | +137,3 | +0,92R | |
| Gesamt: 470 | +36,2R | ||||||||||
So berechnen Sie die Lotgröße
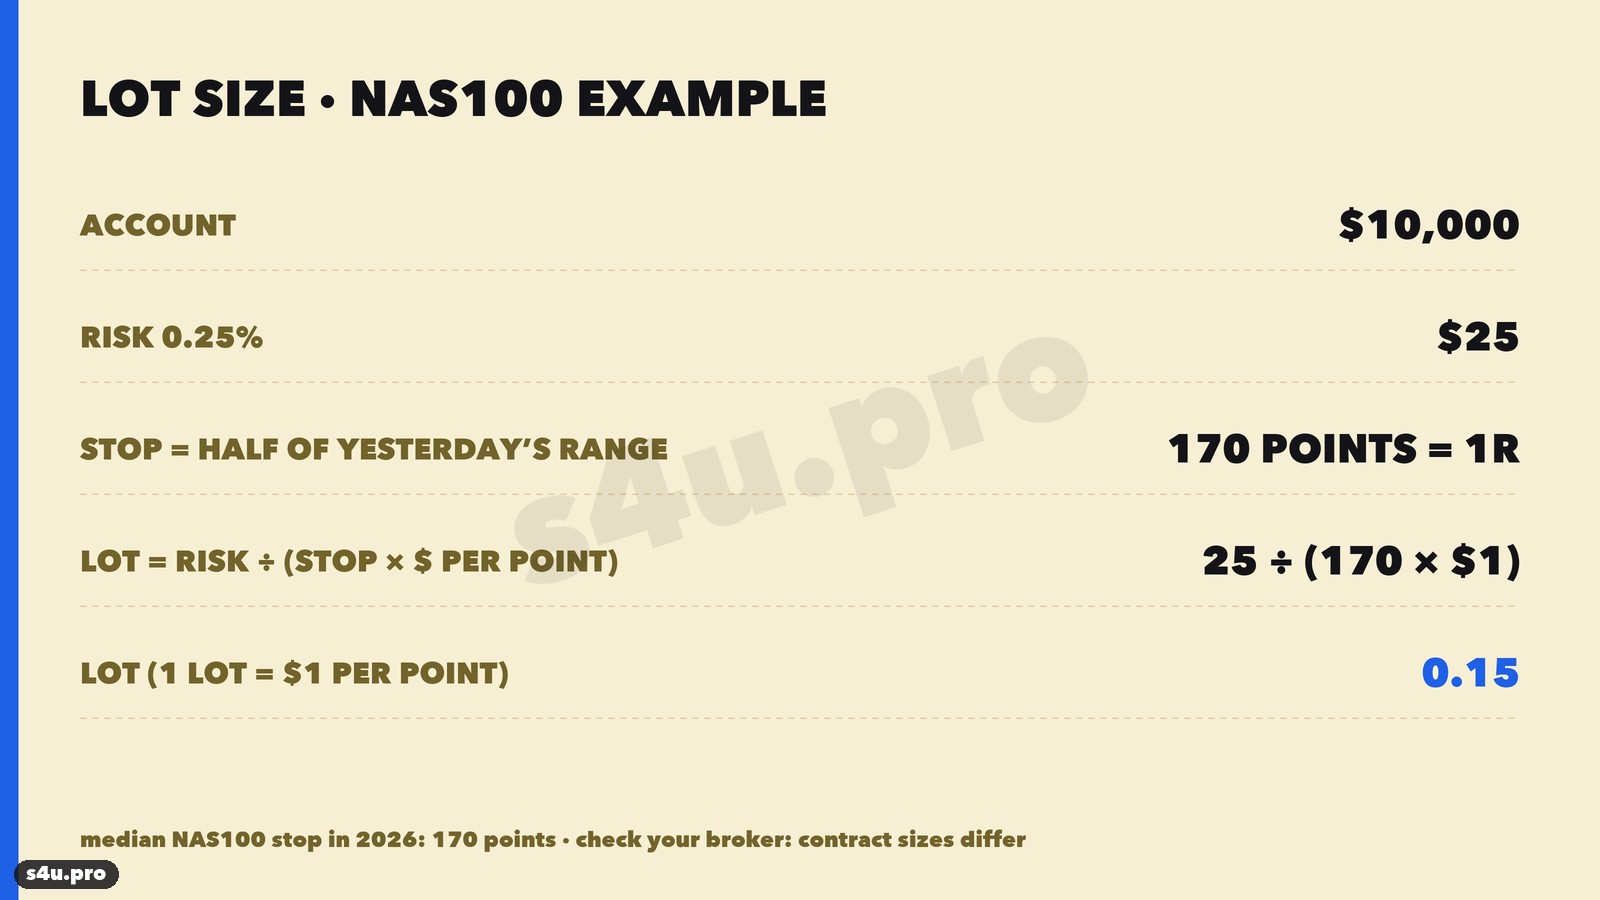
Das Risiko wird vom Stop aus berechnet: Lot = Risikobetrag ÷ (Stop in Punkten × Punktwert pro 1 Lot). Der Punktwert des NAS100 ist je nach Broker verschieden: mal 1 Lot = 1 $ pro Punkt, mal 10 $ — prüfen Sie die Kontraktspezifikation im Terminal. Beispiel: Konto 10 000 $, Risiko 0,25 % (25 $), Stop 170 Punkte, 1 Lot = 1 $ pro Punkt: Lot = 25 ÷ 170 ≈ 0,15. Der Stop ist jeden Tag anders — berechnen Sie das Lot jeden Tag neu.
45 % der Trades sind Gewinner, es gibt Serien von bis zu 15 Verlusten in Folge, der maximale Drawdown beträgt −39,5R. Bei 1 % Risiko pro Trade sind das −40 % des Kontos, bei 0,5 % −20 %, bei 0,25 % −10 %. Deshalb: Risiko 0,25–0,5 % pro Trade.Häufige Fehler
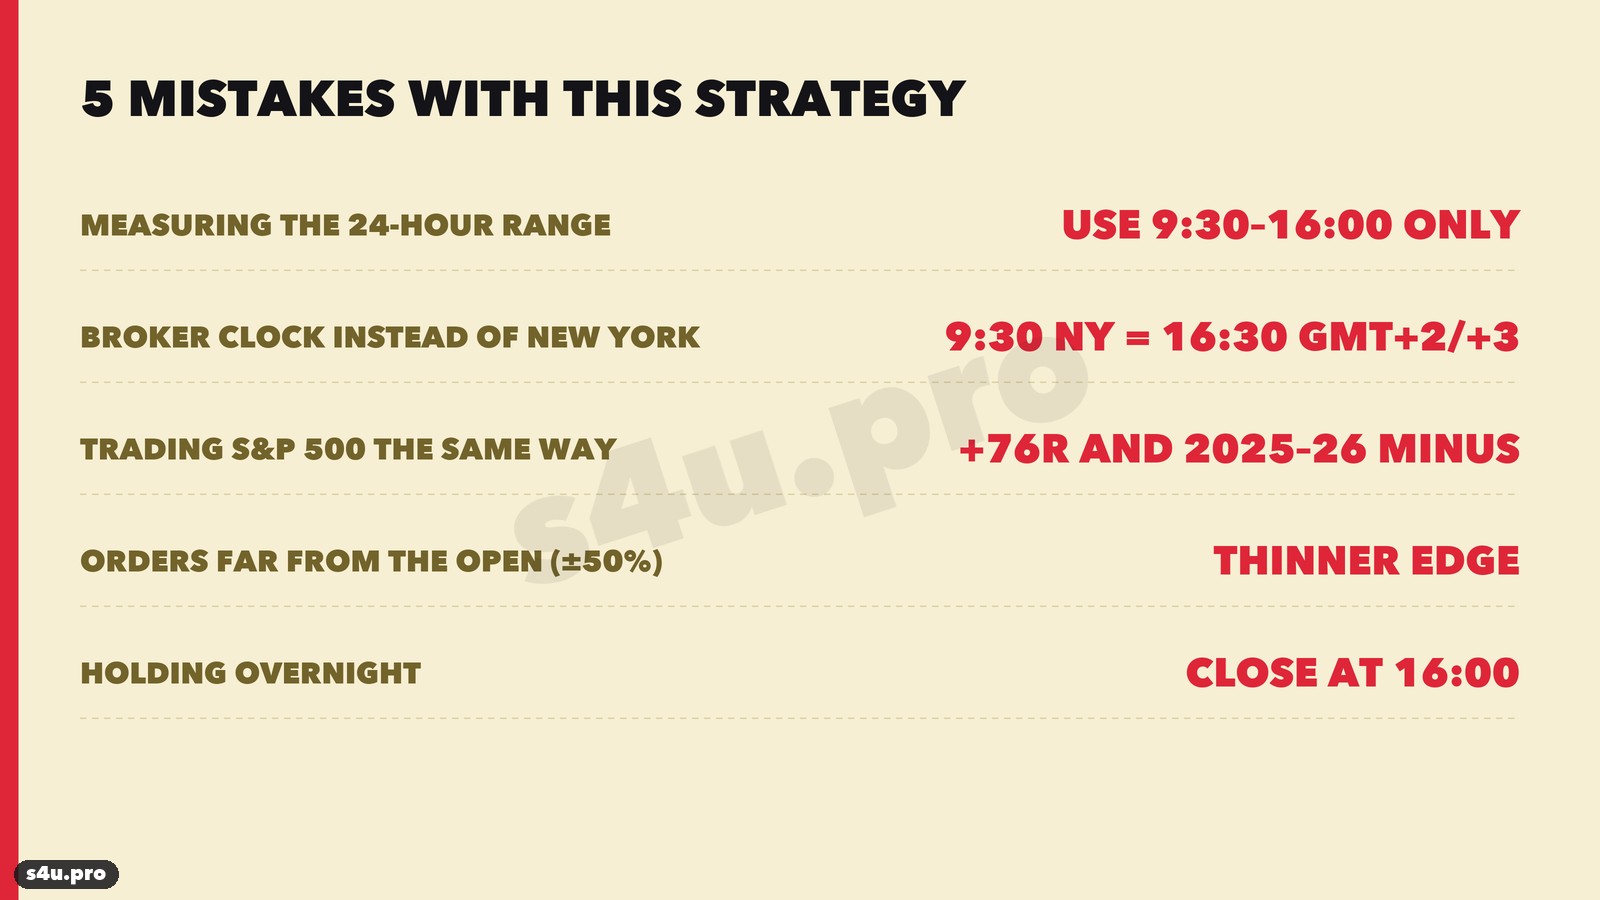
- Die 24-Stunden-Spanne messen. Nötig ist die Spanne der Börsensitzung, 9:30–16:00 New York. Die Nachtstunden machen die Spanne weiter und verschieben die Orders.
- Orders nach der Serveruhr ohne Umrechnung platzieren. 9:30 New York ist 16:30 Serverzeit GMT+2/GMT+3 und 15:30 deutscher Zeit. Hat Ihr Broker eine andere Serverzeit — umrechnen. Im März und November stellen USA und Europa die Uhren in verschiedenen Wochen um.
- Den S&P 500 genauso handeln. +76R in 16 Jahren und Verlust 2025–2026. Die Strategie ist für den NAS100.
- Orders weit von der Eröffnung legen. 30 % der Spanne sind schlechter als 10 %, und auf Tagescharts (ohne Börseneröffnung) verliert der Ausbruch Geld.
- Den Trade über Nacht halten. Regel: um 16:00 New York schließen. Das Übernachtrisiko ist nicht Teil des Tests.
FAQ
Worauf basiert die Strategie?
Auf der Idee von Larry Williams: Bewegt sich der Kurs nach der Eröffnung kräftig in eine Richtung, läuft er bis Börsenschluss meist noch weiter dorthin. Orders 10 % der gestrigen Spanne von der Eröffnung entfernt erfassen diese erste Bewegung.
Ist das die Strategie, die 1987 die Meisterschaft gewann?
Dieselbe Idee — Volatilitätsausbruch ab Tageseröffnung. Williams handelte den S&P-500-Future und stimmte die Koeffizienten selbst ab; wir nutzen den NAS100, die Börseneröffnung um 9:30 und 10 % der gestrigen Börsenspanne.
Wann platziere ich die Orders in GMT und im Terminal?
9:30 New York ist 14:30 GMT im Winter und 13:30 GMT im Sommer; auf einem GMT+2/GMT+3-Server ganzjährig 16:30. Der Schluss um 16:00 New York ist 23:00 Serverzeit.
Brauche ich einen Trendfilter?
Nein. Käufe und Verkäufe sind jeweils profitabel (+173R und +108R).
Warum nicht der S&P 500?
Im S&P 500 ist das Ergebnis dreimal schwächer (+76R), und 2025 und 2026 sind negativ.
Was ist R?
R ist die Stop-Größe. −1R heißt Stop getroffen, +3R ein Gewinn von drei Stops. Im NAS100 lag 1R 2026 im Schnitt bei 170 Punkten; bei 0,25 % Risiko ist 1R = 0,25 % des Kontos.
Welches Risiko?
0,25–0,5 % pro Trade. Der Drawdown im Test beträgt −39,5R, mit Serien von bis zu 15 Verlusten.
Wie viele Trades pro Monat?
Etwa 21 — fast jeden Handelstag: Eine Order 10 % der Spanne entfernt wird fast immer ausgeführt.
Kann ich sie zusammen mit Silver Bullet handeln?
Ja. Ihre Trades hängen kaum zusammen (Monatskorrelation nahe null), und zusammen ist der Drawdown kleiner als bei Silver Bullet allein.
Fazit
- Die Buchversionen von Larry Williams’ Strategien auf Tagescharts (Ausbruch ab Tageseröffnung, Oops!, Smash Day, Outside Day, das 3-Bar-System, %R) bringen an den heutigen Märkten null oder Verlust.
- Die funktionierende Variante ist der Volatilitätsausbruch ab der New Yorker Eröffnung um 9:30 im NAS100 (15:30 deutscher Zeit): Stop-Orders ±10 % der gestrigen Spanne, Stop 0,5 Spanne, Ziel 3R oder Ausstieg um 16:00.
- +280R aus 4 016 Trades, 45 % Gewinner, 15 von 17 Jahren im Plus, 2024 +40R, 2025 +23R, 2026 +14R. Alle 18 Nachbareinstellungen profitabel, mit dreifachem Spread +109R.
- Käufe und Verkäufe funktionieren; ein Zufallseinstieg an denselben Tagen bringt null — der Vorteil liegt im Ausbruch.
- Kaum Überschneidung mit Silver Bullet — beide lassen sich zusammen handeln.
Bevor Sie ein Echtgeldkonto handeln, testen Sie die Strategie auf einem Demokonto und führen Sie Ihr eigenes Trade-Journal wie in diesem Artikel.
Weitere Strategien, die wir an der Historie getestet haben
Dieser Artikel dient der Bildung und ist keine Anlageempfehlung. Der Handel mit Forex und CFDs ist mit einem hohen Verlustrisiko verbunden. Vergangene Ergebnisse garantieren keine zukünftigen Gewinne. Daten: 1-Minuten-Kurse des NAS100 (CFD) von histdata.com, November 2010 — Oktober 2026, in New Yorker Zeit umgerechnet; klassische Strategien — 19 Märkte, 2005–2026; Einstiege, Stops und Ziele auf 1-Minuten-Kerzen geprüft, Einstieg und Stop in derselben Minute gelten als Verlust; der Spread ist in jedem Trade abgezogen, die reale Ausführung kann abweichen.
 Mit der Handykamera scannen