Contents 14
- What is the ICT Silver Bullet
- What is an FVG and its middle (CE)
- Does the Silver Bullet work? The test
- Silver Bullet strategy: the rules
- Statistics: 4,125 trades over 15 years
- Step-by-step trade examples
- Gallery: every trade of 2025–2026
- How to calculate the lot size
- Why it works
- The Silver Bullet with other SMC models
- Common Silver Bullet mistakes
- FAQ: Silver Bullet questions
- Conclusion
- Other strategies we have backtested
The Silver Bullet is one of the most popular ICT and Smart Money models. The idea is simple: instead of watching charts all day, you trade one hour — for example, 10:00–11:00 New York time (17:00–18:00 at GMT+2 in winter and GMT+3 in summer — the MT4/MT5 terminal time at most brokers). During that hour you look for a Fair Value Gap (FVG) on M5 or M1 and enter when price comes back into that gap.
The model promises «one trade a day» and is usually shown on the Nasdaq and S&P 500 indices. We tested whether it really works: 1-minute NAS100 and SPX500 data from 2011 to October 2026, 16 forex pairs and gold, all three Silver Bullet windows and dozens of entry, stop and target variants. The spread is included in every trade.
❗ R = the stop size: −1R means the stop was hit, +4R is a profit of four stops. On NAS100 1R ≈ 53 points, on SPX500 ≈ 10; at 0.25% risk 1R = 0.25% of the account. More ▾
R is the size of the stop in a trade. 1R = the distance from entry to stop loss. The stop is hit — the trade makes −1R. Price moves four stops in our favour — +4R.
In points: in 2025–2026 the median NAS100 stop was 53 points, so 1R ≈ 53 points and the 4R target ≈ 212 points. On SPX500 1R ≈ 10 points, the 4R target ≈ 40 points.
In money: if you risk 0.25% of the account per trade, 1R = 0.25% of the account and +4R = +1%.
We count in R, not points, because every trade has its own stop and the indices grew 5–10 times in 15 years: R lets us add up trades from 2011 and 2026 fairly. The whole test result is +407R = +4,425 NAS100 points and +807 SPX500 points.
⏰ Times are New York: the 10:00–11:00 window = 17:00–18:00 server time (GMT+2/GMT+3), exit at 16:00 = 23:00 server time. More ▾
The Silver Bullet is tied to the US stock market open, so the rules are in New York time. The main window 10:00–11:00 New York time is:
- 17:00–18:00 at GMT+2 in winter and GMT+3 in summer — the MT4/MT5 server time at most brokers, so on the terminal the window stays put all year;
- 15:00–16:00 UTC in winter and 14:00–15:00 UTC in summer.
The trade exit at 16:00 New York time is 23:00 at GMT+2/GMT+3 (terminal time), 21:00 UTC in winter and 20:00 UTC in summer.
To get your local time, add your time zone offset to UTC. In Europe this is the afternoon, not the morning; in Asia it is the evening or night.
«Summer» here means US daylight saving time: from the second Sunday of March to the first Sunday of November. Europe changes clocks on other dates (last Sunday of March and October), so for 2–3 weeks a year the gap to New York is one hour smaller. In those weeks, check the New York clock.
What is the ICT Silver Bullet
The Silver Bullet was introduced by Michael Huddleston (ICT). It is not an indicator or a chart pattern but a time window plus an FVG entry. The logic: at certain hours big players enter the market, price makes a sharp move and leaves a «hole» behind — an FVG. Price then often comes back into that hole and continues the move from there.
ICT names three Silver Bullet windows. All times in this article are New York time (EST in winter, EDT in summer):
| Window | New York | UTC (winter / summer) | MT4/MT5 server (GMT+2 / GMT+3) |
|---|---|---|---|
| London Silver Bullet | 03:00–04:00 | 08:00–09:00 / 07:00–08:00 | 10:00–11:00 |
| AM Silver Bullet (main) | 10:00–11:00 | 15:00–16:00 / 14:00–15:00 | 17:00–18:00 |
| PM Silver Bullet | 14:00–15:00 | 19:00–20:00 / 18:00–19:00 | 21:00–22:00 |
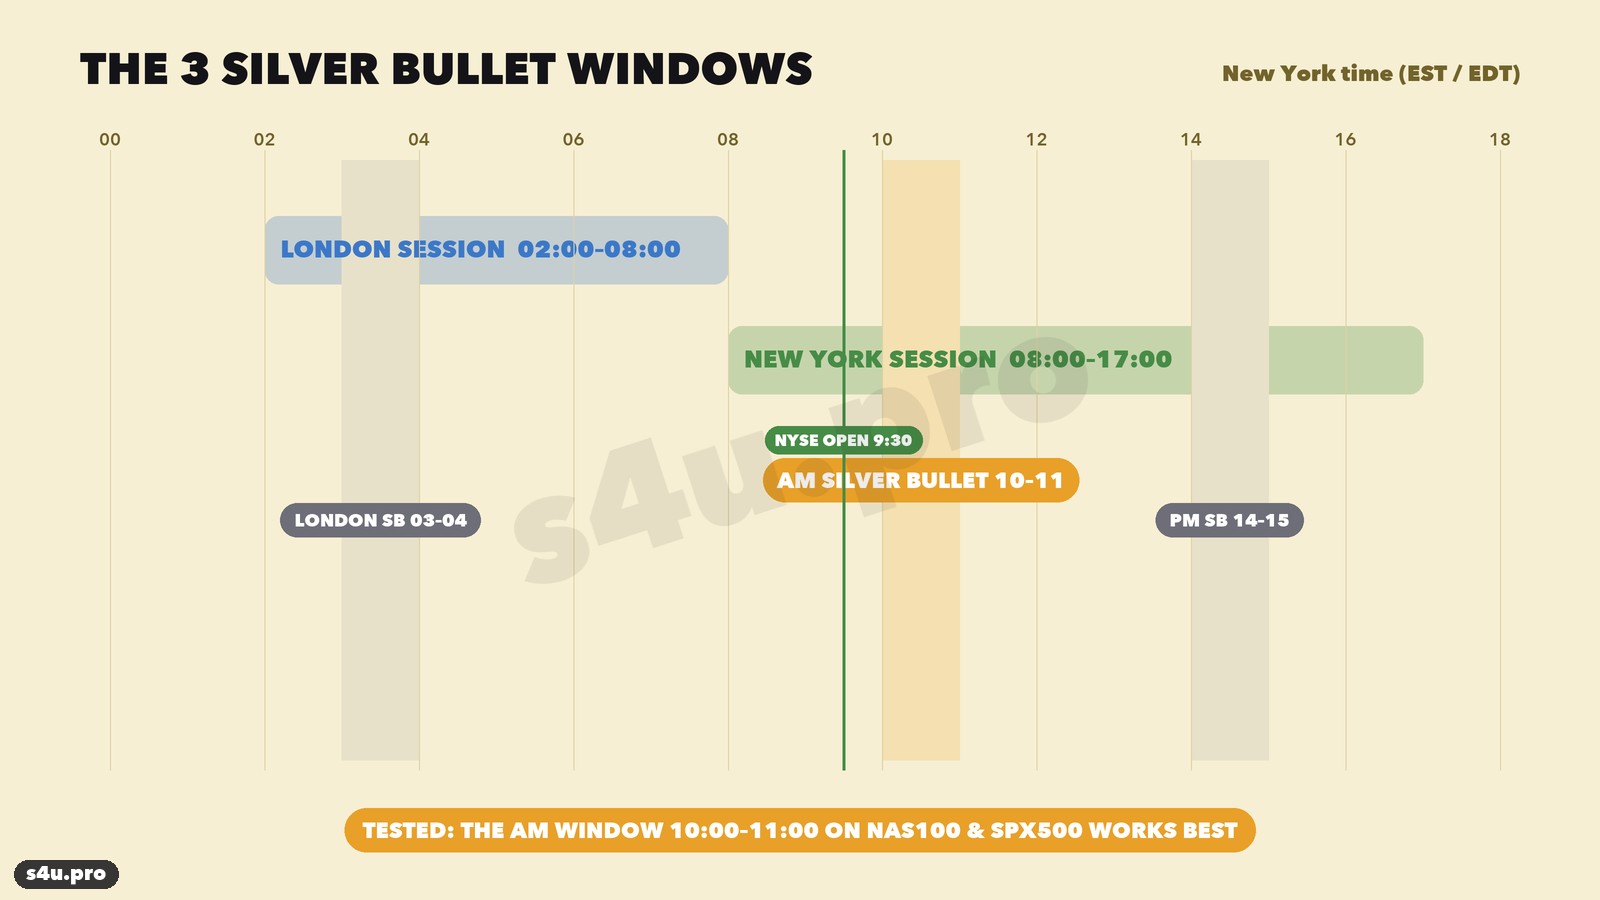
The best-known window is the AM Silver Bullet, 10:00–11:00. It starts half an hour after the New York Stock Exchange opens (9:30): the first wave of opening orders is over, and the market picks its direction for the rest of the day. Most brokers run MT4/MT5 servers on GMT+2 in winter and GMT+3 in summer, shifting together with New York, so on the terminal clock the window stays put all year: 17:00–18:00. If your broker’s server time is different, convert from New York time.
What is an FVG and its middle (CE)
A Fair Value Gap is three candles in a row with a gap between candle 1 and candle 3. Bullish: the low of candle 3 is above the high of candle 1. Bearish: the high of candle 3 is below the low of candle 1. Candle 2 is the strong impulse candle that «skips» prices and leaves the gap.
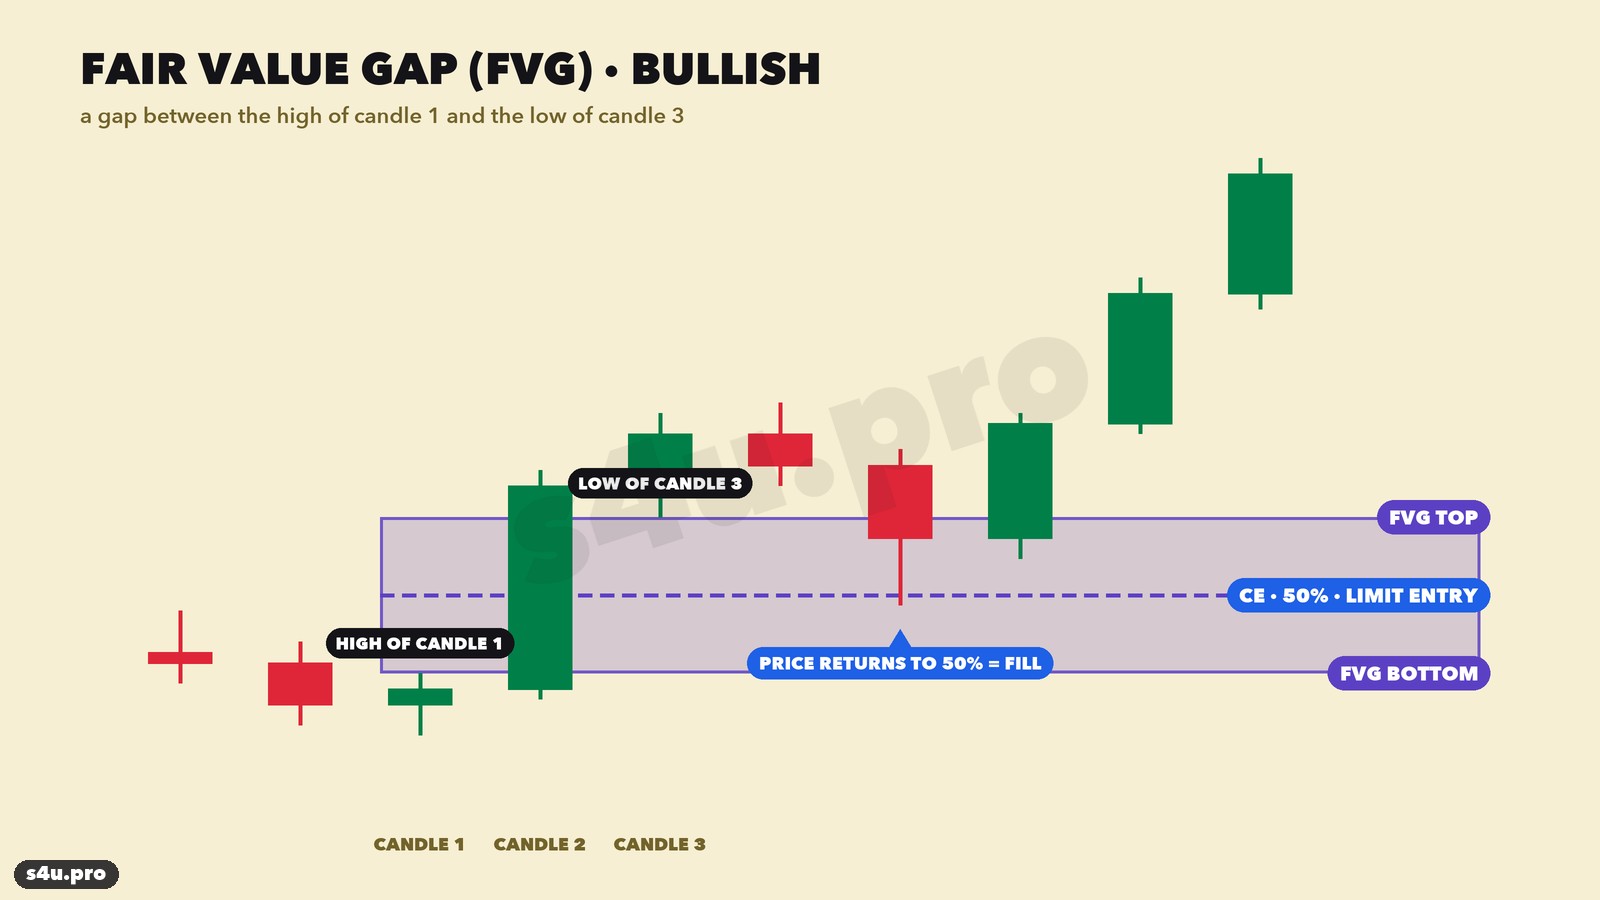
ICT calls the middle of the FVG the CE — Consequent Encroachment, i.e. 50% of the gap. In the Silver Bullet the limit order goes right there: price comes back, fills half of the gap and, if the model works, continues with the impulse. How to find gaps is covered in our Fair Value Gap (FVG) article.
Does the Silver Bullet work? The test
We took 1-minute NAS100 and SPX500 index CFD quotes (November 2010 – October 2026), built M5 candles to find FVGs, and checked entries, stops and targets on 1-minute candles — more precise than M5. Times are converted to New York time. Spread: NAS100 0.01% of price (about 2 points at 20,000), SPX500 0.012% (about 0.7 points at 6,000). If the stop and target are hit by the same 1-minute candle, we count the stop. The first trades are from September 2011: the trend filter needs 200 days of history.
The key question is direction. ICT trades in the direction of the daily bias. The simplest testable way to define it is the EMA200 on the daily chart: if yesterday closed above the EMA200, look for buys only; below — sells only.
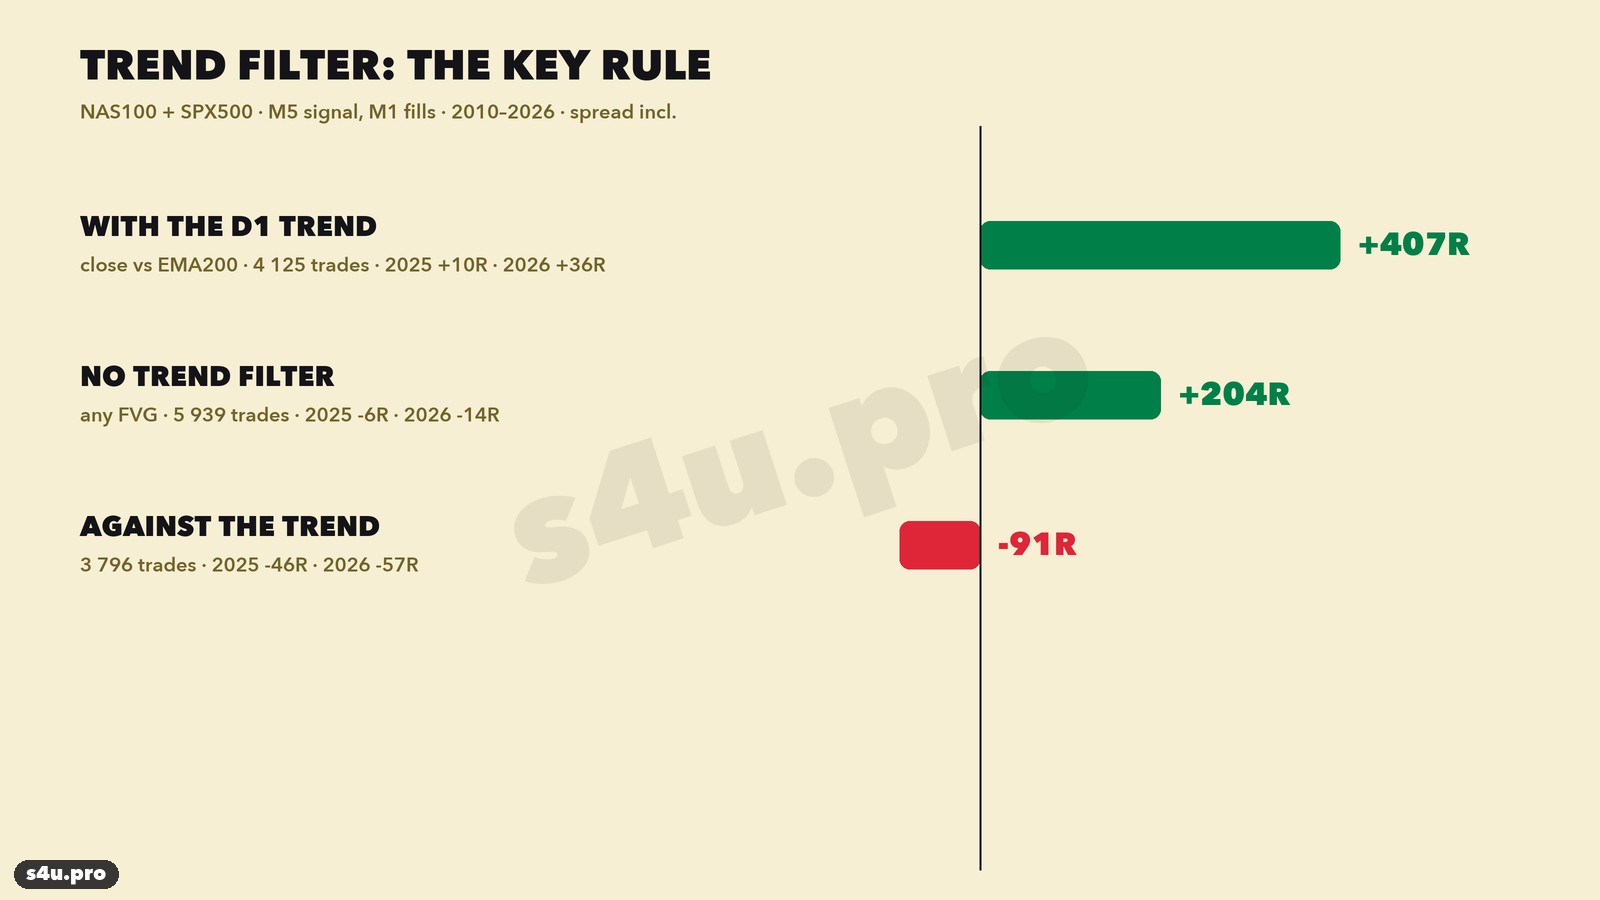
- With the D1 trend — +407R on 4,125 trades, 2025 +10R, 2026 +36R. This is the working model.
- No trend filter (any FVG in the window) — +204R on 5,939 trades, but 2025 −6R and 2026 −14R.
- Against the trend — −91R on 3,796 trades.
Then we compared the windows — same rules, different time:
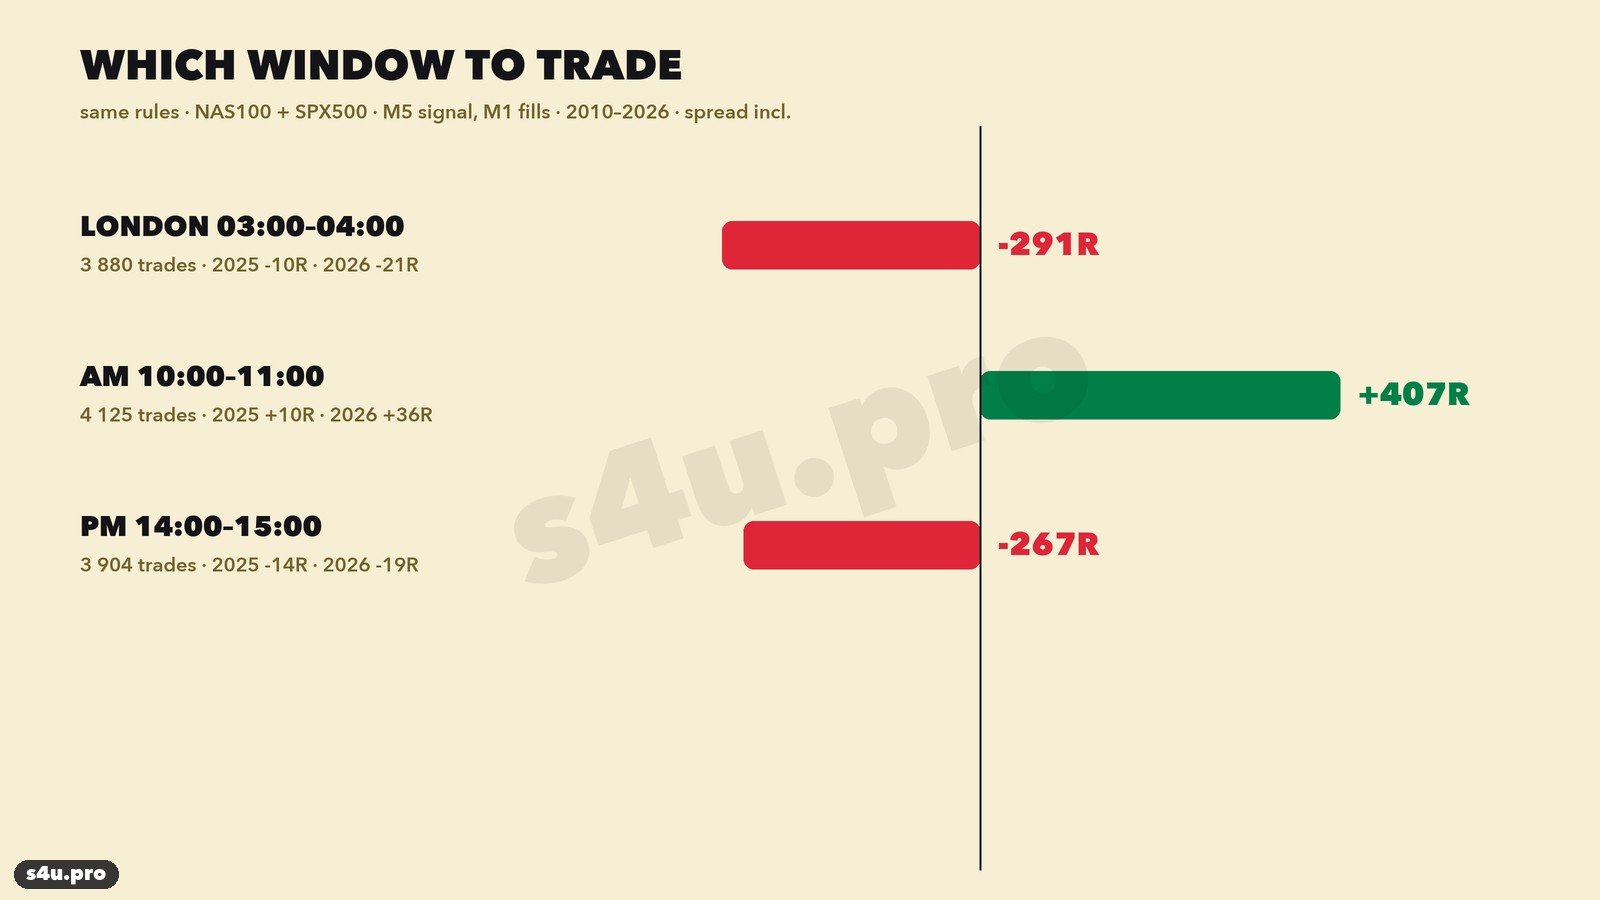
- London 03:00–04:00 — −291R on 3,880 trades. Indices move little at night, FVGs are tiny and the spread eats the result.
- AM 10:00–11:00 — +407R.
- PM 14:00–15:00 — −267R on 3,904 trades. The move of the day is usually done by then.
And the markets — same rules in the 10:00–11:00 window:
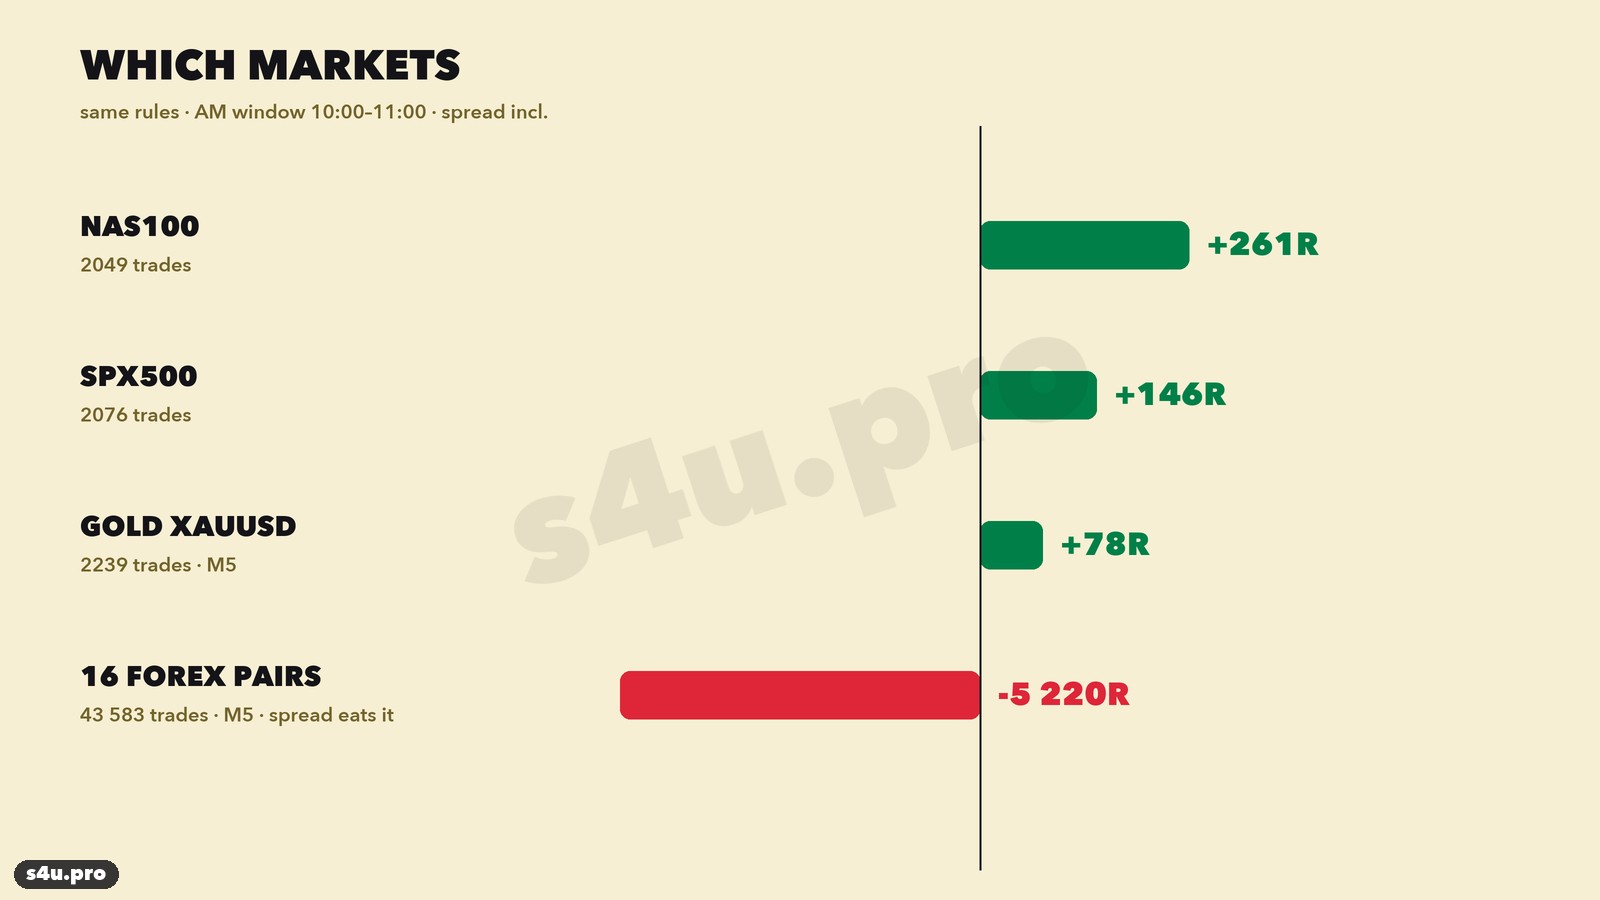
- NAS100 — +261R on 2,049 trades, SPX500 — +146R on 2,076 trades.
- Gold XAUUSD — +78R on 2,239 trades, but 2026 is negative, and with a 1.5× spread the result goes to zero.
- 16 forex pairs — −5,220R on 43,583 trades. At 10:00–11:00 New York time currencies move slowly, M5 FVGs are tiny and a stop beyond candle 1 is just a few pips: the spread takes everything. We tested 1,440 rule variants on forex — none was profitable.
Bottom line of the test: the Silver Bullet is a model for US indices, and it works in the morning window and only with the trend.
Silver Bullet strategy: the rules
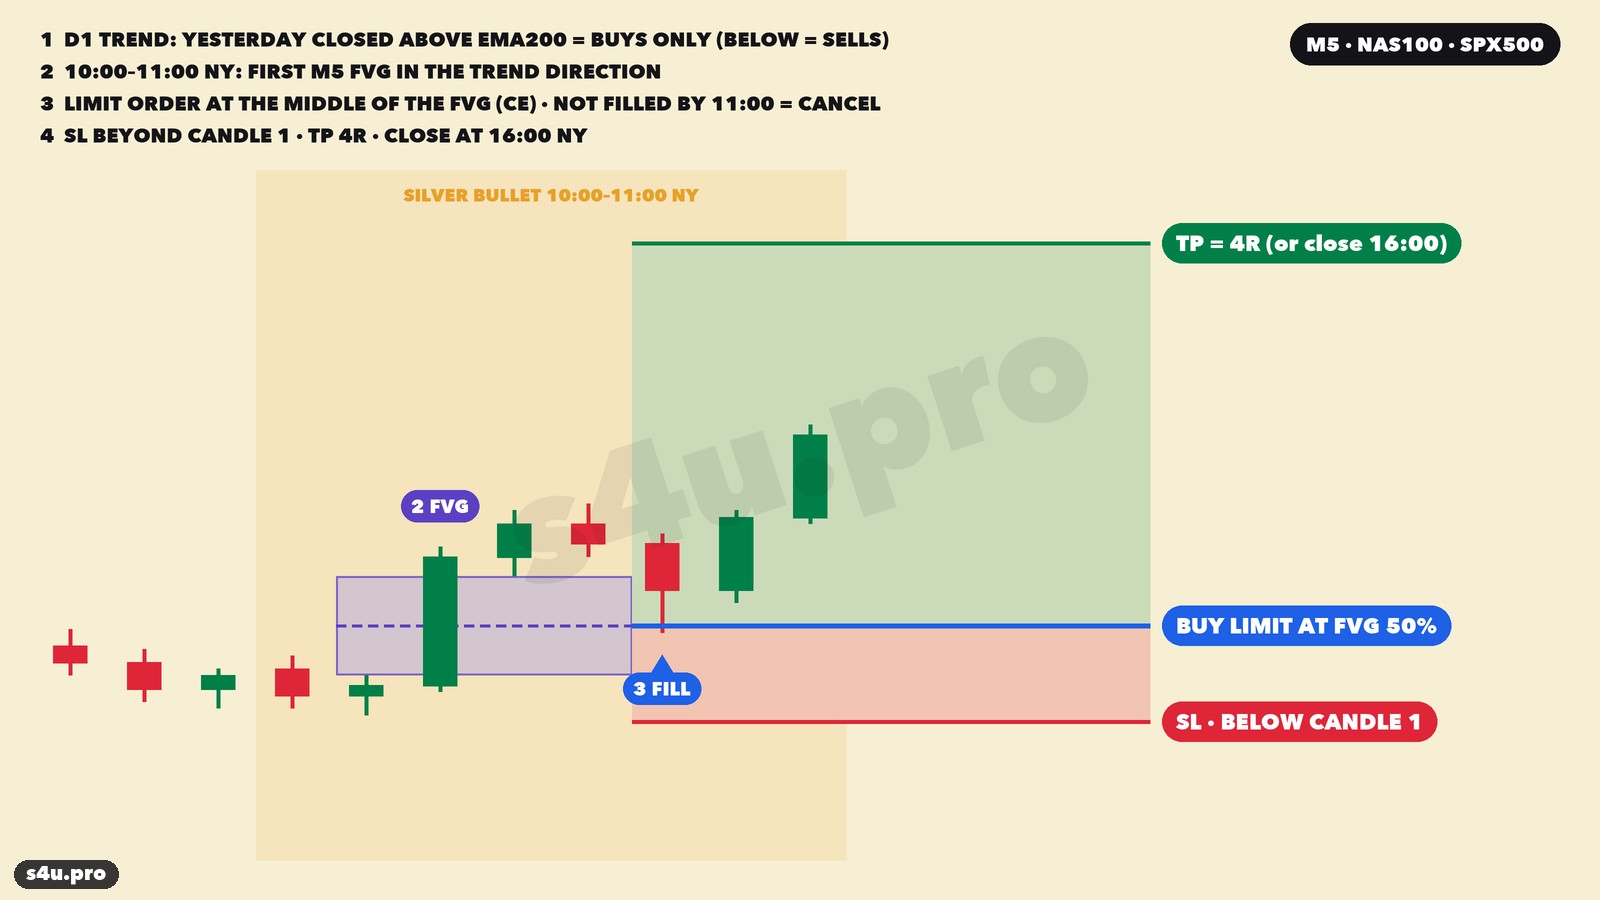
Markets: NAS100 (Nasdaq 100), SPX500 (S&P 500). Timeframe: M5. Time: New York.
- Trend. Before the session, look at the daily chart: yesterday’s daily candle closed above the EMA200 — buys only today; below — sells only.
- Window. From 10:00 to 11:00 New York time — 17:00–18:00 at GMT+2 in winter and GMT+3 in summer (terminal time), or 15:00–16:00 UTC in winter and 14:00–15:00 UTC in summer — wait for the first M5 FVG in the trend direction. Candle 3 of the FVG must close inside the window.
- Entry. A limit order at the middle of the FVG (CE): buy limit for buys, sell limit for sells. Not filled by 11:00 New York time (18:00 at GMT+2/GMT+3) — delete it; no trade on this market today. If the first FVG is not filled and another FVG in the trend direction appears in the window, you can place an order on it too.
- Stop — beyond candle 1 of the FVG: below its low for buys, above its high for sells, plus the spread.
- Target — 4R, i.e. four times the stop. If neither the stop nor the target is hit by 16:00 New York time (23:00 at GMT+2/GMT+3; 21:00 UTC in winter, 20:00 UTC in summer), close at market. On short US trading days before holidays the exchange closes early — then close before the session ends.
- No more than one trade per index per day.
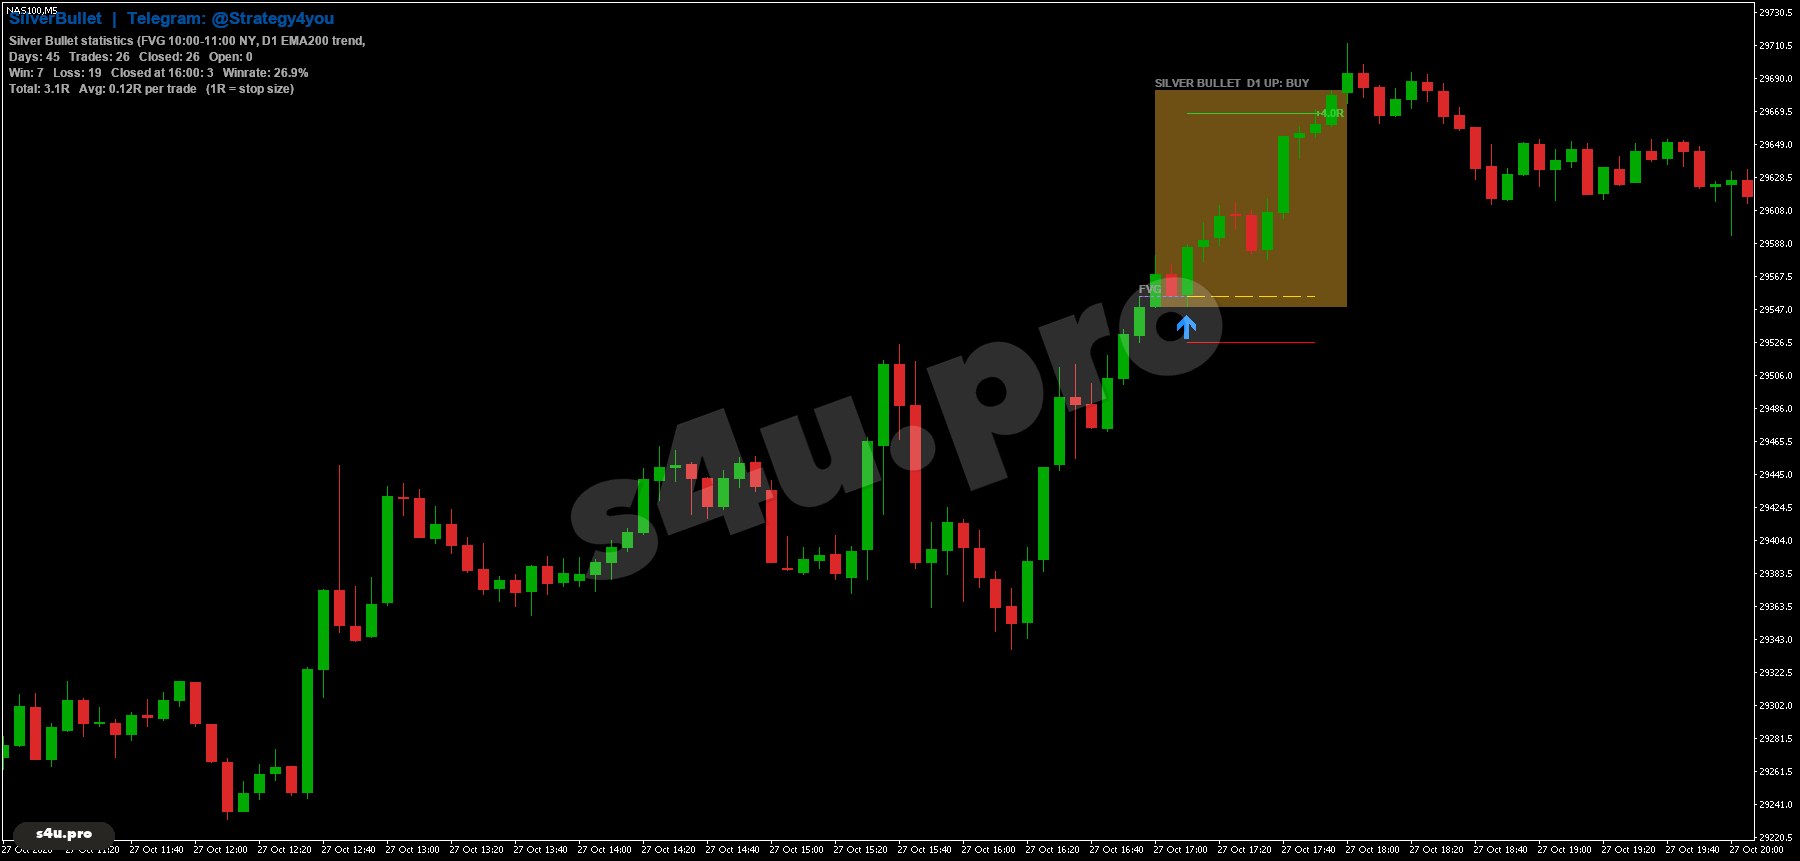
Median stop in 2025–2026: NAS100 53 points, SPX500 10 points. A trade lasts about two hours on average; half of the trades close in less than an hour. No positions are held overnight.
Statistics: 4,125 trades over 15 years
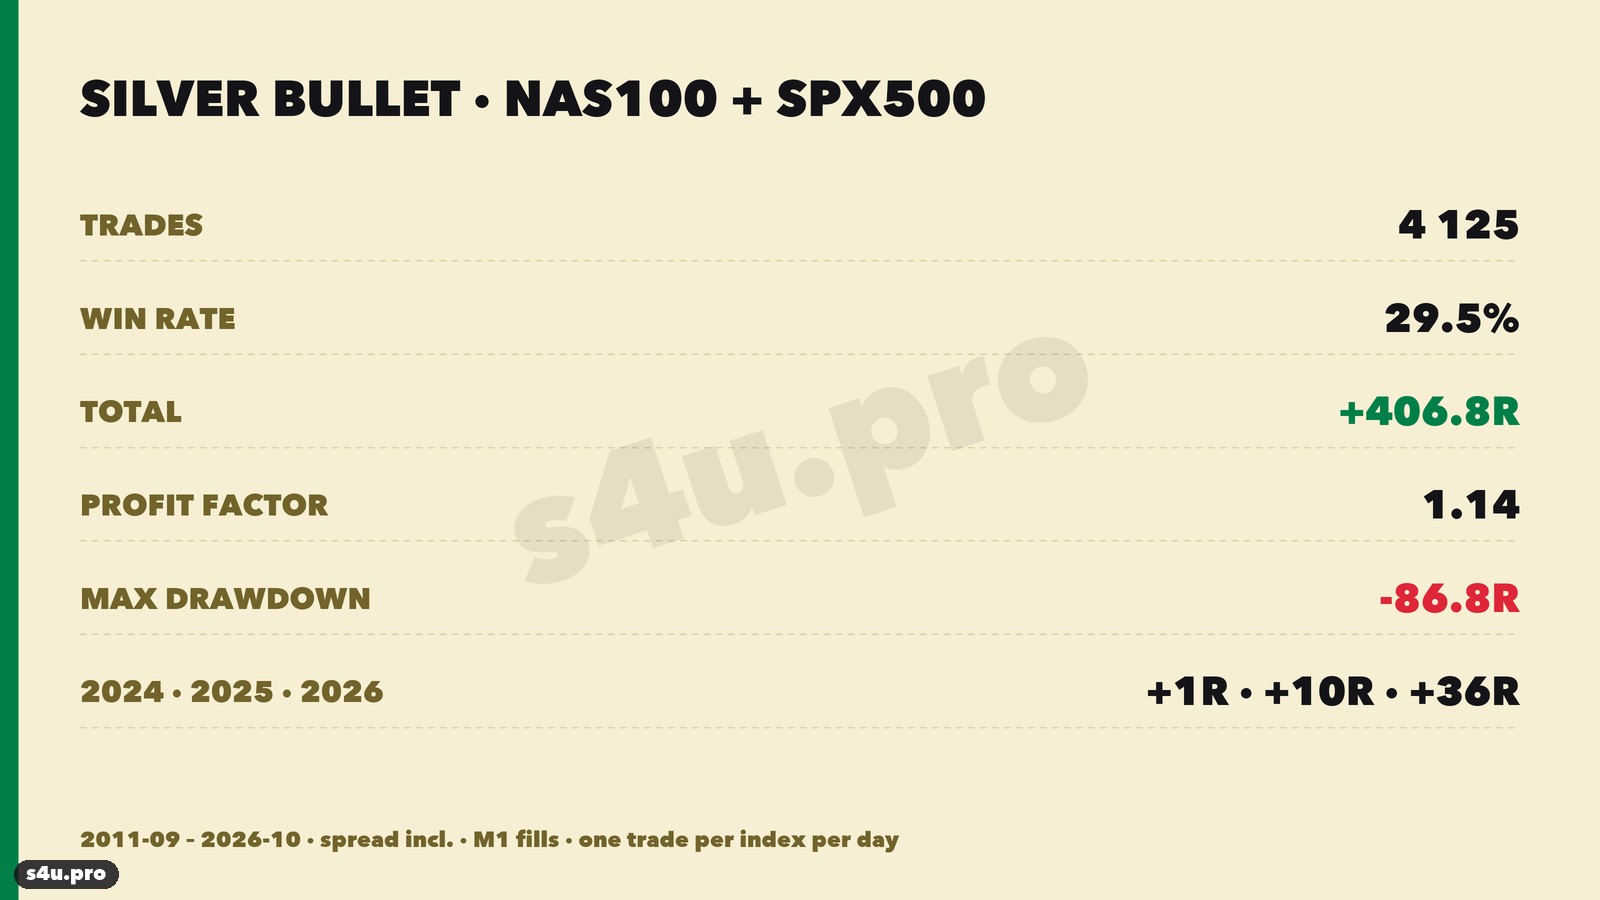
4,125 trades · 30% winners · +406.8R · +0.099R per trade · profit factor 1.14 · max drawdown −86.8R · up to 39 losses in a row · 14 of 16 years and both indices in profit · +295R with a 1.5× spread.
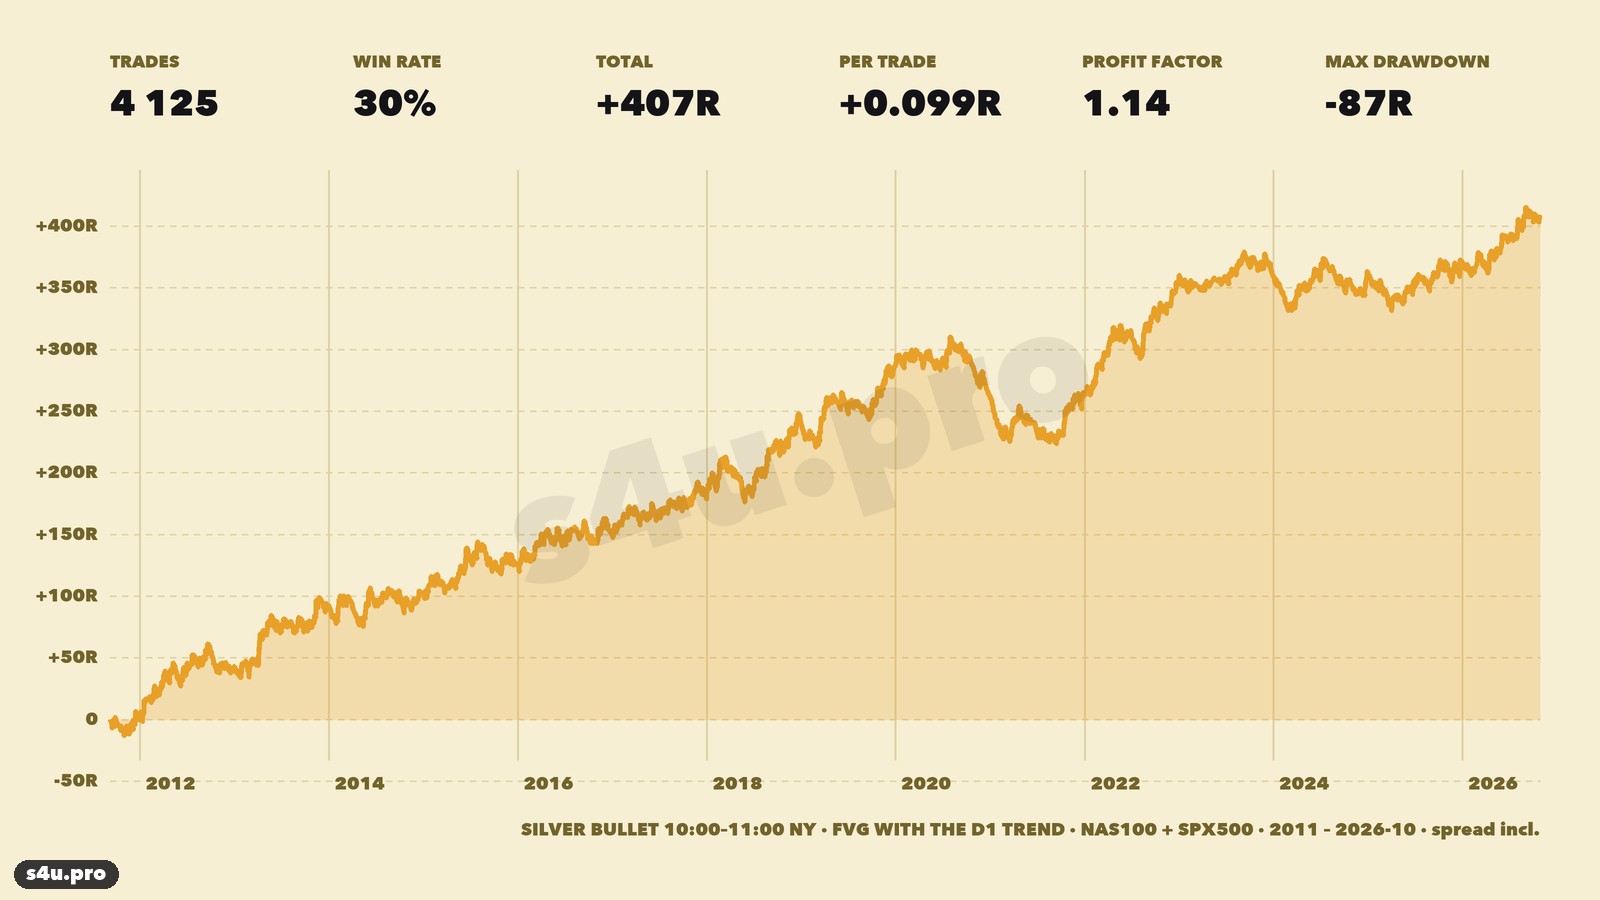
The curve rises steadily but not without dips: 2020 (the Covid crash and trend changes) made −26R, 2021 and 2024 were around zero. The best years were 2018 (+60R) and 2022 (+90R): when indices trend for a long time in one direction, the model earns the most.
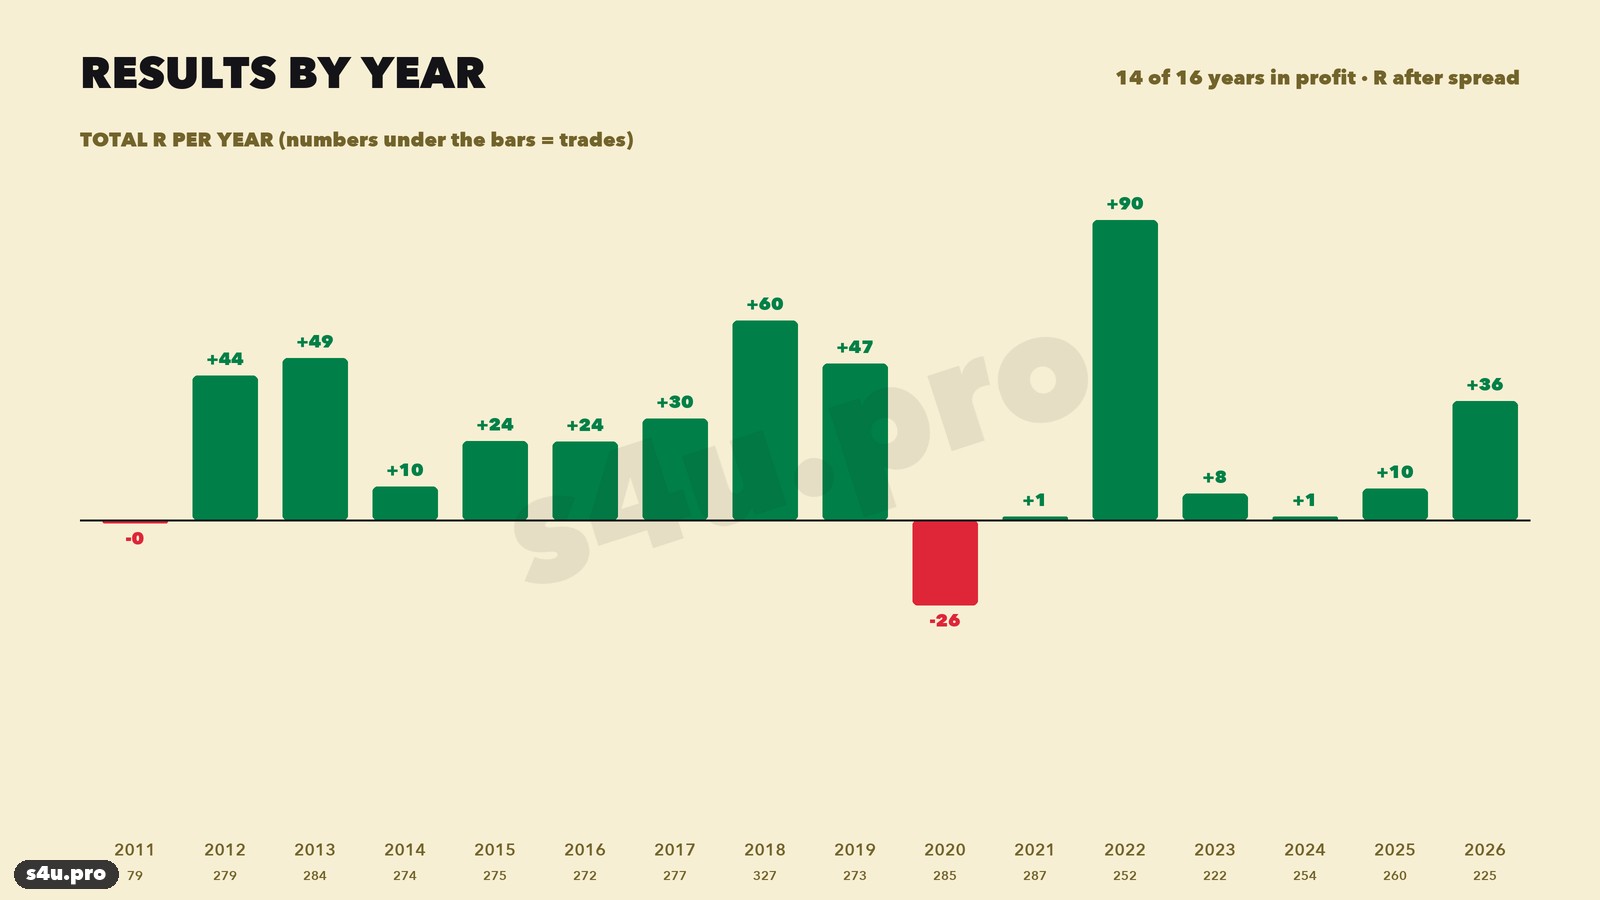
By market: NAS100 +261R, SPX500 +146R. The last two years: NAS100 2025 −7R and 2026 +16R, SPX500 2025 +16R and 2026 +20R.
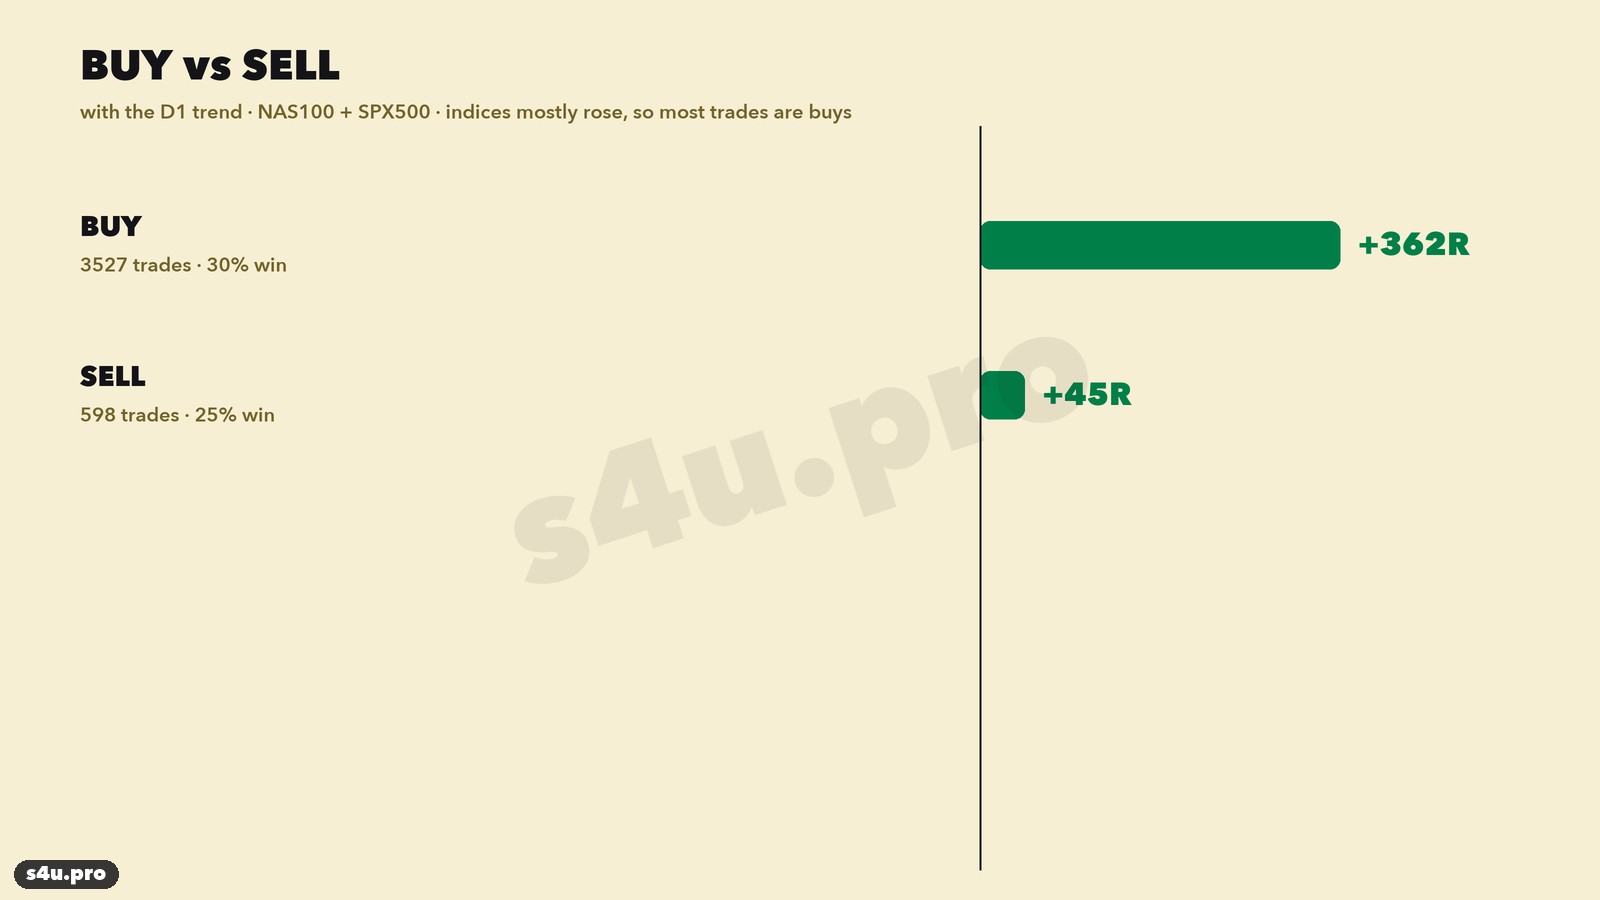
Buys made +362R on 3,527 trades, sells +45R on 598. There are six times more buys because the indices spent most of the time above the EMA200 — the trend filter honestly allows mostly long trades. Sells are positive too, if weakly.
Of 4,125 trades, 524 hit the target, 2,844 hit the stop and 757 were closed at 16:00. Time exits are a big part of the result: 91% of them closed in profit, together +1,155R. There are many stops because the stop is short; the profit comes from the trades that run far.
What changes the result:
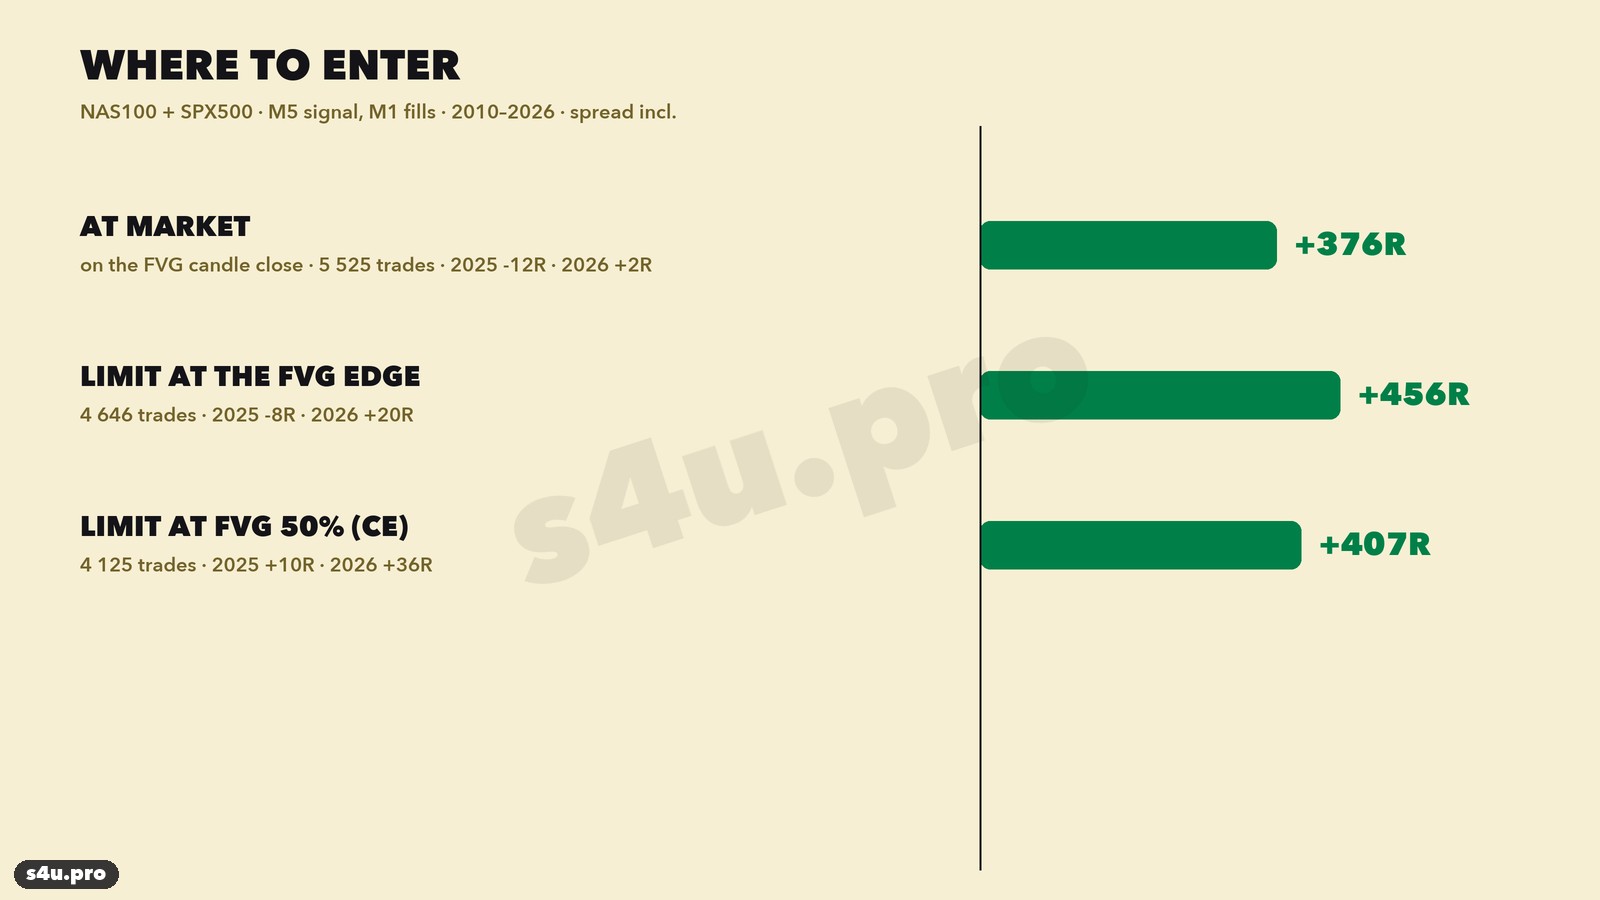
- At market on the FVG candle close — +376R, but 2025 −12R. Without the pullback the entry price is worse.
- Limit at the FVG edge — +457R overall, but 2025 −8R.
- Limit at the middle of the FVG (CE) — +407R, the only one of the three with both 2025 and 2026 in profit. That is why the rules use the CE.
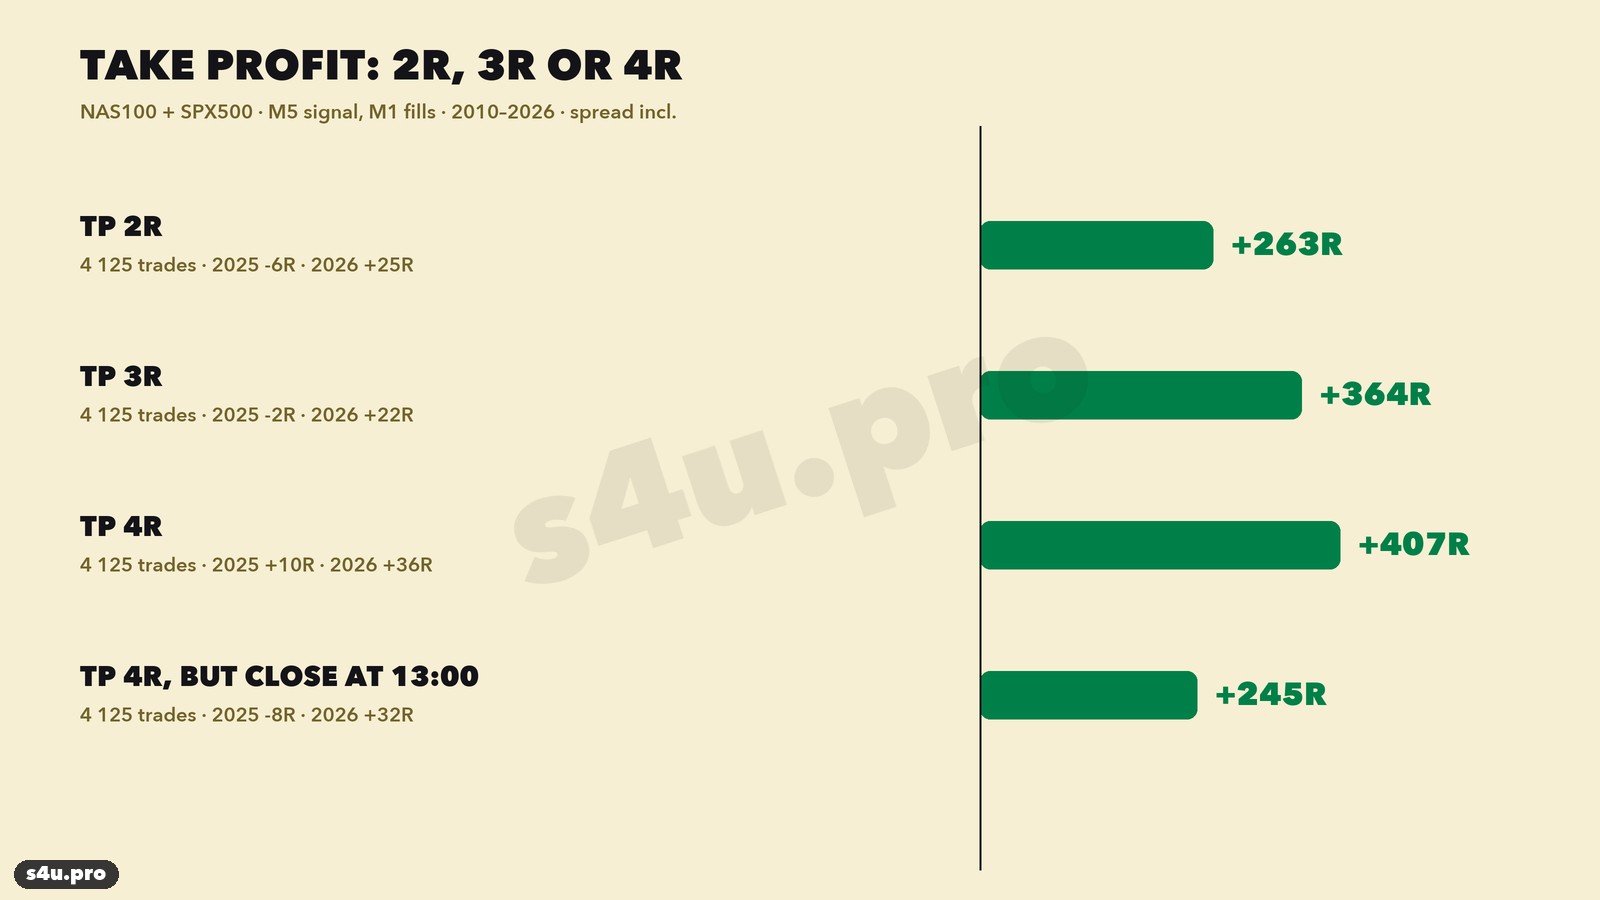
A 4R target beats 2R (+263R) and 3R (+364R). Closing earlier, at 13:00, is worse: +245R — the move of the day needs time.
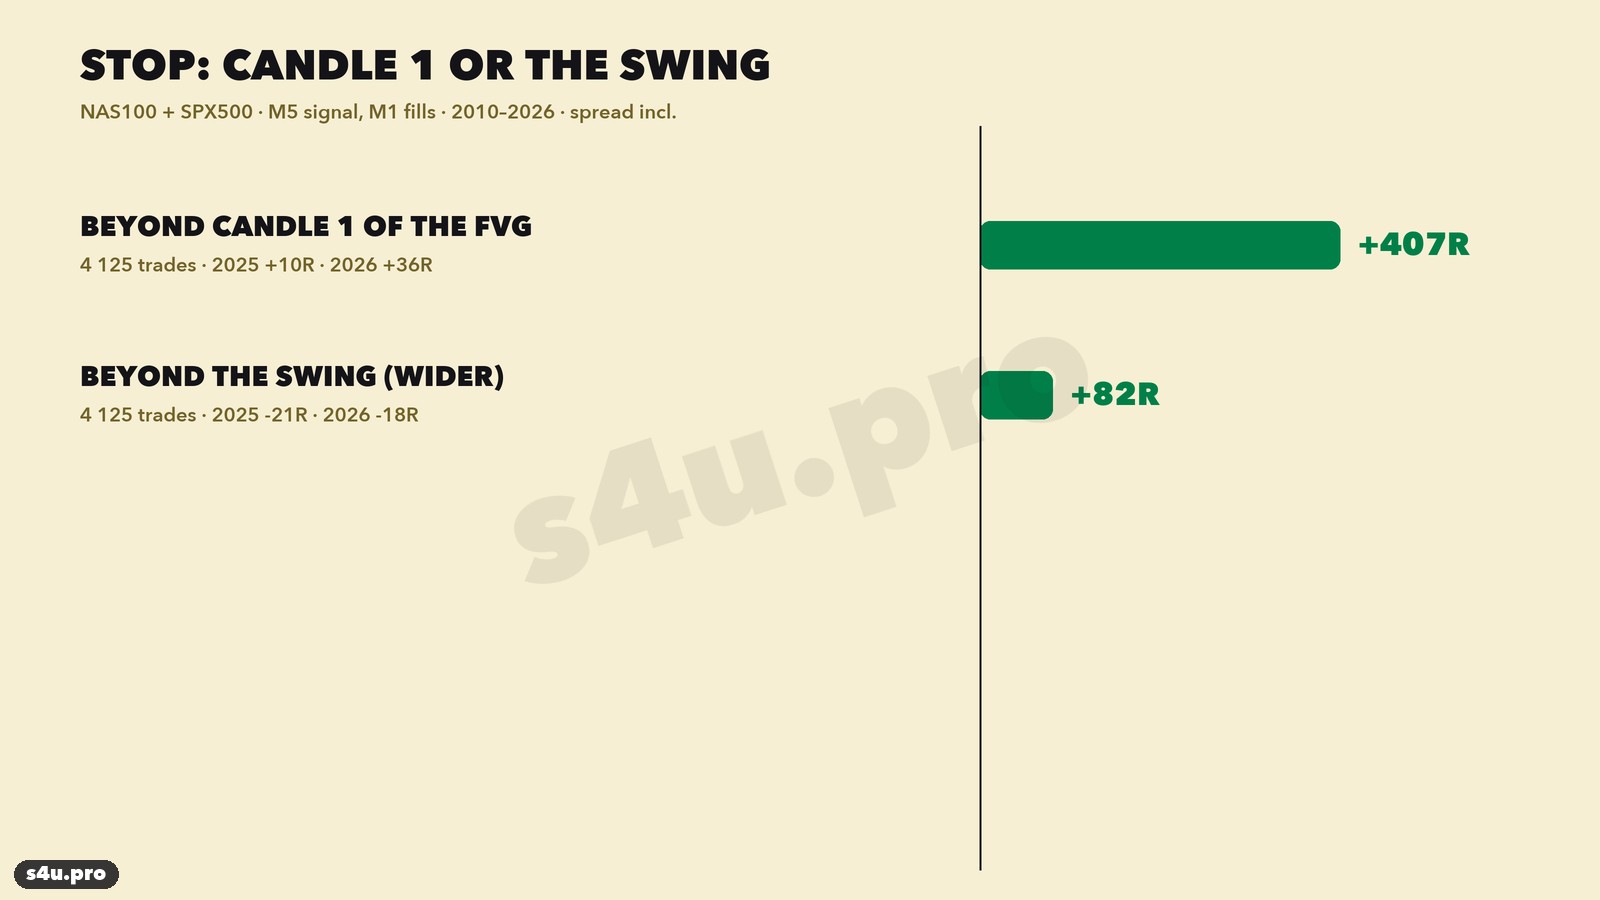
A stop beyond the whole swing (wider) makes only +82R: the stop is much wider and the 4R target is reached far less often.
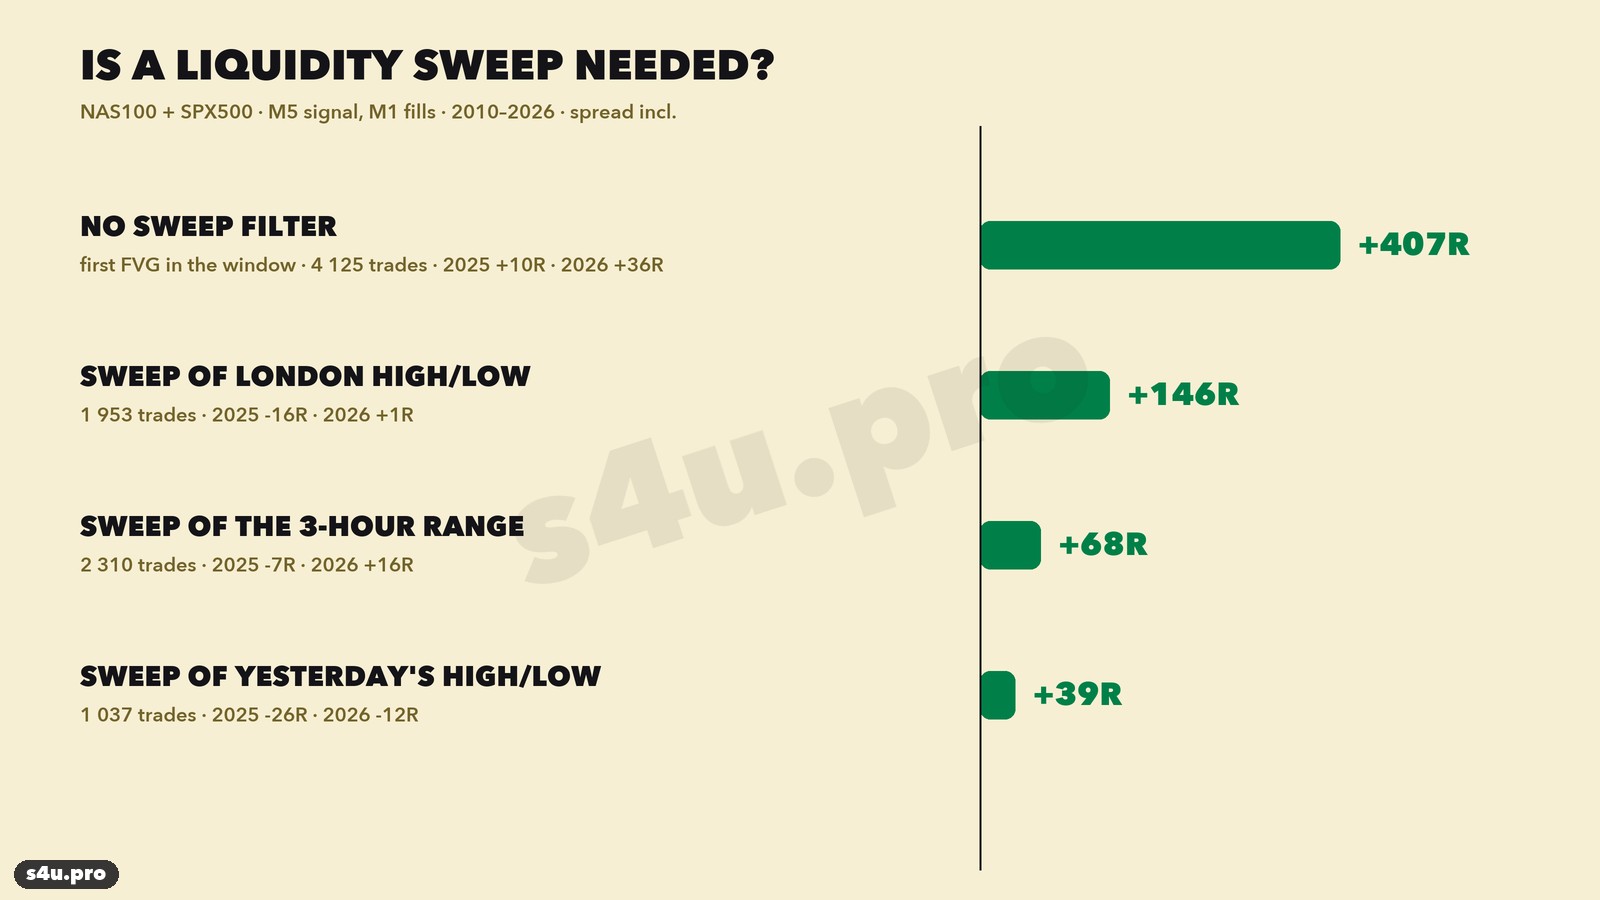
Many Silver Bullet descriptions require a liquidity sweep before the FVG. We tested three kinds: the London session high or low, yesterday’s high or low, and the range of the last three hours. Each filter cuts the number of trades 2–4 times and worsens the result: +146R, +39R and +68R versus +407R without a filter. On indices at 10:00–11:00 the trend matters more than the sweep.
In points the whole result is +4,425 NAS100 points and +807 SPX500 points. On average that is about +27R a year, i.e. roughly +7% a year at 0.25% risk per trade (without compounding).
Step-by-step trade examples
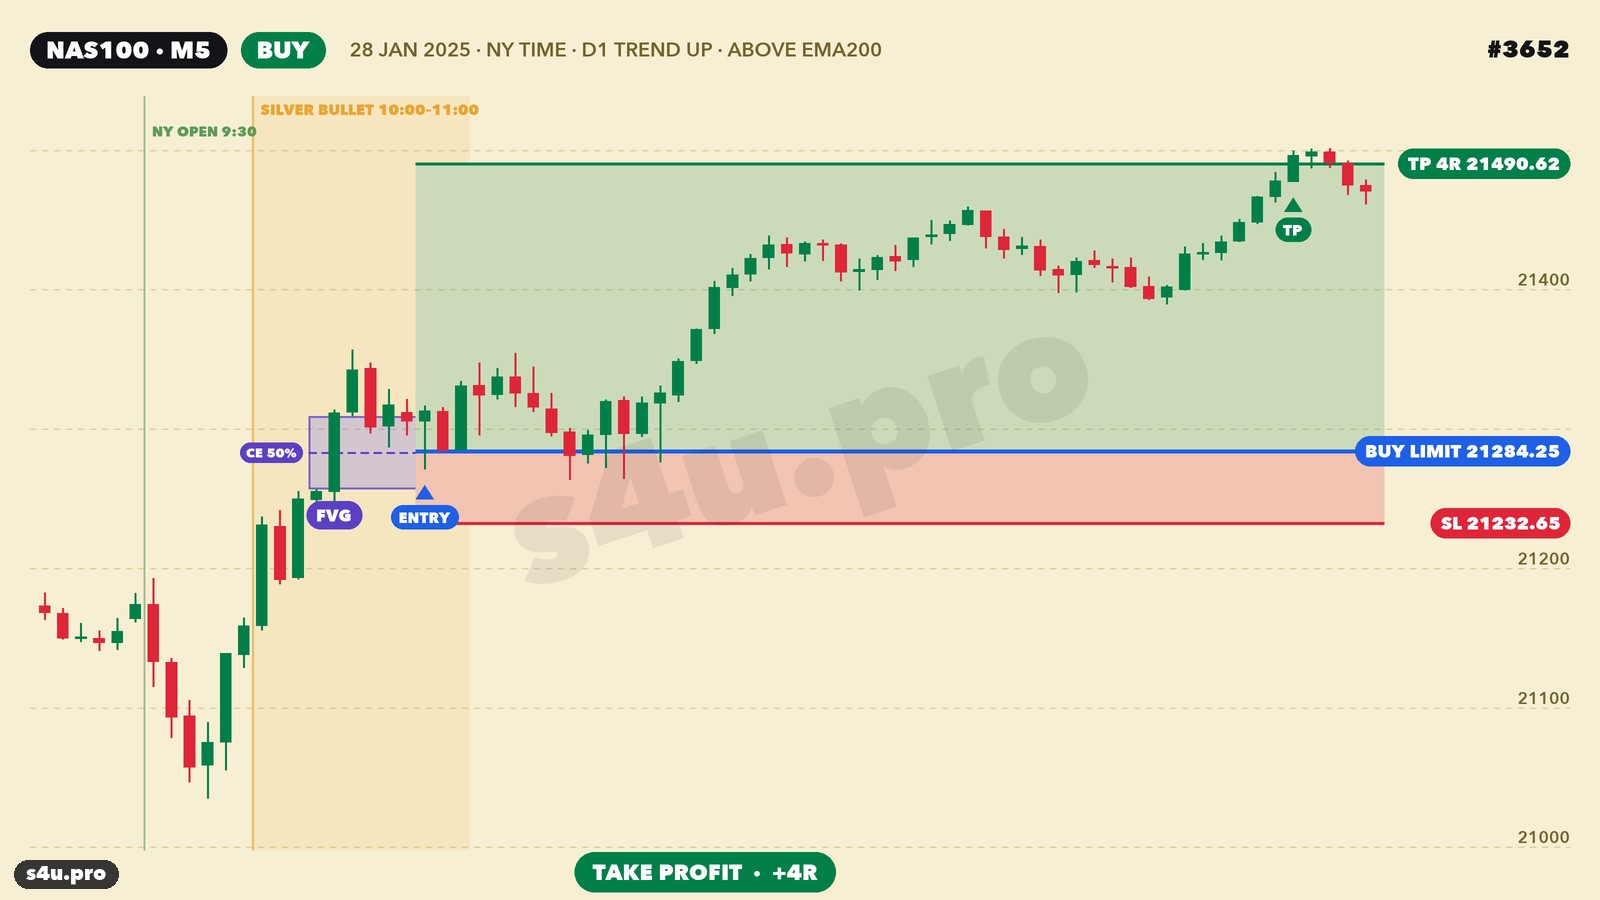
NAS100, 28 January 2025. Yesterday closed above the EMA200 — buys only. At 10:15–10:30 three candles left a bullish FVG. Price came back to its middle at 10:45 — buy limit at 21,284, stop below candle 1 (21,233, 52 points). By 14:47 price reached the 21,491 target: +4R.
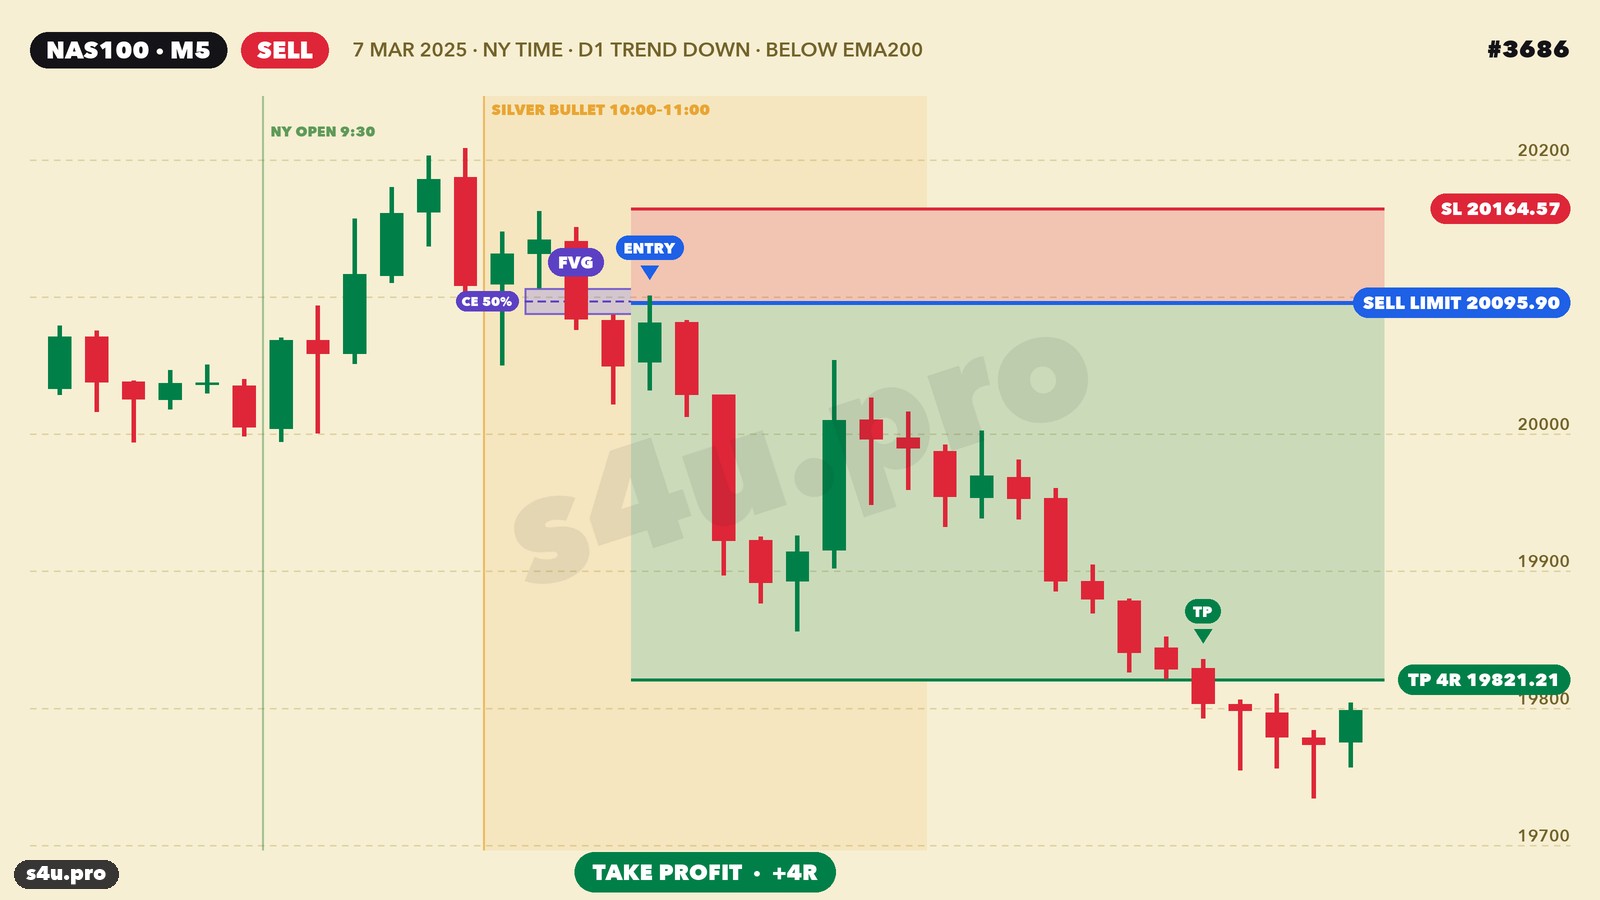
NAS100, 7 March 2025. The index is below the EMA200 — sells only. At 10:05–10:20 a bearish FVG appeared, at 10:24 price returned to its middle — sell limit at 20,096, stop 69 points above candle 1. A little over an hour later, at 11:37, the 19,821 target was hit: +4R.
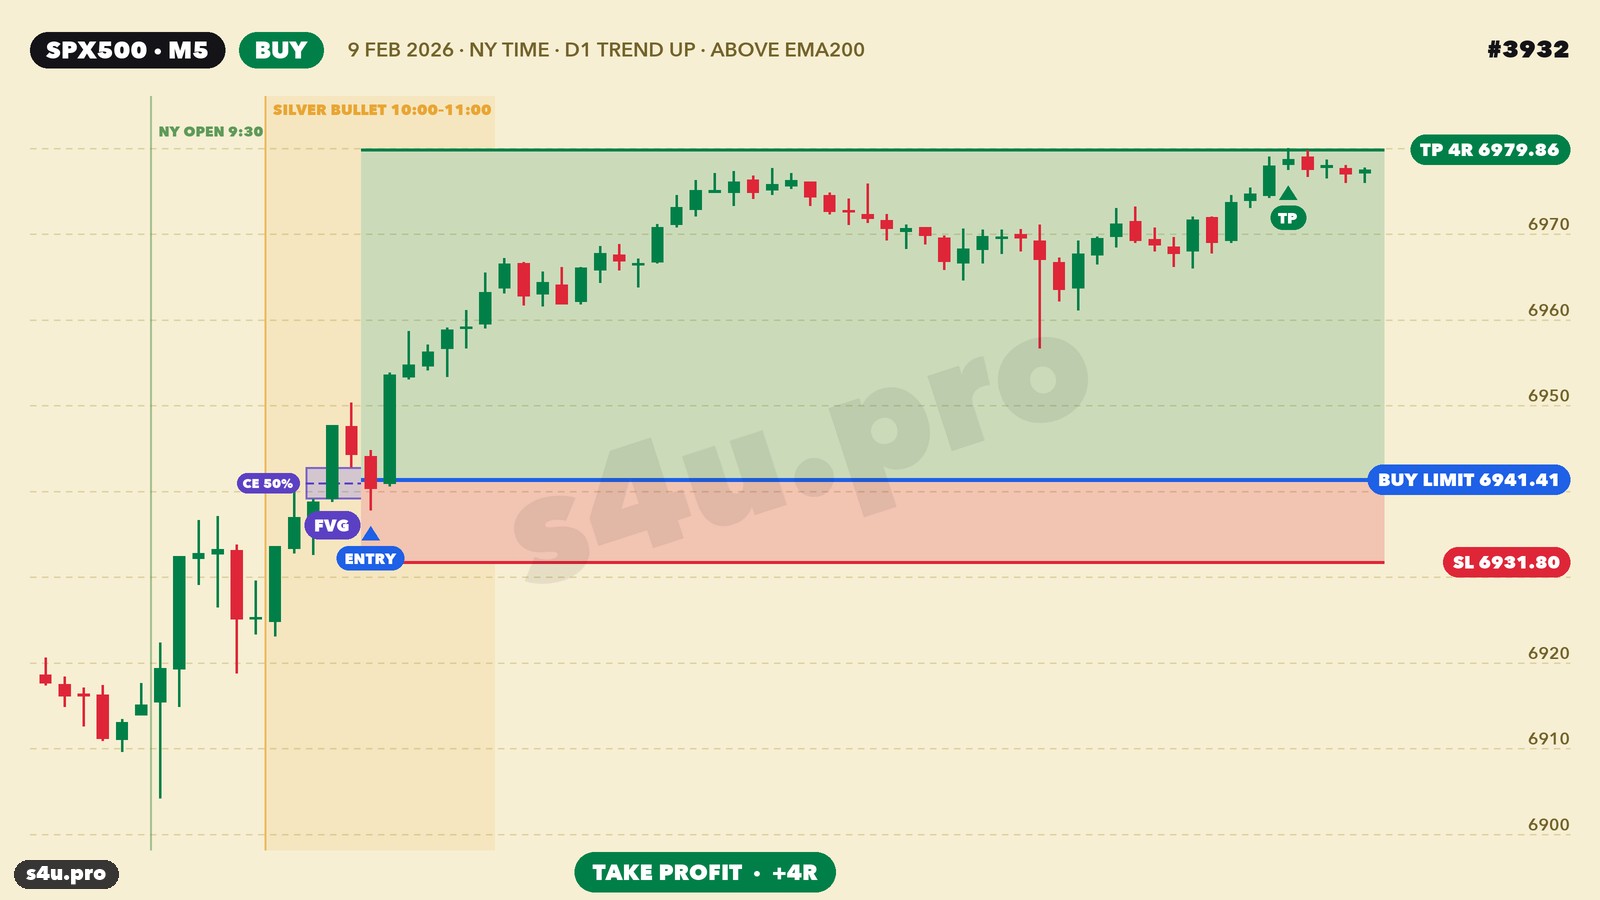
SPX500, 9 February 2026. Uptrend, a bullish FVG at 10:10–10:25, the limit at the middle filled straight away, at 10:26, at 6,941. Stop 9.6 points. The 6,980 target was hit at 14:29: +4R.
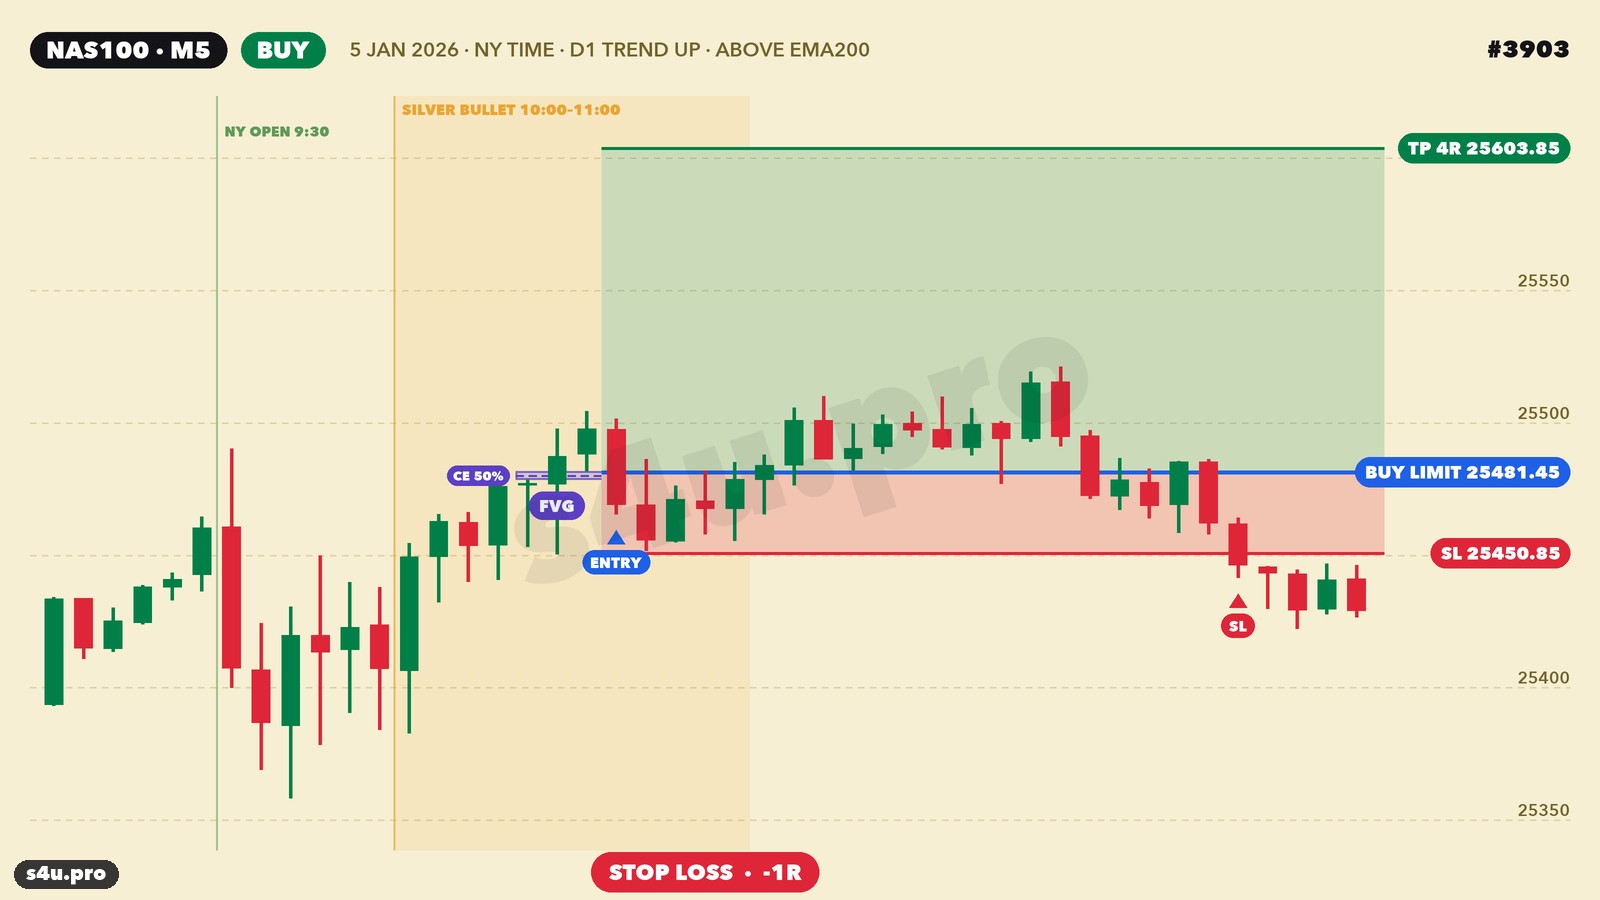
NAS100, 5 January 2026. Uptrend, an FVG at 10:20–10:35, entry at 10:36 at 25,481, stop 31 points. Price went sideways for an hour and a half and hit the stop at 12:23: −1R. 70% of trades look like this: the model makes money because the winners are on average much bigger than the losers.
Gallery: every trade of 2025–2026
All 485 trades of 2025–2026: 58 targets, 316 stops, 111 time exits, total +45.3R. Click a picture to open the chart.
| # | Market | Entry | Side | Entry price | Stop | Target | Exit | Result | Points | R | Chart |
|---|---|---|---|---|---|---|---|---|---|---|---|
| 4125 | SPX500 | 29.10.26 10:36 | BUY | 7725.15 | 7718.59 | 7751.37 | 7718.59 | SL | -6.6 | -1.00R | |
| 4124 | SPX500 | 27.10.26 10:30 | BUY | 7718.94 | 7709.91 | 7755.08 | 7723.96 | Time | +5.0 | +0.56R | |
| 4123 | NAS100 | 27.10.26 10:10 | BUY | 29556.56 | 29523.84 | 29687.43 | 29687.43 | TP | +130.9 | +4.00R | |
| 4122 | NAS100 | 26.10.26 10:09 | BUY | 29352.51 | 29302.48 | 29552.60 | 29302.48 | SL | -50.0 | -1.00R | |
| 4121 | SPX500 | 22.10.26 10:06 | BUY | 7691.20 | 7677.86 | 7744.57 | 7677.86 | SL | -13.3 | -1.00R | |
| 4120 | NAS100 | 22.10.26 10:06 | BUY | 29342.77 | 29256.21 | 29689.00 | 29256.21 | SL | -86.6 | -1.00R | |
| 4119 | SPX500 | 21.10.26 10:56 | BUY | 7731.68 | 7719.34 | 7781.03 | 7757.06 | Time | +25.4 | +2.06R | |
| 4118 | SPX500 | 20.10.26 10:36 | BUY | 7734.25 | 7721.14 | 7786.67 | 7721.14 | SL | -13.1 | -1.00R | |
| 4117 | SPX500 | 19.10.26 10:32 | BUY | 7701.57 | 7687.16 | 7759.19 | 7691.60 | Time | -10.0 | -0.69R | |
| 4116 | NAS100 | 19.10.26 10:30 | BUY | 29622.07 | 29496.86 | 30122.93 | 29527.07 | Time | -95.0 | -0.76R | |
| 4115 | SPX500 | 16.10.26 10:53 | BUY | 7741.64 | 7731.84 | 7780.84 | 7731.84 | SL | -9.8 | -1.00R | |
| 4114 | NAS100 | 16.10.26 10:53 | BUY | 29665.19 | 29593.36 | 29952.54 | 29593.36 | SL | -71.8 | -1.00R | |
| 4113 | SPX500 | 15.10.26 10:50 | BUY | 7709.93 | 7695.21 | 7768.81 | 7743.21 | Time | +33.3 | +2.26R | |
| 4112 | NAS100 | 13.10.26 10:45 | BUY | 30538.89 | 30508.87 | 30658.97 | 30508.87 | SL | -30.0 | -1.00R | |
| 4111 | NAS100 | 09.10.26 10:37 | BUY | 30827.08 | 30794.50 | 30957.39 | 30794.50 | SL | -32.6 | -1.00R | |
| 4110 | SPX500 | 08.10.26 10:50 | BUY | 7783.89 | 7777.50 | 7809.46 | 7777.50 | SL | -6.4 | -1.00R | |
| 4109 | NAS100 | 08.10.26 10:39 | BUY | 31084.34 | 31033.77 | 31286.64 | 31033.77 | SL | -50.6 | -1.00R | |
| 4108 | NAS100 | 07.10.26 10:50 | BUY | 30989.84 | 30953.31 | 31135.97 | 31135.97 | TP | +146.1 | +4.00R | |
| 4107 | SPX500 | 07.10.26 10:27 | BUY | 7772.90 | 7766.58 | 7798.18 | 7766.58 | SL | -6.3 | -1.00R | |
| 4106 | NAS100 | 06.10.26 10:25 | BUY | 31275.13 | 31248.75 | 31380.69 | 31248.75 | SL | -26.4 | -1.00R | |
| 4105 | SPX500 | 06.10.26 10:19 | BUY | 7825.40 | 7818.48 | 7853.08 | 7818.48 | SL | -6.9 | -1.00R | |
| 4104 | SPX500 | 05.10.26 10:30 | BUY | 7751.78 | 7742.73 | 7787.96 | 7787.96 | TP | +36.2 | +4.00R | |
| 4103 | NAS100 | 05.10.26 10:30 | BUY | 30969.62 | 30920.64 | 31165.52 | 31074.76 | Time | +105.1 | +2.15R | |
| 4102 | SPX500 | 02.10.26 10:11 | BUY | 7737.48 | 7717.53 | 7817.30 | 7717.53 | SL | -20.0 | -1.00R | |
| 4101 | NAS100 | 02.10.26 10:11 | BUY | 30943.35 | 30843.77 | 31341.67 | 30843.77 | SL | -99.6 | -1.00R | |
| 4100 | NAS100 | 01.10.26 10:51 | BUY | 30385.94 | 30323.55 | 30635.50 | 30323.55 | SL | -62.4 | -1.00R | |
| 4099 | SPX500 | 01.10.26 10:47 | BUY | 7638.58 | 7626.45 | 7687.11 | 7626.45 | SL | -12.1 | -1.00R | |
| 4098 | SPX500 | 30.09.26 10:10 | BUY | 7711.43 | 7698.17 | 7764.46 | 7698.17 | SL | -13.3 | -1.00R | |
| 4097 | NAS100 | 30.09.26 10:10 | BUY | 30571.91 | 30501.15 | 30854.94 | 30501.15 | SL | -70.8 | -1.00R | |
| 4096 | SPX500 | 24.09.26 10:15 | BUY | 7686.53 | 7675.39 | 7731.11 | 7675.39 | SL | -11.1 | -1.00R | |
| 4095 | NAS100 | 24.09.26 10:10 | BUY | 30298.88 | 30238.77 | 30539.33 | 30238.77 | SL | -60.1 | -1.00R | |
| 4094 | NAS100 | 22.09.26 10:21 | BUY | 30637.82 | 30606.16 | 30764.50 | 30606.16 | SL | -31.7 | -1.00R | |
| 4093 | NAS100 | 21.09.26 10:41 | BUY | 30225.02 | 30193.29 | 30351.96 | 30351.96 | TP | +126.9 | +4.00R | |
| 4092 | NAS100 | 17.09.26 10:47 | BUY | 29385.04 | 29330.97 | 29601.32 | 29424.43 | Time | +39.4 | +0.73R | |
| 4091 | SPX500 | 17.09.26 10:32 | BUY | 7626.84 | 7620.35 | 7652.81 | 7620.35 | SL | -6.5 | -1.00R | |
| 4090 | SPX500 | 14.09.26 10:16 | BUY | 7616.58 | 7610.07 | 7642.64 | 7610.07 | SL | -6.5 | -1.00R | |
| 4089 | NAS100 | 14.09.26 10:16 | BUY | 29039.79 | 28984.33 | 29261.64 | 28984.33 | SL | -55.5 | -1.00R | |
| 4088 | NAS100 | 11.09.26 10:31 | BUY | 29407.56 | 29353.50 | 29623.79 | 29353.50 | SL | -54.1 | -1.00R | |
| 4087 | SPX500 | 11.09.26 10:05 | BUY | 7667.20 | 7659.83 | 7696.68 | 7659.83 | SL | -7.4 | -1.00R | |
| 4086 | SPX500 | 09.09.26 10:37 | BUY | 7647.78 | 7638.23 | 7685.98 | 7638.23 | SL | -9.5 | -1.00R | |
| 4085 | NAS100 | 09.09.26 10:16 | BUY | 29502.53 | 29454.66 | 29694.00 | 29454.66 | SL | -47.9 | -1.00R | |
| 4084 | NAS100 | 07.09.26 10:56 | BUY | 29580.36 | 29565.27 | 29640.69 | 29565.27 | SL | -15.1 | -1.00R | |
| 4083 | NAS100 | 03.09.26 10:32 | BUY | 29272.88 | 29203.33 | 29551.07 | 29484.50 | Time | +211.6 | +3.04R | |
| 4082 | SPX500 | 03.09.26 10:31 | BUY | 7700.89 | 7690.32 | 7743.15 | 7743.15 | TP | +42.3 | +4.00R | |
| 4081 | NAS100 | 02.09.26 10:53 | BUY | 29094.34 | 29040.36 | 29310.27 | 29142.85 | Time | +48.5 | +0.90R | |
| 4080 | SPX500 | 02.09.26 10:33 | BUY | 7667.25 | 7656.38 | 7710.74 | 7667.26 | Time | +0.0 | +0.00R | |
| 4079 | NAS100 | 01.09.26 10:52 | BUY | 29174.11 | 29146.34 | 29285.19 | 29146.34 | SL | -27.8 | -1.00R | |
| 4078 | SPX500 | 01.09.26 10:42 | BUY | 7656.99 | 7651.46 | 7679.12 | 7651.46 | SL | -5.5 | -1.00R | |
| 4077 | NAS100 | 31.08.26 10:49 | BUY | 29343.62 | 29308.16 | 29485.44 | 29485.44 | TP | +141.8 | +4.00R | |
| 4076 | SPX500 | 27.08.26 10:55 | BUY | 7716.00 | 7709.96 | 7740.18 | 7740.18 | TP | +24.2 | +4.00R | |
| 4075 | NAS100 | 27.08.26 10:39 | BUY | 29494.97 | 29435.19 | 29734.10 | 29634.03 | Time | +139.1 | +2.33R | |
| 4074 | NAS100 | 26.08.26 10:45 | BUY | 29143.32 | 29107.48 | 29286.68 | 29107.48 | SL | -35.8 | -1.00R | |
| 4073 | SPX500 | 21.08.26 10:13 | BUY | 7666.49 | 7659.20 | 7695.65 | 7695.65 | TP | +29.2 | +4.00R | |
| 4072 | NAS100 | 20.08.26 10:48 | BUY | 29304.41 | 29246.86 | 29534.59 | 29246.86 | SL | -57.5 | -1.00R | |
| 4071 | NAS100 | 18.08.26 10:42 | BUY | 29550.43 | 29487.04 | 29804.01 | 29487.04 | SL | -63.4 | -1.00R | |
| 4070 | SPX500 | 13.08.26 10:42 | BUY | 7811.30 | 7802.27 | 7847.40 | 7802.27 | SL | -9.0 | -1.00R | |
| 4069 | NAS100 | 13.08.26 10:20 | BUY | 30088.63 | 30052.43 | 30233.39 | 30052.43 | SL | -36.2 | -1.00R | |
| 4068 | SPX500 | 11.08.26 10:38 | BUY | 7756.02 | 7747.43 | 7790.37 | 7747.43 | SL | -8.6 | -1.00R | |
| 4067 | NAS100 | 11.08.26 10:18 | BUY | 29634.02 | 29543.55 | 29995.89 | 29543.55 | SL | -90.5 | -1.00R | |
| 4066 | SPX500 | 10.08.26 10:24 | BUY | 7761.84 | 7755.68 | 7786.46 | 7755.68 | SL | -6.2 | -1.00R | |
| 4065 | NAS100 | 10.08.26 10:23 | BUY | 29741.16 | 29674.59 | 30007.47 | 29674.59 | SL | -66.6 | -1.00R | |
| 4064 | NAS100 | 07.08.26 10:39 | BUY | 29559.64 | 29451.57 | 29991.91 | 29713.82 | Time | +154.2 | +1.43R | |
| 4063 | SPX500 | 07.08.26 10:35 | BUY | 7746.72 | 7736.82 | 7786.35 | 7736.82 | SL | -9.9 | -1.00R | |
| 4062 | NAS100 | 06.08.26 10:25 | BUY | 29509.05 | 29458.10 | 29712.82 | 29458.10 | SL | -50.9 | -1.00R | |
| 4061 | SPX500 | 06.08.26 10:15 | BUY | 7737.86 | 7728.93 | 7773.58 | 7728.93 | SL | -8.9 | -1.00R | |
| 4060 | SPX500 | 04.08.26 10:21 | BUY | 7671.75 | 7661.78 | 7711.61 | 7711.61 | TP | +39.9 | +4.00R | |
| 4059 | NAS100 | 04.08.26 10:19 | BUY | 29377.81 | 29305.11 | 29668.58 | 29668.58 | TP | +290.8 | +4.00R | |
| 4058 | SPX500 | 03.08.26 10:45 | BUY | 7571.95 | 7566.70 | 7592.94 | 7592.94 | TP | +21.0 | +4.00R | |
| 4057 | NAS100 | 03.08.26 10:08 | BUY | 28407.74 | 28332.44 | 28708.90 | 28708.90 | TP | +301.2 | +4.00R | |
| 4056 | SPX500 | 31.07.26 10:55 | BUY | 7442.36 | 7428.22 | 7498.93 | 7428.22 | SL | -14.1 | -1.00R | |
| 4055 | NAS100 | 30.07.26 10:07 | BUY | 27990.64 | 27903.18 | 28340.48 | 27903.18 | SL | -87.5 | -1.00R | |
| 4054 | SPX500 | 28.07.26 10:58 | BUY | 7411.90 | 7395.73 | 7476.55 | 7430.91 | Time | +19.0 | +1.18R | |
| 4053 | NAS100 | 28.07.26 10:57 | BUY | 27673.48 | 27563.62 | 28112.94 | 27762.50 | Time | +89.0 | +0.81R | |
| 4052 | SPX500 | 24.07.26 10:17 | BUY | 7411.09 | 7395.59 | 7473.08 | 7411.30 | Time | +0.2 | +0.01R | |
| 4051 | SPX500 | 22.07.26 10:13 | BUY | 7509.10 | 7497.96 | 7553.66 | 7497.96 | SL | -11.1 | -1.00R | |
| 4050 | NAS100 | 22.07.26 10:07 | BUY | 29072.50 | 28982.67 | 29431.84 | 28995.82 | Time | -76.7 | -0.85R | |
| 4049 | SPX500 | 21.07.26 10:38 | BUY | 7489.43 | 7478.72 | 7532.27 | 7508.01 | Time | +18.6 | +1.74R | |
| 4048 | NAS100 | 21.07.26 10:38 | BUY | 29016.57 | 28935.95 | 29339.07 | 29135.64 | Time | +119.1 | +1.48R | |
| 4047 | SPX500 | 17.07.26 10:32 | BUY | 7483.35 | 7469.82 | 7537.46 | 7469.82 | SL | -13.5 | -1.00R | |
| 4046 | NAS100 | 17.07.26 10:15 | BUY | 28607.50 | 28488.17 | 29084.80 | 28582.99 | Time | -24.5 | -0.20R | |
| 4045 | SPX500 | 16.07.26 10:39 | BUY | 7565.80 | 7555.54 | 7606.84 | 7555.54 | SL | -10.3 | -1.00R | |
| 4044 | NAS100 | 16.07.26 10:21 | BUY | 29240.16 | 29125.15 | 29700.19 | 29125.15 | SL | -115.0 | -1.00R | |
| 4043 | SPX500 | 15.07.26 10:21 | BUY | 7572.33 | 7563.96 | 7605.82 | 7563.96 | SL | -8.4 | -1.00R | |
| 4042 | NAS100 | 15.07.26 10:14 | BUY | 29613.03 | 29551.86 | 29857.72 | 29551.86 | SL | -61.2 | -1.00R | |
| 4041 | SPX500 | 14.07.26 10:43 | BUY | 7540.55 | 7524.85 | 7603.34 | 7544.79 | Time | +4.2 | +0.27R | |
| 4040 | NAS100 | 14.07.26 10:43 | BUY | 29539.09 | 29440.85 | 29932.07 | 29584.27 | Time | +45.2 | +0.46R | |
| 4039 | NAS100 | 13.07.26 10:36 | BUY | 29473.41 | 29361.04 | 29922.92 | 29361.04 | SL | -112.4 | -1.00R | |
| 4038 | SPX500 | 06.07.26 10:38 | BUY | 7523.01 | 7516.40 | 7549.43 | 7549.43 | TP | +26.4 | +4.00R | |
| 4037 | SPX500 | 03.07.26 10:06 | BUY | 7503.45 | 7499.34 | 7519.89 | 7507.79 | Time | +4.3 | +1.06R | |
| 4036 | SPX500 | 01.07.26 10:30 | BUY | 7491.25 | 7479.84 | 7536.90 | 7479.84 | SL | -11.4 | -1.00R | |
| 4035 | SPX500 | 30.06.26 10:47 | BUY | 7467.91 | 7459.88 | 7500.02 | 7459.88 | SL | -8.0 | -1.00R | |
| 4034 | NAS100 | 30.06.26 10:42 | BUY | 30109.25 | 30054.92 | 30326.56 | 30054.92 | SL | -54.3 | -1.00R | |
| 4033 | SPX500 | 29.06.26 10:46 | BUY | 7392.84 | 7366.06 | 7500.00 | 7436.10 | Time | +43.3 | +1.61R | |
| 4032 | NAS100 | 29.06.26 10:46 | BUY | 29271.42 | 29108.71 | 29922.24 | 29763.40 | Time | +492.0 | +3.02R | |
| 4031 | NAS100 | 26.06.26 10:39 | BUY | 29193.15 | 29007.50 | 29935.75 | 29084.39 | Time | -108.8 | -0.59R | |
| 4030 | SPX500 | 26.06.26 10:37 | BUY | 7352.69 | 7334.27 | 7426.40 | 7334.27 | SL | -18.4 | -1.00R | |
| 4029 | SPX500 | 25.06.26 10:16 | BUY | 7365.73 | 7323.77 | 7533.58 | 7361.11 | Time | -4.6 | -0.11R | |
| 4028 | NAS100 | 24.06.26 10:55 | BUY | 29497.35 | 29402.65 | 29876.18 | 29402.65 | SL | -94.7 | -1.00R | |
| 4027 | SPX500 | 23.06.26 10:39 | BUY | 7404.39 | 7389.21 | 7465.12 | 7389.21 | SL | -15.2 | -1.00R | |
| 4026 | NAS100 | 23.06.26 10:32 | BUY | 29624.05 | 29505.21 | 30099.42 | 29505.21 | SL | -118.8 | -1.00R | |
| 4025 | NAS100 | 18.06.26 10:30 | BUY | 30186.69 | 30091.14 | 30568.88 | 30381.94 | Time | +195.3 | +2.04R | |
| 4024 | SPX500 | 17.06.26 10:31 | BUY | 7521.70 | 7509.50 | 7570.54 | 7509.50 | SL | -12.2 | -1.00R | |
| 4023 | NAS100 | 17.06.26 10:30 | BUY | 30158.80 | 30100.63 | 30391.49 | 30100.63 | SL | -58.2 | -1.00R | |
| 4022 | SPX500 | 16.06.26 10:45 | BUY | 7542.57 | 7532.05 | 7584.67 | 7532.05 | SL | -10.5 | -1.00R | |
| 4021 | SPX500 | 12.06.26 10:46 | BUY | 7390.94 | 7369.74 | 7475.74 | 7428.20 | Time | +37.3 | +1.76R | |
| 4020 | NAS100 | 12.06.26 10:23 | BUY | 29489.31 | 29322.06 | 30158.31 | 29623.67 | Time | +134.4 | +0.80R | |
| 4019 | NAS100 | 08.06.26 10:42 | BUY | 29490.51 | 29407.78 | 29821.44 | 29407.78 | SL | -82.7 | -1.00R | |
| 4018 | NAS100 | 05.06.26 10:26 | BUY | 29775.90 | 29735.06 | 29939.26 | 29735.06 | SL | -40.8 | -1.00R | |
| 4017 | SPX500 | 05.06.26 10:22 | BUY | 7513.94 | 7497.73 | 7578.76 | 7497.73 | SL | -16.2 | -1.00R | |
| 4016 | NAS100 | 04.06.26 10:31 | BUY | 30248.54 | 30200.39 | 30441.14 | 30441.14 | TP | +192.6 | +4.00R | |
| 4015 | SPX500 | 04.06.26 10:30 | BUY | 7553.45 | 7545.93 | 7583.51 | 7583.51 | TP | +30.1 | +4.00R | |
| 4014 | NAS100 | 03.06.26 10:50 | BUY | 30617.99 | 30548.84 | 30894.60 | 30548.84 | SL | -69.2 | -1.00R | |
| 4013 | NAS100 | 02.06.26 10:41 | BUY | 30530.34 | 30481.34 | 30726.34 | 30654.07 | Time | +123.7 | +2.52R | |
| 4012 | SPX500 | 02.06.26 10:22 | BUY | 7596.00 | 7591.13 | 7615.48 | 7615.48 | TP | +19.5 | +4.00R | |
| 4011 | NAS100 | 28.05.26 10:22 | BUY | 30016.59 | 29899.62 | 30484.48 | 30221.87 | Time | +205.3 | +1.75R | |
| 4010 | NAS100 | 27.05.26 10:56 | BUY | 29887.14 | 29820.75 | 30152.70 | 29820.75 | SL | -66.4 | -1.00R | |
| 4009 | NAS100 | 26.05.26 10:47 | BUY | 30013.95 | 29982.67 | 30139.06 | 29982.67 | SL | -31.3 | -1.00R | |
| 4008 | SPX500 | 22.05.26 10:47 | BUY | 7475.79 | 7465.24 | 7517.95 | 7472.50 | Time | -3.3 | -0.31R | |
| 4007 | SPX500 | 15.05.26 10:25 | BUY | 7434.58 | 7414.66 | 7514.28 | 7414.66 | SL | -19.9 | -1.00R | |
| 4006 | NAS100 | 15.05.26 10:25 | BUY | 29220.76 | 29096.58 | 29717.48 | 29131.12 | Time | -89.6 | -0.72R | |
| 4005 | NAS100 | 14.05.26 10:27 | BUY | 29502.54 | 29427.81 | 29801.47 | 29580.27 | Time | +77.7 | +1.04R | |
| 4004 | SPX500 | 14.05.26 10:25 | BUY | 7479.22 | 7468.54 | 7521.96 | 7502.69 | Time | +23.5 | +2.20R | |
| 4003 | SPX500 | 13.05.26 10:39 | BUY | 7401.14 | 7391.47 | 7439.82 | 7439.82 | TP | +38.7 | +4.00R | |
| 4002 | NAS100 | 12.05.26 10:25 | BUY | 29054.37 | 28995.12 | 29291.36 | 28995.12 | SL | -59.2 | -1.00R | |
| 4001 | SPX500 | 12.05.26 10:21 | BUY | 7378.94 | 7370.41 | 7413.03 | 7370.41 | SL | -8.5 | -1.00R | |
| 4000 | SPX500 | 11.05.26 10:27 | BUY | 7411.31 | 7405.56 | 7434.31 | 7405.56 | SL | -5.8 | -1.00R | |
| 3999 | NAS100 | 11.05.26 10:27 | BUY | 29237.57 | 29190.59 | 29425.47 | 29190.59 | SL | -47.0 | -1.00R | |
| 3998 | NAS100 | 08.05.26 10:11 | BUY | 28975.01 | 28926.07 | 29170.75 | 29170.75 | TP | +195.7 | +4.00R | |
| 3997 | NAS100 | 07.05.26 10:48 | BUY | 28769.80 | 28741.25 | 28883.98 | 28741.25 | SL | -28.5 | -1.00R | |
| 3996 | SPX500 | 07.05.26 10:15 | BUY | 7366.66 | 7359.15 | 7396.68 | 7359.15 | SL | -7.5 | -1.00R | |
| 3995 | NAS100 | 06.05.26 10:59 | BUY | 28407.95 | 28376.72 | 28532.85 | 28532.85 | TP | +124.9 | +4.00R | |
| 3994 | NAS100 | 05.05.26 10:39 | BUY | 27977.71 | 27910.20 | 28247.75 | 28012.36 | Time | +34.6 | +0.51R | |
| 3993 | SPX500 | 05.05.26 10:13 | BUY | 7248.78 | 7244.18 | 7267.20 | 7244.18 | SL | -4.6 | -1.00R | |
| 3992 | NAS100 | 04.05.26 10:56 | BUY | 27799.79 | 27759.08 | 27962.63 | 27759.08 | SL | -40.7 | -1.00R | |
| 3991 | SPX500 | 04.05.26 10:29 | BUY | 7235.02 | 7221.18 | 7290.38 | 7221.18 | SL | -13.8 | -1.00R | |
| 3990 | SPX500 | 01.05.26 10:34 | BUY | 7257.79 | 7241.38 | 7323.43 | 7241.38 | SL | -16.4 | -1.00R | |
| 3989 | NAS100 | 01.05.26 10:32 | BUY | 27704.56 | 27629.29 | 28005.63 | 27629.29 | SL | -75.3 | -1.00R | |
| 3988 | NAS100 | 29.04.26 10:42 | BUY | 27148.73 | 27102.93 | 27331.93 | 27102.93 | SL | -45.8 | -1.00R | |
| 3987 | SPX500 | 29.04.26 10:40 | BUY | 7141.19 | 7135.88 | 7162.47 | 7135.88 | SL | -5.3 | -1.00R | |
| 3986 | SPX500 | 27.04.26 10:52 | BUY | 7158.42 | 7152.77 | 7181.02 | 7152.77 | SL | -5.6 | -1.00R | |
| 3985 | NAS100 | 22.04.26 10:33 | BUY | 26804.05 | 26768.23 | 26947.35 | 26926.72 | Time | +122.7 | +3.42R | |
| 3984 | SPX500 | 22.04.26 10:05 | BUY | 7116.15 | 7104.69 | 7161.99 | 7135.04 | Time | +18.9 | +1.65R | |
| 3983 | NAS100 | 21.04.26 10:45 | BUY | 26659.19 | 26599.34 | 26898.59 | 26599.34 | SL | -59.8 | -1.00R | |
| 3982 | SPX500 | 17.04.26 10:55 | BUY | 7127.12 | 7115.08 | 7175.28 | 7115.08 | SL | -12.0 | -1.00R | |
| 3981 | NAS100 | 17.04.26 10:20 | BUY | 26586.15 | 26532.01 | 26802.68 | 26666.32 | Time | +80.2 | +1.48R | |
| 3980 | SPX500 | 16.04.26 10:56 | BUY | 7020.20 | 7010.81 | 7057.79 | 7038.02 | Time | +17.8 | +1.90R | |
| 3979 | NAS100 | 16.04.26 10:17 | BUY | 26180.56 | 26127.15 | 26394.17 | 26394.17 | TP | +213.6 | +4.00R | |
| 3978 | NAS100 | 15.04.26 10:38 | BUY | 25964.24 | 25906.49 | 26195.24 | 26195.24 | TP | +231.0 | +4.00R | |
| 3977 | SPX500 | 15.04.26 10:34 | BUY | 6988.76 | 6980.71 | 7020.97 | 7020.97 | TP | +32.2 | +4.00R | |
| 3976 | SPX500 | 10.04.26 10:35 | BUY | 6838.13 | 6833.42 | 6856.97 | 6833.42 | SL | -4.7 | -1.00R | |
| 3975 | SPX500 | 07.04.26 10:51 | BUY | 6559.84 | 6548.55 | 6605.00 | 6548.55 | SL | -11.3 | -1.00R | |
| 3974 | NAS100 | 07.04.26 10:42 | BUY | 23907.88 | 23862.30 | 24090.21 | 23862.30 | SL | -45.6 | -1.00R | |
| 3973 | NAS100 | 06.04.26 10:13 | SELL | 24168.93 | 24243.63 | 23870.09 | 24191.90 | Time | -23.0 | -0.31R | |
| 3972 | SPX500 | 06.04.26 10:10 | SELL | 6595.31 | 6609.53 | 6538.42 | 6609.53 | SL | -14.2 | -1.00R | |
| 3971 | SPX500 | 31.03.26 10:18 | SELL | 6443.85 | 6454.51 | 6401.21 | 6454.51 | SL | -10.7 | -1.00R | |
| 3970 | NAS100 | 31.03.26 10:17 | SELL | 23355.17 | 23399.76 | 23176.80 | 23399.76 | SL | -44.6 | -1.00R | |
| 3969 | NAS100 | 30.03.26 10:09 | SELL | 23159.18 | 23196.24 | 23010.96 | 23196.24 | SL | -37.1 | -1.00R | |
| 3968 | NAS100 | 27.03.26 10:25 | SELL | 23314.43 | 23362.76 | 23121.10 | 23362.76 | SL | -48.3 | -1.00R | |
| 3967 | SPX500 | 27.03.26 10:23 | SELL | 6423.00 | 6437.27 | 6365.94 | 6437.27 | SL | -14.3 | -1.00R | |
| 3966 | SPX500 | 26.03.26 10:38 | SELL | 6542.01 | 6548.74 | 6515.07 | 6515.07 | TP | +26.9 | +4.00R | |
| 3965 | SPX500 | 25.03.26 10:24 | SELL | 6594.68 | 6615.33 | 6512.06 | 6615.33 | SL | -20.7 | -1.00R | |
| 3964 | NAS100 | 25.03.26 10:24 | SELL | 24192.47 | 24278.02 | 23850.28 | 24278.02 | SL | -85.5 | -1.00R | |
| 3963 | SPX500 | 19.03.26 10:19 | BUY | 6594.77 | 6582.25 | 6644.85 | 6582.25 | SL | -12.5 | -1.00R | |
| 3962 | NAS100 | 19.03.26 10:17 | BUY | 24307.04 | 24259.80 | 24496.02 | 24259.80 | SL | -47.2 | -1.00R | |
| 3961 | SPX500 | 18.03.26 10:21 | BUY | 6675.09 | 6666.65 | 6708.86 | 6666.65 | SL | -8.4 | -1.00R | |
| 3960 | NAS100 | 18.03.26 10:18 | BUY | 24660.30 | 24613.40 | 24847.89 | 24613.40 | SL | -46.9 | -1.00R | |
| 3959 | SPX500 | 16.03.26 10:50 | BUY | 6706.59 | 6696.53 | 6746.83 | 6696.53 | SL | -10.1 | -1.00R | |
| 3958 | SPX500 | 13.03.26 10:20 | BUY | 6667.25 | 6654.13 | 6719.70 | 6654.13 | SL | -13.1 | -1.00R | |
| 3957 | NAS100 | 13.03.26 10:20 | BUY | 24496.81 | 24442.76 | 24712.99 | 24442.76 | SL | -54.0 | -1.00R | |
| 3956 | NAS100 | 12.03.26 10:47 | BUY | 24621.57 | 24577.46 | 24797.98 | 24577.46 | SL | -44.1 | -1.00R | |
| 3955 | SPX500 | 12.03.26 10:33 | BUY | 6688.39 | 6680.95 | 6718.16 | 6718.16 | TP | +29.8 | +4.00R | |
| 3954 | SPX500 | 10.03.26 10:06 | BUY | 6821.09 | 6813.32 | 6852.14 | 6813.32 | SL | -7.8 | -1.00R | |
| 3953 | NAS100 | 10.03.26 10:06 | BUY | 25110.34 | 25077.61 | 25241.25 | 25077.61 | SL | -32.7 | -1.00R | |
| 3952 | SPX500 | 06.03.26 10:43 | BUY | 6758.45 | 6747.32 | 6802.94 | 6747.32 | SL | -11.1 | -1.00R | |
| 3951 | NAS100 | 06.03.26 10:42 | BUY | 24810.73 | 24764.59 | 24995.26 | 24764.59 | SL | -46.1 | -1.00R | |
| 3950 | NAS100 | 05.03.26 10:06 | BUY | 25122.31 | 25043.88 | 25436.05 | 25043.88 | SL | -78.4 | -1.00R | |
| 3949 | SPX500 | 05.03.26 10:05 | BUY | 6855.00 | 6839.13 | 6918.49 | 6839.13 | SL | -15.9 | -1.00R | |
| 3948 | SPX500 | 04.03.26 10:39 | BUY | 6862.98 | 6844.81 | 6935.67 | 6867.72 | Time | +4.7 | +0.26R | |
| 3947 | NAS100 | 04.03.26 10:35 | BUY | 25069.53 | 24985.29 | 25406.52 | 25085.86 | Time | +16.3 | +0.19R | |
| 3946 | SPX500 | 03.03.26 10:49 | BUY | 6721.50 | 6709.53 | 6769.38 | 6769.38 | TP | +47.9 | +4.00R | |
| 3945 | SPX500 | 02.03.26 10:22 | BUY | 6850.11 | 6833.33 | 6917.25 | 6877.94 | Time | +27.8 | +1.66R | |
| 3944 | NAS100 | 02.03.26 10:22 | BUY | 24831.28 | 24778.39 | 25042.85 | 25042.85 | TP | +211.6 | +4.00R | |
| 3943 | SPX500 | 27.02.26 10:16 | BUY | 6859.80 | 6840.61 | 6936.58 | 6877.63 | Time | +17.8 | +0.93R | |
| 3942 | NAS100 | 24.02.26 10:56 | BUY | 24921.21 | 24831.89 | 25278.47 | 24975.86 | Time | +54.7 | +0.61R | |
| 3941 | SPX500 | 24.02.26 10:54 | BUY | 6872.43 | 6855.91 | 6938.52 | 6889.34 | Time | +16.9 | +1.02R | |
| 3940 | SPX500 | 20.02.26 10:06 | BUY | 6862.92 | 6850.42 | 6912.91 | 6912.91 | TP | +50.0 | +4.00R | |
| 3939 | SPX500 | 16.02.26 10:14 | BUY | 6843.00 | 6836.02 | 6870.93 | 6836.02 | SL | -7.0 | -1.00R | |
| 3938 | NAS100 | 16.02.26 10:14 | BUY | 24694.95 | 24654.53 | 24856.63 | 24654.53 | SL | -40.4 | -1.00R | |
| 3937 | SPX500 | 13.02.26 10:40 | BUY | 6844.41 | 6822.32 | 6932.80 | 6822.32 | SL | -22.1 | -1.00R | |
| 3936 | NAS100 | 13.02.26 10:40 | BUY | 24757.44 | 24648.69 | 25192.45 | 24732.48 | Time | -25.0 | -0.23R | |
| 3935 | NAS100 | 11.02.26 10:49 | BUY | 25062.97 | 24987.08 | 25366.55 | 25193.41 | Time | +130.4 | +1.72R | |
| 3934 | SPX500 | 10.02.26 10:13 | BUY | 6975.46 | 6959.00 | 7041.32 | 6959.00 | SL | -16.5 | -1.00R | |
| 3933 | NAS100 | 10.02.26 10:13 | BUY | 25289.82 | 25186.69 | 25702.36 | 25186.69 | SL | -103.1 | -1.00R | |
| 3932 | SPX500 | 09.02.26 10:26 | BUY | 6941.41 | 6931.80 | 6979.86 | 6979.86 | TP | +38.4 | +4.00R | |
| 3931 | NAS100 | 09.02.26 10:24 | BUY | 25129.21 | 25072.01 | 25358.01 | 25250.27 | Time | +121.1 | +2.12R | |
| 3930 | SPX500 | 04.02.26 10:30 | BUY | 6916.16 | 6904.62 | 6962.31 | 6904.62 | SL | -11.5 | -1.00R | |
| 3929 | NAS100 | 04.02.26 10:17 | BUY | 25089.68 | 25002.60 | 25437.99 | 25002.60 | SL | -87.1 | -1.00R | |
| 3928 | SPX500 | 02.02.26 10:27 | BUY | 6969.12 | 6958.00 | 7013.58 | 6975.93 | Time | +6.8 | +0.61R | |
| 3927 | NAS100 | 02.02.26 10:27 | BUY | 25769.65 | 25702.62 | 26037.76 | 25702.62 | SL | -67.0 | -1.00R | |
| 3926 | NAS100 | 30.01.26 10:56 | BUY | 25725.18 | 25650.32 | 26024.60 | 25650.32 | SL | -74.9 | -1.00R | |
| 3925 | SPX500 | 30.01.26 10:23 | BUY | 6949.87 | 6937.91 | 6997.70 | 6937.91 | SL | -12.0 | -1.00R | |
| 3924 | NAS100 | 27.01.26 10:05 | BUY | 25912.93 | 25849.30 | 26167.47 | 25941.95 | Time | +29.0 | +0.46R | |
| 3923 | SPX500 | 26.01.26 10:27 | BUY | 6952.25 | 6939.61 | 7002.81 | 6950.22 | Time | -2.0 | -0.16R | |
| 3922 | NAS100 | 26.01.26 10:26 | BUY | 25728.35 | 25670.08 | 25961.46 | 25711.27 | Time | -17.1 | -0.29R | |
| 3921 | SPX500 | 23.01.26 10:13 | BUY | 6911.83 | 6900.62 | 6956.70 | 6900.62 | SL | -11.2 | -1.00R | |
| 3920 | NAS100 | 22.01.26 10:50 | BUY | 25497.63 | 25468.34 | 25614.80 | 25468.34 | SL | -29.3 | -1.00R | |
| 3919 | SPX500 | 22.01.26 10:40 | BUY | 6910.11 | 6895.31 | 6969.33 | 6910.13 | Time | +0.0 | +0.00R | |
| 3918 | SPX500 | 21.01.26 10:10 | BUY | 6843.73 | 6831.31 | 6893.40 | 6831.31 | SL | -12.4 | -1.00R | |
| 3917 | NAS100 | 21.01.26 10:10 | BUY | 25160.75 | 25083.37 | 25470.27 | 25083.37 | SL | -77.4 | -1.00R | |
| 3916 | SPX500 | 20.01.26 10:50 | BUY | 6859.00 | 6834.13 | 6958.46 | 6834.13 | SL | -24.9 | -1.00R | |
| 3915 | SPX500 | 19.01.26 10:17 | BUY | 6865.00 | 6858.71 | 6890.16 | 6877.12 | Time | +12.1 | +1.93R | |
| 3914 | NAS100 | 19.01.26 10:11 | BUY | 25164.19 | 25127.36 | 25311.51 | 25242.64 | Time | +78.5 | +2.13R | |
| 3913 | SPX500 | 14.01.26 10:28 | BUY | 6919.76 | 6904.00 | 6982.78 | 6904.00 | SL | -15.8 | -1.00R | |
| 3912 | NAS100 | 14.01.26 10:28 | BUY | 25463.01 | 25383.66 | 25780.42 | 25383.66 | SL | -79.4 | -1.00R | |
| 3911 | SPX500 | 13.01.26 10:48 | BUY | 6953.69 | 6944.30 | 6991.22 | 6944.30 | SL | -9.4 | -1.00R | |
| 3910 | NAS100 | 12.01.26 10:30 | BUY | 25745.29 | 25716.29 | 25861.27 | 25716.29 | SL | -29.0 | -1.00R | |
| 3909 | SPX500 | 09.01.26 10:40 | BUY | 6952.10 | 6937.21 | 7011.68 | 6964.93 | Time | +12.8 | +0.86R | |
| 3908 | NAS100 | 09.01.26 10:40 | BUY | 25651.72 | 25577.14 | 25950.04 | 25758.38 | Time | +106.7 | +1.43R | |
| 3907 | SPX500 | 08.01.26 10:36 | BUY | 6915.71 | 6903.41 | 6964.89 | 6919.08 | Time | +3.4 | +0.28R | |
| 3906 | NAS100 | 08.01.26 10:36 | BUY | 25460.19 | 25392.08 | 25732.65 | 25502.95 | Time | +42.8 | +0.63R | |
| 3905 | SPX500 | 06.01.26 10:36 | BUY | 6925.88 | 6917.22 | 6960.54 | 6917.22 | SL | -8.7 | -1.00R | |
| 3904 | SPX500 | 05.01.26 10:37 | BUY | 6909.65 | 6902.41 | 6938.63 | 6902.41 | SL | -7.2 | -1.00R | |
| 3903 | NAS100 | 05.01.26 10:36 | BUY | 25481.45 | 25450.85 | 25603.85 | 25450.85 | SL | -30.6 | -1.00R | |
| 3902 | SPX500 | 02.01.26 10:49 | BUY | 6861.30 | 6844.73 | 6927.59 | 6844.73 | SL | -16.6 | -1.00R | |
| 3901 | NAS100 | 02.01.26 10:49 | BUY | 25354.05 | 25272.05 | 25682.06 | 25272.05 | SL | -82.0 | -1.00R | |
| 3900 | SPX500 | 29.12.25 10:50 | BUY | 6901.26 | 6895.12 | 6925.80 | 6895.12 | SL | -6.1 | -1.00R | |
| 3899 | NAS100 | 29.12.25 10:38 | BUY | 25525.79 | 25487.08 | 25680.66 | 25487.08 | SL | -38.7 | -1.00R | |
| 3898 | SPX500 | 24.12.25 10:22 | BUY | 6918.46 | 6914.11 | 6935.87 | 6935.87 | TP | +17.4 | +4.00R | |
| 3897 | NAS100 | 24.12.25 10:22 | BUY | 25593.83 | 25576.05 | 25664.93 | 25664.93 | TP | +71.1 | +4.00R | |
| 3896 | SPX500 | 23.12.25 10:28 | BUY | 6880.48 | 6871.22 | 6917.51 | 6906.43 | Time | +26.0 | +2.80R | |
| 3895 | NAS100 | 23.12.25 10:25 | BUY | 25441.68 | 25398.02 | 25616.34 | 25576.79 | Time | +135.1 | +3.09R | |
| 3894 | SPX500 | 22.12.25 10:31 | BUY | 6865.01 | 6856.52 | 6898.94 | 6856.52 | SL | -8.5 | -1.00R | |
| 3893 | NAS100 | 19.12.25 10:43 | BUY | 25283.17 | 25224.60 | 25517.44 | 25224.60 | SL | -58.6 | -1.00R | |
| 3892 | SPX500 | 19.12.25 10:07 | BUY | 6826.43 | 6818.42 | 6858.48 | 6818.42 | SL | -8.0 | -1.00R | |
| 3891 | NAS100 | 18.12.25 10:47 | BUY | 25122.55 | 25061.57 | 25366.47 | 25061.57 | SL | -61.0 | -1.00R | |
| 3890 | SPX500 | 18.12.25 10:06 | BUY | 6787.37 | 6767.13 | 6868.37 | 6767.13 | SL | -20.2 | -1.00R | |
| 3889 | NAS100 | 15.12.25 10:53 | BUY | 25133.35 | 25059.99 | 25426.79 | 25061.26 | Time | -72.1 | -0.98R | |
| 3888 | SPX500 | 15.12.25 10:40 | BUY | 6811.16 | 6800.62 | 6853.31 | 6816.63 | Time | +5.5 | +0.52R | |
| 3887 | SPX500 | 11.12.25 10:36 | BUY | 6868.68 | 6855.91 | 6919.78 | 6855.91 | SL | -12.8 | -1.00R | |
| 3886 | NAS100 | 11.12.25 10:30 | BUY | 25561.26 | 25507.23 | 25777.38 | 25507.23 | SL | -54.0 | -1.00R | |
| 3885 | SPX500 | 05.12.25 10:27 | BUY | 6889.97 | 6878.31 | 6936.59 | 6878.31 | SL | -11.7 | -1.00R | |
| 3884 | NAS100 | 05.12.25 10:20 | BUY | 25798.54 | 25766.80 | 25925.51 | 25766.80 | SL | -31.7 | -1.00R | |
| 3883 | NAS100 | 04.12.25 10:47 | BUY | 25551.23 | 25474.34 | 25858.78 | 25474.34 | SL | -76.9 | -1.00R | |
| 3882 | SPX500 | 04.12.25 10:46 | BUY | 6852.91 | 6845.82 | 6881.24 | 6845.82 | SL | -7.1 | -1.00R | |
| 3881 | SPX500 | 03.12.25 10:12 | BUY | 6824.20 | 6817.23 | 6852.07 | 6852.07 | TP | +27.9 | +4.00R | |
| 3880 | NAS100 | 03.12.25 10:10 | BUY | 25462.46 | 25426.49 | 25606.35 | 25606.35 | TP | +143.9 | +4.00R | |
| 3879 | SPX500 | 02.12.25 10:11 | BUY | 6840.13 | 6827.52 | 6890.59 | 6827.52 | SL | -12.6 | -1.00R | |
| 3878 | NAS100 | 02.12.25 10:11 | BUY | 25570.07 | 25513.24 | 25797.40 | 25513.24 | SL | -56.8 | -1.00R | |
| 3877 | NAS100 | 27.11.25 10:29 | BUY | 25239.41 | 25228.74 | 25282.08 | 25228.74 | SL | -10.7 | -1.00R | |
| 3876 | SPX500 | 27.11.25 10:25 | BUY | 6814.30 | 6811.22 | 6826.62 | 6811.22 | SL | -3.1 | -1.00R | |
| 3875 | SPX500 | 26.11.25 10:42 | BUY | 6800.38 | 6785.92 | 6858.23 | 6810.33 | Time | +10.0 | +0.69R | |
| 3874 | NAS100 | 26.11.25 10:42 | BUY | 25153.68 | 25078.81 | 25453.16 | 25232.03 | Time | +78.4 | +1.05R | |
| 3873 | SPX500 | 25.11.25 10:50 | BUY | 6710.79 | 6699.69 | 6755.19 | 6755.19 | TP | +44.4 | +4.00R | |
| 3872 | SPX500 | 24.11.25 10:11 | BUY | 6658.64 | 6638.15 | 6740.60 | 6701.34 | Time | +42.7 | +2.08R | |
| 3871 | NAS100 | 24.11.25 10:11 | BUY | 24625.08 | 24553.20 | 24912.59 | 24912.59 | TP | +287.5 | +4.00R | |
| 3870 | SPX500 | 20.11.25 10:05 | BUY | 6762.23 | 6753.53 | 6797.05 | 6753.53 | SL | -8.7 | -1.00R | |
| 3869 | SPX500 | 19.11.25 10:10 | BUY | 6675.39 | 6657.55 | 6746.73 | 6657.55 | SL | -17.8 | -1.00R | |
| 3868 | NAS100 | 19.11.25 10:10 | BUY | 24825.96 | 24743.43 | 25156.06 | 24743.43 | SL | -82.5 | -1.00R | |
| 3867 | SPX500 | 18.11.25 10:31 | BUY | 6605.64 | 6585.84 | 6684.81 | 6585.84 | SL | -19.8 | -1.00R | |
| 3866 | NAS100 | 18.11.25 10:30 | BUY | 24452.47 | 24349.33 | 24865.07 | 24349.33 | SL | -103.1 | -1.00R | |
| 3865 | SPX500 | 14.11.25 10:56 | BUY | 6733.95 | 6721.73 | 6782.82 | 6736.14 | Time | +2.2 | +0.18R | |
| 3864 | NAS100 | 14.11.25 10:56 | BUY | 25021.32 | 24965.41 | 25244.96 | 25012.47 | Time | -8.9 | -0.16R | |
| 3863 | SPX500 | 13.11.25 10:22 | BUY | 6814.45 | 6797.61 | 6881.81 | 6797.61 | SL | -16.8 | -1.00R | |
| 3862 | NAS100 | 13.11.25 10:21 | BUY | 25316.29 | 25223.28 | 25688.31 | 25223.28 | SL | -93.0 | -1.00R | |
| 3861 | SPX500 | 11.11.25 10:05 | BUY | 6820.23 | 6812.83 | 6849.81 | 6812.83 | SL | -7.4 | -1.00R | |
| 3860 | NAS100 | 11.11.25 10:05 | BUY | 25488.43 | 25454.91 | 25622.50 | 25454.91 | SL | -33.5 | -1.00R | |
| 3859 | NAS100 | 10.11.25 10:14 | BUY | 25515.42 | 25480.88 | 25653.58 | 25480.88 | SL | -34.5 | -1.00R | |
| 3858 | SPX500 | 07.11.25 10:23 | BUY | 6679.64 | 6658.65 | 6763.59 | 6658.65 | SL | -21.0 | -1.00R | |
| 3857 | NAS100 | 07.11.25 10:23 | BUY | 24871.41 | 24770.35 | 25275.66 | 24770.35 | SL | -101.1 | -1.00R | |
| 3856 | SPX500 | 06.11.25 10:30 | BUY | 6763.70 | 6749.62 | 6820.02 | 6749.62 | SL | -14.1 | -1.00R | |
| 3855 | SPX500 | 04.11.25 10:08 | BUY | 6805.67 | 6789.82 | 6869.11 | 6789.82 | SL | -15.9 | -1.00R | |
| 3854 | NAS100 | 04.11.25 10:06 | BUY | 25731.71 | 25634.69 | 26119.79 | 25634.69 | SL | -97.0 | -1.00R | |
| 3853 | NAS100 | 03.11.25 10:49 | BUY | 25924.10 | 25880.49 | 26098.52 | 25977.99 | Time | +53.9 | +1.24R | |
| 3852 | NAS100 | 31.10.25 10:20 | BUY | 26032.09 | 26011.96 | 26112.63 | 26011.96 | SL | -20.1 | -1.00R | |
| 3851 | NAS100 | 30.10.25 10:34 | BUY | 25885.25 | 25835.33 | 26084.93 | 25835.33 | SL | -49.9 | -1.00R | |
| 3850 | NAS100 | 29.10.25 10:27 | BUY | 26120.81 | 26093.05 | 26231.83 | 26093.05 | SL | -27.8 | -1.00R | |
| 3849 | SPX500 | 27.10.25 10:50 | BUY | 6854.95 | 6850.22 | 6873.89 | 6873.89 | TP | +18.9 | +4.00R | |
| 3848 | NAS100 | 27.10.25 10:37 | BUY | 25748.77 | 25726.07 | 25839.59 | 25826.52 | Time | +77.7 | +3.42R | |
| 3847 | SPX500 | 24.10.25 10:51 | BUY | 6793.90 | 6783.52 | 6835.43 | 6783.52 | SL | -10.4 | -1.00R | |
| 3846 | NAS100 | 24.10.25 10:27 | BUY | 25348.36 | 25313.67 | 25487.10 | 25313.67 | SL | -34.7 | -1.00R | |
| 3845 | SPX500 | 23.10.25 10:30 | BUY | 6714.89 | 6702.39 | 6764.90 | 6737.44 | Time | +22.5 | +1.80R | |
| 3844 | SPX500 | 21.10.25 10:26 | BUY | 6734.09 | 6725.04 | 6770.30 | 6725.04 | SL | -9.1 | -1.00R | |
| 3843 | NAS100 | 21.10.25 10:25 | BUY | 25093.63 | 25053.12 | 25255.67 | 25053.12 | SL | -40.5 | -1.00R | |
| 3842 | SPX500 | 20.10.25 10:35 | BUY | 6721.35 | 6712.84 | 6755.39 | 6734.53 | Time | +13.2 | +1.55R | |
| 3841 | NAS100 | 17.10.25 10:21 | BUY | 24720.92 | 24645.05 | 25024.39 | 24645.05 | SL | -75.9 | -1.00R | |
| 3840 | SPX500 | 17.10.25 10:20 | BUY | 6640.90 | 6627.10 | 6696.07 | 6627.10 | SL | -13.8 | -1.00R | |
| 3839 | SPX500 | 16.10.25 10:26 | BUY | 6688.62 | 6676.33 | 6737.76 | 6676.33 | SL | -12.3 | -1.00R | |
| 3838 | NAS100 | 16.10.25 10:26 | BUY | 24891.39 | 24836.40 | 25111.33 | 24836.40 | SL | -55.0 | -1.00R | |
| 3837 | SPX500 | 15.10.25 10:18 | BUY | 6715.46 | 6705.14 | 6756.73 | 6705.14 | SL | -10.3 | -1.00R | |
| 3836 | SPX500 | 13.10.25 10:41 | BUY | 6636.95 | 6622.74 | 6693.80 | 6622.74 | SL | -14.2 | -1.00R | |
| 3835 | NAS100 | 13.10.25 10:41 | BUY | 24667.89 | 24615.61 | 24877.04 | 24615.61 | SL | -52.3 | -1.00R | |
| 3834 | SPX500 | 10.10.25 10:57 | BUY | 6749.60 | 6743.53 | 6773.87 | 6743.53 | SL | -6.1 | -1.00R | |
| 3833 | SPX500 | 08.10.25 10:22 | BUY | 6738.31 | 6726.24 | 6786.60 | 6754.73 | Time | +16.4 | +1.36R | |
| 3832 | NAS100 | 08.10.25 10:22 | BUY | 24990.81 | 24956.17 | 25129.33 | 25129.33 | TP | +138.5 | +4.00R | |
| 3831 | NAS100 | 03.10.25 10:48 | BUY | 24894.60 | 24866.73 | 25006.11 | 24866.73 | SL | -27.9 | -1.00R | |
| 3830 | SPX500 | 01.10.25 10:41 | BUY | 6677.78 | 6670.04 | 6708.72 | 6708.72 | TP | +30.9 | +4.00R | |
| 3829 | NAS100 | 01.10.25 10:40 | BUY | 24675.08 | 24649.45 | 24777.60 | 24777.60 | TP | +102.5 | +4.00R | |
| 3828 | SPX500 | 30.09.25 10:05 | BUY | 6654.42 | 6645.14 | 6691.57 | 6645.14 | SL | -9.3 | -1.00R | |
| 3827 | NAS100 | 26.09.25 10:49 | BUY | 24361.41 | 24311.27 | 24561.97 | 24496.14 | Time | +134.7 | +2.69R | |
| 3826 | SPX500 | 26.09.25 10:45 | BUY | 6615.28 | 6605.55 | 6654.21 | 6605.55 | SL | -9.7 | -1.00R | |
| 3825 | SPX500 | 25.09.25 10:31 | BUY | 6608.27 | 6600.44 | 6639.60 | 6600.44 | SL | -7.8 | -1.00R | |
| 3824 | NAS100 | 18.09.25 10:57 | BUY | 24486.77 | 24442.21 | 24665.01 | 24443.73 | Time | -43.0 | -0.97R | |
| 3823 | SPX500 | 18.09.25 10:35 | BUY | 6651.37 | 6643.65 | 6682.26 | 6643.65 | SL | -7.7 | -1.00R | |
| 3822 | NAS100 | 12.09.25 10:41 | BUY | 24056.76 | 24042.00 | 24115.81 | 24115.81 | TP | +59.1 | +4.00R | |
| 3821 | NAS100 | 11.09.25 10:45 | BUY | 23975.26 | 23930.82 | 24153.04 | 23982.00 | Time | +6.7 | +0.15R | |
| 3820 | SPX500 | 11.09.25 10:14 | BUY | 6567.64 | 6558.84 | 6602.85 | 6584.95 | Time | +17.3 | +1.97R | |
| 3819 | SPX500 | 10.09.25 10:33 | BUY | 6548.36 | 6538.53 | 6587.71 | 6538.53 | SL | -9.8 | -1.00R | |
| 3818 | NAS100 | 04.09.25 10:44 | BUY | 23455.59 | 23419.02 | 23601.87 | 23601.87 | TP | +146.3 | +4.00R | |
| 3817 | NAS100 | 03.09.25 10:12 | BUY | 23377.78 | 23330.38 | 23567.38 | 23330.38 | SL | -47.4 | -1.00R | |
| 3816 | SPX500 | 01.09.25 10:35 | BUY | 6468.02 | 6465.36 | 6478.68 | 6470.48 | Time | +2.5 | +0.92R | |
| 3815 | NAS100 | 28.08.25 10:18 | BUY | 23582.00 | 23531.85 | 23782.59 | 23703.55 | Time | +121.6 | +2.42R | |
| 3814 | SPX500 | 28.08.25 10:17 | BUY | 6475.97 | 6468.35 | 6506.45 | 6506.45 | TP | +30.5 | +4.00R | |
| 3813 | SPX500 | 27.08.25 10:45 | BUY | 6473.42 | 6468.38 | 6493.56 | 6468.38 | SL | -5.0 | -1.00R | |
| 3812 | NAS100 | 26.08.25 10:36 | BUY | 23467.42 | 23433.68 | 23602.38 | 23433.68 | SL | -33.7 | -1.00R | |
| 3811 | NAS100 | 25.08.25 10:20 | BUY | 23455.75 | 23407.99 | 23646.80 | 23425.73 | Time | -30.0 | -0.63R | |
| 3810 | SPX500 | 22.08.25 10:51 | BUY | 6468.11 | 6460.19 | 6499.77 | 6460.19 | SL | -7.9 | -1.00R | |
| 3809 | SPX500 | 21.08.25 10:39 | BUY | 6377.38 | 6363.36 | 6433.44 | 6363.36 | SL | -14.0 | -1.00R | |
| 3808 | NAS100 | 21.08.25 10:39 | BUY | 23186.95 | 23076.33 | 23629.41 | 23076.33 | SL | -110.6 | -1.00R | |
| 3807 | SPX500 | 19.08.25 10:27 | BUY | 6449.88 | 6442.09 | 6481.07 | 6442.09 | SL | -7.8 | -1.00R | |
| 3806 | NAS100 | 19.08.25 10:14 | BUY | 23622.42 | 23590.44 | 23750.32 | 23590.44 | SL | -32.0 | -1.00R | |
| 3805 | NAS100 | 15.08.25 10:42 | BUY | 23741.28 | 23695.64 | 23923.81 | 23695.64 | SL | -45.6 | -1.00R | |
| 3804 | NAS100 | 14.08.25 10:57 | BUY | 23864.54 | 23828.44 | 24008.94 | 23828.44 | SL | -36.1 | -1.00R | |
| 3803 | SPX500 | 12.08.25 10:32 | BUY | 6407.88 | 6396.60 | 6453.02 | 6444.04 | Time | +36.2 | +3.20R | |
| 3802 | NAS100 | 08.08.25 10:41 | BUY | 23582.15 | 23547.62 | 23720.30 | 23547.62 | SL | -34.5 | -1.00R | |
| 3801 | SPX500 | 08.08.25 10:14 | BUY | 6379.53 | 6372.26 | 6408.59 | 6372.26 | SL | -7.3 | -1.00R | |
| 3800 | SPX500 | 06.08.25 10:12 | BUY | 6319.75 | 6306.85 | 6371.35 | 6306.85 | SL | -12.9 | -1.00R | |
| 3799 | NAS100 | 06.08.25 10:12 | BUY | 23142.02 | 23084.64 | 23371.54 | 23084.64 | SL | -57.4 | -1.00R | |
| 3798 | NAS100 | 04.08.25 10:09 | BUY | 23113.79 | 23075.95 | 23265.13 | 23075.95 | SL | -37.8 | -1.00R | |
| 3797 | SPX500 | 04.08.25 10:08 | BUY | 6307.03 | 6297.36 | 6345.71 | 6329.06 | Time | +22.0 | +2.28R | |
| 3796 | NAS100 | 01.08.25 10:40 | BUY | 22849.01 | 22796.90 | 23057.48 | 22796.90 | SL | -52.1 | -1.00R | |
| 3795 | SPX500 | 30.07.25 10:59 | BUY | 6382.66 | 6376.11 | 6408.87 | 6376.11 | SL | -6.6 | -1.00R | |
| 3794 | SPX500 | 28.07.25 10:21 | BUY | 6395.88 | 6390.35 | 6417.98 | 6390.35 | SL | -5.5 | -1.00R | |
| 3793 | SPX500 | 22.07.25 10:52 | BUY | 6293.44 | 6287.00 | 6319.19 | 6307.91 | Time | +14.5 | +2.25R | |
| 3792 | NAS100 | 22.07.25 10:48 | BUY | 23049.76 | 23009.64 | 23210.26 | 23009.64 | SL | -40.1 | -1.00R | |
| 3791 | SPX500 | 21.07.25 10:10 | BUY | 6325.63 | 6318.62 | 6353.67 | 6318.62 | SL | -7.0 | -1.00R | |
| 3790 | SPX500 | 16.07.25 10:55 | BUY | 6247.32 | 6239.98 | 6276.67 | 6239.98 | SL | -7.3 | -1.00R | |
| 3789 | NAS100 | 15.07.25 10:25 | BUY | 22994.41 | 22953.92 | 23156.40 | 22953.92 | SL | -40.5 | -1.00R | |
| 3788 | SPX500 | 14.07.25 10:27 | BUY | 6251.99 | 6242.37 | 6290.47 | 6268.15 | Time | +16.2 | +1.68R | |
| 3787 | NAS100 | 14.07.25 10:27 | BUY | 22775.09 | 22730.73 | 22952.53 | 22854.08 | Time | +79.0 | +1.78R | |
| 3786 | SPX500 | 11.07.25 10:30 | BUY | 6260.35 | 6254.61 | 6283.31 | 6254.61 | SL | -5.7 | -1.00R | |
| 3785 | NAS100 | 11.07.25 10:05 | BUY | 22770.25 | 22745.54 | 22869.09 | 22745.54 | SL | -24.7 | -1.00R | |
| 3784 | SPX500 | 10.07.25 10:25 | BUY | 6256.61 | 6249.82 | 6283.75 | 6283.75 | TP | +27.1 | +4.00R | |
| 3783 | NAS100 | 10.07.25 10:21 | BUY | 22748.27 | 22711.21 | 22896.51 | 22825.82 | Time | +77.5 | +2.09R | |
| 3782 | SPX500 | 08.07.25 10:45 | BUY | 6227.69 | 6217.86 | 6266.99 | 6217.86 | SL | -9.8 | -1.00R | |
| 3781 | NAS100 | 08.07.25 10:45 | BUY | 22703.52 | 22652.83 | 22906.26 | 22652.83 | SL | -50.7 | -1.00R | |
| 3780 | SPX500 | 04.07.25 10:51 | BUY | 6242.54 | 6237.12 | 6264.22 | 6237.12 | SL | -5.4 | -1.00R | |
| 3779 | NAS100 | 04.07.25 10:48 | BUY | 22741.64 | 22720.19 | 22827.44 | 22720.19 | SL | -21.5 | -1.00R | |
| 3778 | SPX500 | 03.07.25 10:15 | BUY | 6268.75 | 6261.38 | 6298.22 | 6278.08 | Time | +9.3 | +1.27R | |
| 3777 | NAS100 | 03.07.25 10:15 | BUY | 22834.36 | 22782.13 | 23043.27 | 22865.24 | Time | +30.9 | +0.59R | |
| 3776 | SPX500 | 02.07.25 10:44 | BUY | 6207.49 | 6200.80 | 6234.28 | 6225.55 | Time | +18.1 | +2.69R | |
| 3775 | NAS100 | 02.07.25 10:44 | BUY | 22568.99 | 22541.07 | 22680.65 | 22631.00 | Time | +62.0 | +2.22R | |
| 3774 | SPX500 | 01.07.25 10:21 | BUY | 6198.63 | 6192.39 | 6223.62 | 6192.39 | SL | -6.2 | -1.00R | |
| 3773 | NAS100 | 01.07.25 10:20 | BUY | 22607.30 | 22581.64 | 22709.96 | 22581.64 | SL | -25.7 | -1.00R | |
| 3772 | NAS100 | 30.06.25 10:06 | BUY | 22604.76 | 22575.47 | 22721.92 | 22575.47 | SL | -29.3 | -1.00R | |
| 3771 | NAS100 | 27.06.25 10:25 | BUY | 22565.95 | 22524.36 | 22732.29 | 22524.36 | SL | -41.6 | -1.00R | |
| 3770 | SPX500 | 27.06.25 10:16 | BUY | 6172.12 | 6164.38 | 6203.08 | 6164.38 | SL | -7.7 | -1.00R | |
| 3769 | SPX500 | 26.06.25 10:41 | BUY | 6124.95 | 6119.22 | 6147.88 | 6142.88 | Time | +17.9 | +3.13R | |
| 3768 | SPX500 | 24.06.25 10:28 | BUY | 6068.19 | 6062.35 | 6091.53 | 6091.53 | TP | +23.3 | +4.00R | |
| 3767 | NAS100 | 24.06.25 10:28 | BUY | 22084.26 | 22059.49 | 22183.36 | 22183.36 | TP | +99.1 | +4.00R | |
| 3766 | SPX500 | 23.06.25 10:49 | BUY | 5994.40 | 5984.80 | 6032.80 | 5984.80 | SL | -9.6 | -1.00R | |
| 3765 | SPX500 | 19.06.25 10:20 | BUY | 5928.08 | 5921.25 | 5955.39 | 5921.25 | SL | -6.8 | -1.00R | |
| 3764 | NAS100 | 19.06.25 10:20 | BUY | 21475.06 | 21443.55 | 21601.08 | 21476.25 | Time | +1.2 | +0.04R | |
| 3763 | SPX500 | 18.06.25 10:52 | BUY | 6012.61 | 6004.89 | 6043.47 | 6004.89 | SL | -7.7 | -1.00R | |
| 3762 | NAS100 | 18.06.25 10:52 | BUY | 21835.41 | 21809.74 | 21938.09 | 21809.74 | SL | -25.7 | -1.00R | |
| 3761 | SPX500 | 16.06.25 10:37 | BUY | 6045.39 | 6036.41 | 6081.29 | 6036.41 | SL | -9.0 | -1.00R | |
| 3760 | NAS100 | 16.06.25 10:08 | BUY | 21913.34 | 21857.10 | 22138.30 | 21935.53 | Time | +22.2 | +0.40R | |
| 3759 | NAS100 | 13.06.25 10:49 | BUY | 21674.58 | 21604.44 | 21955.15 | 21604.44 | SL | -70.1 | -1.00R | |
| 3758 | SPX500 | 13.06.25 10:45 | BUY | 5985.71 | 5973.44 | 6034.80 | 5973.44 | SL | -12.3 | -1.00R | |
| 3757 | SPX500 | 12.06.25 10:25 | BUY | 6029.21 | 6021.82 | 6058.77 | 6045.43 | Time | +16.2 | +2.19R | |
| 3756 | NAS100 | 12.06.25 10:25 | BUY | 21884.31 | 21823.13 | 22129.06 | 21913.78 | Time | +29.5 | +0.48R | |
| 3755 | SPX500 | 10.06.25 10:20 | BUY | 6018.48 | 6014.10 | 6035.99 | 6014.10 | SL | -4.4 | -1.00R | |
| 3754 | NAS100 | 10.06.25 10:20 | BUY | 21843.07 | 21821.04 | 21931.19 | 21821.04 | SL | -22.0 | -1.00R | |
| 3753 | NAS100 | 09.06.25 10:57 | BUY | 21806.32 | 21768.27 | 21958.50 | 21789.71 | Time | -16.6 | -0.44R | |
| 3752 | SPX500 | 09.06.25 10:45 | BUY | 6002.36 | 5997.90 | 6020.20 | 6020.20 | TP | +17.8 | +4.00R | |
| 3751 | SPX500 | 06.06.25 10:45 | BUY | 6003.15 | 5994.61 | 6037.31 | 5994.61 | SL | -8.5 | -1.00R | |
| 3750 | SPX500 | 05.06.25 10:32 | BUY | 5963.20 | 5952.66 | 6005.36 | 5952.66 | SL | -10.5 | -1.00R | |
| 3749 | NAS100 | 05.06.25 10:32 | BUY | 21718.77 | 21674.50 | 21895.83 | 21674.50 | SL | -44.3 | -1.00R | |
| 3748 | SPX500 | 04.06.25 10:38 | BUY | 5984.18 | 5977.46 | 6011.02 | 5977.46 | SL | -6.7 | -1.00R | |
| 3747 | SPX500 | 02.06.25 10:38 | BUY | 5893.93 | 5877.80 | 5958.44 | 5936.49 | Time | +42.6 | +2.64R | |
| 3746 | NAS100 | 02.06.25 10:38 | BUY | 21326.84 | 21258.01 | 21602.20 | 21490.08 | Time | +163.2 | +2.37R | |
| 3745 | NAS100 | 30.05.25 10:52 | BUY | 21307.58 | 21271.06 | 21453.65 | 21271.06 | SL | -36.5 | -1.00R | |
| 3744 | SPX500 | 30.05.25 10:45 | BUY | 5900.84 | 5892.78 | 5933.11 | 5892.78 | SL | -8.1 | -1.00R | |
| 3743 | SPX500 | 27.05.25 10:36 | BUY | 5889.42 | 5881.01 | 5923.07 | 5923.07 | TP | +33.6 | +4.00R | |
| 3742 | NAS100 | 23.05.25 10:58 | BUY | 20851.72 | 20804.95 | 21038.84 | 20919.81 | Time | +68.1 | +1.46R | |
| 3741 | SPX500 | 23.05.25 10:11 | BUY | 5784.27 | 5773.87 | 5825.86 | 5825.86 | TP | +41.6 | +4.00R | |
| 3740 | SPX500 | 22.05.25 10:12 | BUY | 5853.30 | 5832.88 | 5934.96 | 5832.88 | SL | -20.4 | -1.00R | |
| 3739 | NAS100 | 22.05.25 10:11 | BUY | 21224.14 | 21156.21 | 21495.90 | 21156.21 | SL | -67.9 | -1.00R | |
| 3738 | SPX500 | 20.05.25 10:57 | BUY | 5947.21 | 5938.47 | 5982.21 | 5938.47 | SL | -8.7 | -1.00R | |
| 3737 | NAS100 | 20.05.25 10:28 | BUY | 21322.95 | 21287.71 | 21463.90 | 21287.71 | SL | -35.2 | -1.00R | |
| 3736 | SPX500 | 19.05.25 10:28 | BUY | 5929.98 | 5922.16 | 5961.25 | 5961.25 | TP | +31.3 | +4.00R | |
| 3735 | NAS100 | 19.05.25 10:26 | BUY | 21331.02 | 21266.95 | 21587.26 | 21444.54 | Time | +113.5 | +1.77R | |
| 3734 | SPX500 | 16.05.25 10:28 | BUY | 5924.47 | 5916.66 | 5955.67 | 5916.66 | SL | -7.8 | -1.00R | |
| 3733 | NAS100 | 15.05.25 10:27 | BUY | 21228.34 | 21189.51 | 21383.66 | 21189.51 | SL | -38.8 | -1.00R | |
| 3732 | SPX500 | 15.05.25 10:10 | BUY | 5876.85 | 5870.41 | 5902.63 | 5870.41 | SL | -6.4 | -1.00R | |
| 3731 | NAS100 | 13.05.25 10:45 | BUY | 21108.77 | 21055.78 | 21320.72 | 21183.92 | Time | +75.1 | +1.42R | |
| 3730 | SPX500 | 13.05.25 10:30 | BUY | 5882.68 | 5870.63 | 5930.89 | 5883.36 | Time | +0.7 | +0.06R | |
| 3729 | SPX500 | 12.05.25 10:20 | BUY | 5813.75 | 5804.43 | 5851.05 | 5804.43 | SL | -9.3 | -1.00R | |
| 3728 | SPX500 | 09.05.25 10:05 | BUY | 5683.14 | 5673.18 | 5722.99 | 5673.18 | SL | -10.0 | -1.00R | |
| 3727 | NAS100 | 09.05.25 10:05 | BUY | 20167.67 | 20124.00 | 20342.37 | 20124.00 | SL | -43.7 | -1.00R | |
| 3726 | SPX500 | 08.05.25 10:20 | SELL | 5653.78 | 5665.79 | 5605.75 | 5665.79 | SL | -12.0 | -1.00R | |
| 3725 | SPX500 | 05.05.25 10:05 | BUY | 5646.08 | 5632.70 | 5699.61 | 5651.98 | Time | +5.9 | +0.44R | |
| 3724 | NAS100 | 05.05.25 10:05 | BUY | 19957.55 | 19911.32 | 20142.46 | 19973.78 | Time | +16.2 | +0.35R | |
| 3723 | NAS100 | 01.05.25 10:05 | SELL | 19841.67 | 19897.53 | 19618.21 | 19897.53 | SL | -55.9 | -1.00R | |
| 3722 | SPX500 | 29.04.25 10:33 | SELL | 5522.92 | 5537.14 | 5466.07 | 5537.14 | SL | -14.2 | -1.00R | |
| 3721 | NAS100 | 29.04.25 10:30 | SELL | 19417.61 | 19475.55 | 19185.83 | 19475.55 | SL | -57.9 | -1.00R | |
| 3720 | SPX500 | 28.04.25 10:16 | SELL | 5530.47 | 5545.59 | 5469.98 | 5469.98 | TP | +60.5 | +4.00R | |
| 3719 | NAS100 | 28.04.25 10:10 | SELL | 19414.58 | 19486.99 | 19124.92 | 19422.92 | Time | -8.3 | -0.12R | |
| 3718 | SPX500 | 25.04.25 10:40 | SELL | 5475.29 | 5494.28 | 5399.35 | 5494.28 | SL | -19.0 | -1.00R | |
| 3717 | NAS100 | 25.04.25 10:39 | SELL | 19222.24 | 19293.27 | 18938.12 | 19293.27 | SL | -71.0 | -1.00R | |
| 3716 | SPX500 | 24.04.25 10:55 | SELL | 5440.57 | 5450.79 | 5399.72 | 5450.79 | SL | -10.2 | -1.00R | |
| 3715 | NAS100 | 24.04.25 10:55 | SELL | 19024.31 | 19070.79 | 18838.39 | 19070.79 | SL | -46.5 | -1.00R | |
| 3714 | SPX500 | 21.04.25 10:36 | SELL | 5176.81 | 5185.50 | 5142.02 | 5142.02 | TP | +34.8 | +4.00R | |
| 3713 | NAS100 | 21.04.25 10:25 | SELL | 17822.10 | 17858.09 | 17678.16 | 17858.09 | SL | -36.0 | -1.00R | |
| 3712 | SPX500 | 17.04.25 10:40 | SELL | 5268.08 | 5282.25 | 5211.40 | 5282.25 | SL | -14.2 | -1.00R | |
| 3711 | NAS100 | 17.04.25 10:40 | SELL | 18194.69 | 18258.11 | 17941.05 | 18258.11 | SL | -63.4 | -1.00R | |
| 3710 | SPX500 | 15.04.25 10:43 | SELL | 5430.00 | 5451.28 | 5344.87 | 5394.65 | Time | +35.3 | +1.66R | |
| 3709 | NAS100 | 15.04.25 10:43 | SELL | 18914.38 | 19005.51 | 18549.87 | 18824.40 | Time | +90.0 | +0.99R | |
| 3708 | SPX500 | 11.04.25 10:32 | SELL | 5247.03 | 5295.06 | 5054.90 | 5295.06 | SL | -48.0 | -1.00R | |
| 3707 | NAS100 | 11.04.25 10:32 | SELL | 18261.35 | 18450.89 | 17503.16 | 18450.89 | SL | -189.5 | -1.00R | |
| 3706 | NAS100 | 10.04.25 10:24 | SELL | 18561.44 | 18703.01 | 17995.15 | 17995.15 | TP | +566.3 | +4.00R | |
| 3705 | SPX500 | 04.04.25 10:21 | SELL | 5211.25 | 5243.50 | 5082.26 | 5082.26 | TP | +129.0 | +4.00R | |
| 3704 | NAS100 | 04.04.25 10:20 | SELL | 17886.10 | 18024.06 | 17334.25 | 17397.04 | Time | +489.1 | +3.54R | |
| 3703 | SPX500 | 03.04.25 10:32 | SELL | 5458.36 | 5479.33 | 5374.47 | 5479.33 | SL | -21.0 | -1.00R | |
| 3702 | NAS100 | 01.04.25 10:23 | SELL | 19153.57 | 19233.37 | 18834.35 | 19233.37 | SL | -79.8 | -1.00R | |
| 3701 | SPX500 | 01.04.25 10:22 | SELL | 5570.79 | 5591.41 | 5488.34 | 5591.41 | SL | -20.6 | -1.00R | |
| 3700 | SPX500 | 31.03.25 10:30 | SELL | 5522.83 | 5535.10 | 5473.76 | 5535.10 | SL | -12.3 | -1.00R | |
| 3699 | NAS100 | 31.03.25 10:30 | SELL | 18909.93 | 18985.29 | 18608.51 | 18985.29 | SL | -75.4 | -1.00R | |
| 3698 | SPX500 | 21.03.25 10:33 | SELL | 5625.75 | 5638.21 | 5575.93 | 5638.21 | SL | -12.5 | -1.00R | |
| 3697 | NAS100 | 21.03.25 10:32 | SELL | 19543.39 | 19597.10 | 19328.59 | 19597.10 | SL | -53.7 | -1.00R | |
| 3696 | SPX500 | 20.03.25 10:40 | SELL | 5691.81 | 5699.13 | 5662.56 | 5699.13 | SL | -7.3 | -1.00R | |
| 3695 | NAS100 | 20.03.25 10:40 | SELL | 19799.04 | 19832.51 | 19665.16 | 19832.51 | SL | -33.5 | -1.00R | |
| 3694 | SPX500 | 18.03.25 10:13 | SELL | 5608.45 | 5621.63 | 5555.71 | 5621.63 | SL | -13.2 | -1.00R | |
| 3693 | NAS100 | 18.03.25 10:13 | SELL | 19439.58 | 19495.33 | 19216.61 | 19495.33 | SL | -55.7 | -1.00R | |
| 3692 | SPX500 | 17.03.25 10:48 | SELL | 5645.03 | 5657.42 | 5595.50 | 5657.42 | SL | -12.4 | -1.00R | |
| 3691 | NAS100 | 17.03.25 10:48 | SELL | 19659.84 | 19709.55 | 19460.99 | 19709.55 | SL | -49.7 | -1.00R | |
| 3690 | NAS100 | 14.03.25 10:55 | SELL | 19658.63 | 19684.56 | 19554.90 | 19684.56 | SL | -25.9 | -1.00R | |
| 3689 | SPX500 | 12.03.25 10:17 | SELL | 5560.42 | 5581.85 | 5474.68 | 5581.85 | SL | -21.4 | -1.00R | |
| 3688 | NAS100 | 12.03.25 10:17 | SELL | 19437.76 | 19541.56 | 19022.56 | 19541.56 | SL | -103.8 | -1.00R | |
| 3687 | SPX500 | 10.03.25 10:19 | BUY | 5649.83 | 5637.80 | 5697.95 | 5637.80 | SL | -12.0 | -1.00R | |
| 3686 | NAS100 | 07.03.25 10:24 | SELL | 20095.90 | 20164.57 | 19821.21 | 19821.21 | TP | +274.7 | +4.00R | |
| 3685 | NAS100 | 06.03.25 10:26 | BUY | 20396.45 | 20348.01 | 20590.21 | 20348.01 | SL | -48.4 | -1.00R | |
| 3684 | SPX500 | 06.03.25 10:25 | BUY | 5789.53 | 5779.08 | 5831.32 | 5779.08 | SL | -10.4 | -1.00R | |
| 3683 | NAS100 | 05.03.25 10:17 | BUY | 20353.23 | 20228.67 | 20851.48 | 20228.67 | SL | -124.6 | -1.00R | |
| 3682 | SPX500 | 05.03.25 10:16 | BUY | 5786.21 | 5760.12 | 5890.57 | 5760.12 | SL | -26.1 | -1.00R | |
| 3681 | SPX500 | 04.03.25 10:47 | BUY | 5749.35 | 5731.78 | 5819.61 | 5819.61 | TP | +70.3 | +4.00R | |
| 3680 | NAS100 | 03.03.25 10:57 | BUY | 20816.13 | 20758.02 | 21048.59 | 20758.02 | SL | -58.1 | -1.00R | |
| 3679 | SPX500 | 03.03.25 10:37 | BUY | 5939.99 | 5926.16 | 5995.31 | 5926.16 | SL | -13.8 | -1.00R | |
| 3678 | SPX500 | 28.02.25 10:35 | BUY | 5892.40 | 5869.55 | 5983.83 | 5869.55 | SL | -22.9 | -1.00R | |
| 3677 | NAS100 | 28.02.25 10:35 | BUY | 20679.06 | 20573.49 | 21101.33 | 20573.49 | SL | -105.6 | -1.00R | |
| 3676 | SPX500 | 27.02.25 10:30 | BUY | 5963.33 | 5951.76 | 6009.58 | 5951.76 | SL | -11.6 | -1.00R | |
| 3675 | NAS100 | 27.02.25 10:30 | BUY | 21047.22 | 20998.41 | 21242.44 | 20998.41 | SL | -48.8 | -1.00R | |
| 3674 | SPX500 | 26.02.25 10:28 | BUY | 5995.24 | 5984.90 | 6036.60 | 5984.90 | SL | -10.3 | -1.00R | |
| 3673 | NAS100 | 26.02.25 10:28 | BUY | 21257.04 | 21204.71 | 21466.33 | 21204.71 | SL | -52.3 | -1.00R | |
| 3672 | NAS100 | 20.02.25 10:36 | BUY | 21981.34 | 21918.66 | 22232.03 | 21918.66 | SL | -62.7 | -1.00R | |
| 3671 | SPX500 | 19.02.25 10:56 | BUY | 6118.22 | 6113.75 | 6136.07 | 6113.75 | SL | -4.5 | -1.00R | |
| 3670 | NAS100 | 19.02.25 10:55 | BUY | 22107.44 | 22076.61 | 22230.79 | 22076.61 | SL | -30.8 | -1.00R | |
| 3669 | SPX500 | 18.02.25 10:46 | BUY | 6114.83 | 6108.38 | 6140.60 | 6108.38 | SL | -6.4 | -1.00R | |
| 3668 | SPX500 | 17.02.25 10:48 | BUY | 6121.61 | 6119.38 | 6130.55 | 6125.76 | Time | +4.1 | +1.86R | |
| 3667 | NAS100 | 14.02.25 10:15 | BUY | 22058.36 | 22016.24 | 22226.87 | 22016.24 | SL | -42.1 | -1.00R | |
| 3666 | SPX500 | 13.02.25 10:07 | BUY | 6064.52 | 6055.85 | 6099.19 | 6099.19 | TP | +34.7 | +4.00R | |
| 3665 | NAS100 | 13.02.25 10:07 | BUY | 21818.47 | 21776.04 | 21988.20 | 21988.20 | TP | +169.7 | +4.00R | |
| 3664 | SPX500 | 12.02.25 10:46 | BUY | 6038.68 | 6031.19 | 6068.61 | 6031.19 | SL | -7.5 | -1.00R | |
| 3663 | SPX500 | 11.02.25 10:59 | BUY | 6065.48 | 6060.39 | 6085.85 | 6060.39 | SL | -5.1 | -1.00R | |
| 3662 | NAS100 | 11.02.25 10:20 | BUY | 21708.44 | 21673.78 | 21847.10 | 21673.78 | SL | -34.7 | -1.00R | |
| 3661 | SPX500 | 10.02.25 10:21 | BUY | 6061.06 | 6051.15 | 6100.71 | 6051.15 | SL | -9.9 | -1.00R | |
| 3660 | SPX500 | 06.02.25 10:20 | BUY | 6075.98 | 6068.32 | 6106.64 | 6068.32 | SL | -7.7 | -1.00R | |
| 3659 | NAS100 | 06.02.25 10:20 | BUY | 21726.85 | 21673.08 | 21941.91 | 21673.08 | SL | -53.8 | -1.00R | |
| 3658 | SPX500 | 05.02.25 10:31 | BUY | 6021.27 | 6011.53 | 6060.24 | 6060.24 | TP | +39.0 | +4.00R | |
| 3657 | NAS100 | 04.02.25 10:45 | BUY | 21550.21 | 21510.90 | 21707.48 | 21510.90 | SL | -39.3 | -1.00R | |
| 3656 | SPX500 | 31.01.25 10:42 | BUY | 6111.77 | 6107.26 | 6129.83 | 6107.26 | SL | -4.5 | -1.00R | |
| 3655 | NAS100 | 31.01.25 10:41 | BUY | 21796.76 | 21766.77 | 21916.72 | 21766.77 | SL | -30.0 | -1.00R | |
| 3654 | NAS100 | 30.01.25 10:52 | BUY | 21425.99 | 21380.58 | 21607.65 | 21380.58 | SL | -45.4 | -1.00R | |
| 3653 | SPX500 | 30.01.25 10:51 | BUY | 6051.53 | 6040.44 | 6095.87 | 6040.44 | SL | -11.1 | -1.00R | |
| 3652 | NAS100 | 28.01.25 10:45 | BUY | 21284.25 | 21232.65 | 21490.62 | 21490.62 | TP | +206.4 | +4.00R | |
| 3651 | SPX500 | 27.01.25 10:57 | BUY | 6004.41 | 5986.89 | 6074.50 | 5986.89 | SL | -17.5 | -1.00R | |
| 3650 | NAS100 | 27.01.25 10:53 | BUY | 21210.29 | 21107.60 | 21621.06 | 21107.60 | SL | -102.7 | -1.00R | |
| 3649 | NAS100 | 15.01.25 10:49 | BUY | 21176.76 | 21121.68 | 21397.10 | 21121.68 | SL | -55.1 | -1.00R | |
| 3648 | SPX500 | 14.01.25 10:22 | BUY | 5856.53 | 5842.11 | 5914.20 | 5842.11 | SL | -14.4 | -1.00R | |
| 3647 | NAS100 | 14.01.25 10:20 | BUY | 20909.92 | 20845.73 | 21166.66 | 20845.73 | SL | -64.2 | -1.00R | |
| 3646 | SPX500 | 13.01.25 10:52 | BUY | 5805.59 | 5786.58 | 5881.62 | 5786.58 | SL | -19.0 | -1.00R | |
| 3645 | NAS100 | 13.01.25 10:52 | BUY | 20676.52 | 20588.27 | 21029.50 | 20588.27 | SL | -88.2 | -1.00R | |
| 3644 | NAS100 | 10.01.25 10:56 | BUY | 20831.22 | 20759.40 | 21118.49 | 20759.40 | SL | -71.8 | -1.00R | |
| 3643 | SPX500 | 08.01.25 10:10 | BUY | 5901.35 | 5890.51 | 5944.72 | 5890.51 | SL | -10.8 | -1.00R | |
| 3642 | SPX500 | 07.01.25 10:30 | BUY | 5956.13 | 5942.09 | 6012.28 | 5942.09 | SL | -14.0 | -1.00R | |
| 3641 | SPX500 | 03.01.25 10:12 | BUY | 5906.56 | 5895.81 | 5949.53 | 5895.81 | SL | -10.7 | -1.00R | |
| Total: 485 | +45.3R | ||||||||||
How to calculate the lot size
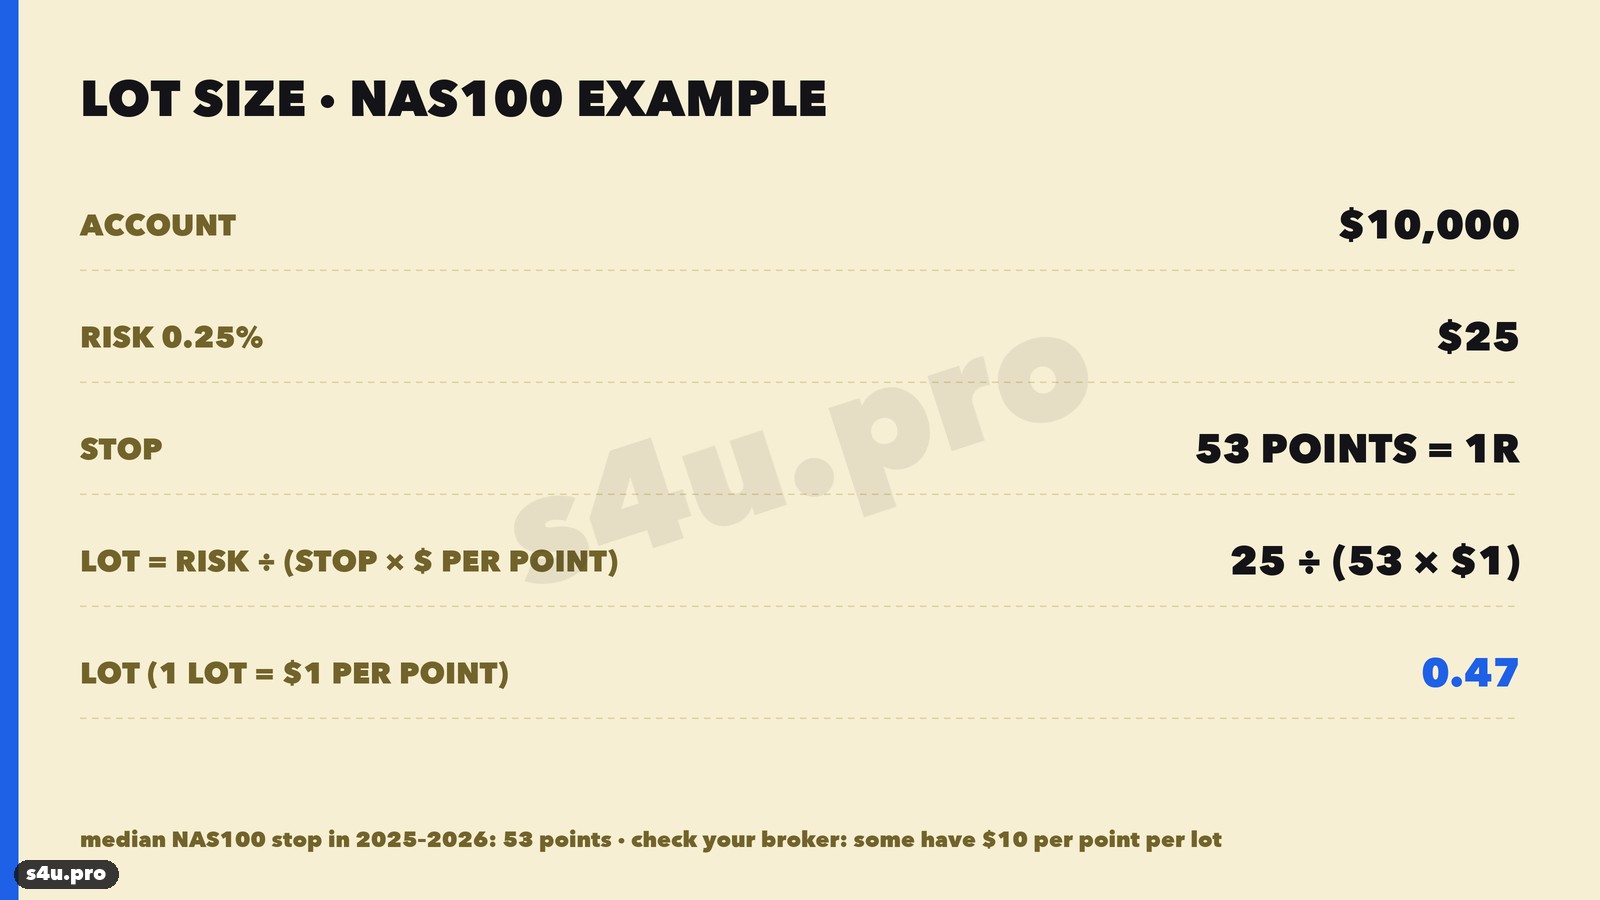
Risk is calculated from the stop: lot = risk amount ÷ (stop in points × point value per 1 lot). Index point values differ between brokers: at some 1 lot of NAS100 = $1 per point, at others $10 — check the contract specification in your terminal. Example: $10,000 account, 0.25% risk ($25), 53-point stop, 1 lot = $1 per point: lot = 25 ÷ 53 ≈ 0.47.
30% of trades win, there are streaks of up to 39 losses in a row, and the max drawdown is −87R. At 1% risk per trade that is −87% of the account, at 0.5% −43%, at 0.25% −22%. So the risk is 0.25% per trade, no more than 0.4%.Why it works
- 10:00–11:00 is decision time. The stock exchange opens at 9:30, and for the first half hour price is pushed around by opening orders and news. By 10:00 big players start building their positions for the day — hence the sharp moves and FVGs.
- An FVG is the footprint of a big player. Price passed the level so fast that not all orders were filled. A return to the middle of the gap gives a better entry with a short stop.
- The trend decides everything. With the daily trend the model earns, against it — loses. The FVG shows where to enter, the EMA200 shows which way.
- A short stop and a 4R target. The stop beyond candle 1 is small, so even 30% winners are enough to be profitable.
We also checked that the edge really comes from the FVG and not just from the trend. If on the same days you enter with the trend at a random minute of the window with the same stop, the result is around zero (−0.09R to +0.06R per trade). Entering at the middle of the FVG gives +0.14R per trade on NAS100 and +0.09R on SPX500.
The Silver Bullet with other SMC models
- Fair Value Gap — the core of the entry. The Silver Bullet is an FVG limited by time and trend.
- Kill Zones — the 10:00–11:00 window sits inside the New York session. For forex the working model is the London Kill Zone, for indices — the Silver Bullet.
- Liquidity sweep — on indices it does not help as a mandatory filter in this model (see the test above).
- BOS and CHoCH and order blocks — extra confirmations many traders add to the Silver Bullet.
We keep testing filters for this model and will publish the results separately.
Free EA for MT4 / MT5 + trade journals Get it freeCommon Silver Bullet mistakes
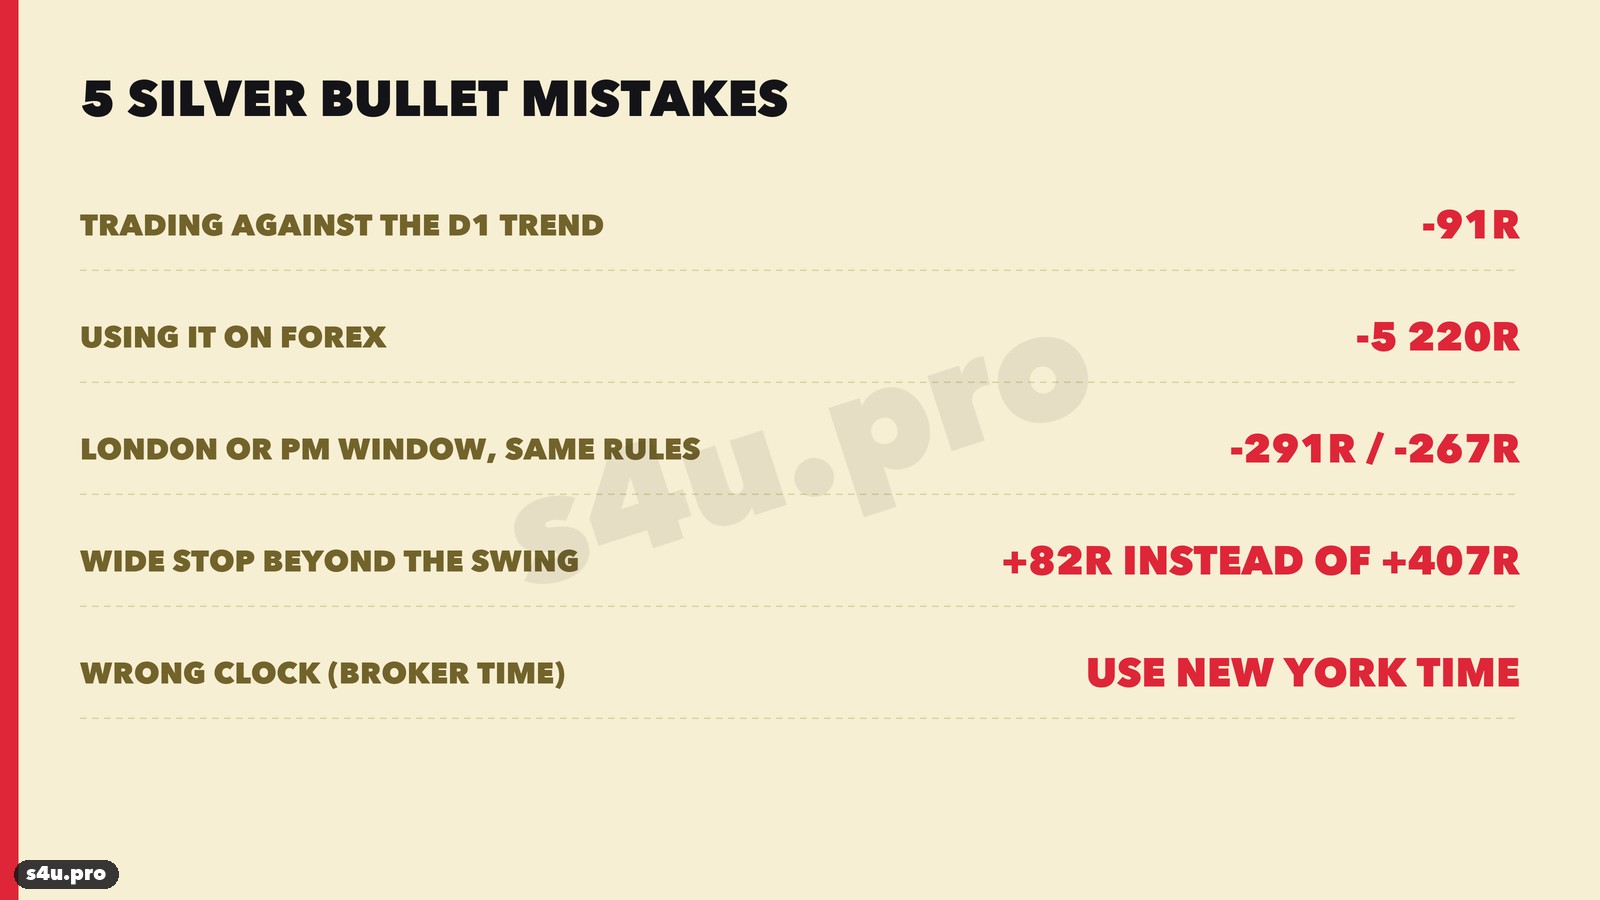
- Trading against the D1 trend. −91R. Even with no trend filter the result is half as good.
- Trading the Silver Bullet on forex. −5,220R on 16 pairs: the FVGs are too small for the spread.
- Using the same rules in the London or PM window. On indices 03:00–04:00 made −291R, 14:00–15:00 −267R.
- A wide stop beyond the whole swing. +82R instead of +407R.
- Wrong clock. The rules are in New York time. On a GMT+2/GMT+3 terminal the window is 17:00–18:00 and the exit is at 23:00. If your broker uses another time zone, convert. In March and November the US and Europe change clocks in different weeks — always check New York time.
FAQ: Silver Bullet questions
What is the Silver Bullet in simple words?
One hour of trading: from 10:00 to 11:00 New York time (17:00–18:00 at GMT+2/GMT+3, the afternoon in Europe), find an M5 FVG in the trend direction and enter with a limit order when price returns to its middle.
What time is the Silver Bullet in UTC and on the terminal?
10:00–11:00 New York time is 15:00–16:00 UTC in winter and 14:00–15:00 UTC in summer. On a GMT+2/GMT+3 terminal it is 17:00–18:00 all year. The 16:00 New York exit is 23:00 on the terminal.
Which markets does the Silver Bullet work on?
In our test — on the NAS100 and SPX500 indices. On 16 forex pairs the model loses; on gold the result is weak and unstable.
Which timeframe?
M5 to find the FVG and enter, D1 with the EMA200 for direction. You can also watch M1, but in our test FVGs were found on M5.
Enter at the FVG edge or at the middle?
At the middle (CE). The edge entry made more overall but lost in 2025. The middle entry is profitable in both 2025 and 2026.
Is a liquidity sweep needed before the FVG?
On indices in the 10:00–11:00 window — no. We tested three kinds of sweep; each cuts both the number of trades and the result.
Why a 4R target?
2R made +263R, 3R +364R, 4R +407R. If the target is not reached, close at 16:00 New York time.
What is R?
R is the stop size. −1R means the stop was hit, +4R means a profit of four stops. On NAS100 in 2025–2026 1R averaged 53 points; at 0.25% risk 1R = 0.25% of the account.
What risk should I use?
0.25% per trade, no more than 0.4%. 30% of trades win, losing streaks reach 39 in a row, the test drawdown is −87R.
How many trades per month?
About 11 on each index: the limit at the middle of the FVG does not fill every day.
Conclusion
- The Silver Bullet is an FVG entry inside a one-hour window. The best window is 10:00–11:00 New York time, i.e. 17:00–18:00 at GMT+2 in winter and GMT+3 in summer, the best markets are NAS100 and SPX500.
- The key condition is trading with the daily trend (close above or below the EMA200). Without it the result is half as good; against the trend it loses.
- Limit entry at the middle of the FVG, stop beyond candle 1, 4R target or exit at 16:00: +407R on 4,125 trades, 14 of 16 years in profit, 2025 +10R, 2026 +36R.
- The London and PM windows, forex and a wide stop lose or are much weaker. A mandatory liquidity sweep filter worsens the result.
- 30% winners, long losing streaks, a −87R drawdown. Risk 0.25% per trade.
Before trading a live account, test the strategy on demo and keep your own trade journal, as in this article.
Other strategies we have backtested
This article is for educational purposes only and is not investment advice. Trading forex and CFDs involves a high risk of losing money. Past results do not guarantee future profits. Data: 1-minute NAS100 and SPX500 index CFD quotes from histdata.com, November 2010 – October 2026, converted to New York time; FVGs were found on M5 candles, entries, stops and targets checked on 1-minute candles; the spread is included in every trade, real execution may differ.
 Point your phone camera here